Steemit Crypto Academy Season 3- Week 7 | -Analysis and Trading with the indicators "Stochastic Oscillator +" Parabolic SAR " | Homework post for Professor @lenonmc21
 )
)
Question 1. Define in your own words what is the Stochastic Oscillator?
The word Stochastic means random probably distribution. That's is something is described as being Stochastic if there is uncertainty involve in the outcome.
Stochastic oscillator is the momentum comparism of a financial assets closing price to a range of prices over a given time period. This is a powerful technical analysis indicator that has been used for over centuries, developed in the 1950s by George C. Lane, it tries to compares price movement of a financial asset over a period of time. It is used to determine overbought or oversold positions/levels in the market using the range bound from 0-100.
**Question 2. Explain and define all components of the stochastic oscillator (% k line,% D line + overbought and oversold limits).
To Explain the %k line and the %D line it is important that we know the formula for calculating stochastic oscillator.
The formula for CALCULATION of stochastic oscillator is ;
%K= 100(C-LN)/(HN-LN).
It is important to note that the N in the formula above refers to the number of days which is usually 14 days period for calculating the stochastic oscillator. How ever, this period can be varied according to the need or analysis of the trader.
Where:
- C= The recent closing price of financial asset in question.
- LN = The lowest price of the asset within a determined time period.
- HN = The highest price of asset within determined time period.
- %K= The current value of Stochastic oscillator
From the formula above, it is right to say Stochastic oscillator is gotten by substracting the lowest price of the period from the closing price and dividing it by the difference of the lowest price from the highest price of the period.
The stochastic oscillator indicator consist of two lines. The %K and %D line.
%K line.
The %K line is known as the faster line in the stochastic oscillator. That is to say, the %K line is more sensitive to price changes than the %D line. The %K line is mostly blue line on the chart
%D line.
As already mentioned above, the %D line is regarded as the slower Stochastic oscillator indicator since it response slowly to price and is the red line on the indicator. The %D line is gotten by taking a 3-period moving average of the %K line.
Overbought and oversold limits
As I earlier mentioned, the stochastic oscillator indicator is within the 0-100 range bound, this range helps in determining overbought and oversold positions in the Market.
Overbought position.
Typically, readings over 80 in the range bound indicates overbought positions. This is a sell signal in the market as it tells us that the financial asset might be overvalued and prices might reverse in the market.
Oversold position.
Contrary to the above rule, readings of 20 or below in the range bound on the stochastic oscillator indicator indicates an oversold positions and that the financial asset is approximately undervalue and at the lowest low. Anticipation of price reversal is paramount.
When the blue %K line crosses the %D line it indicates a strong trend reversal as price is assume to follow momentum.
Question 3. Briefly describe at least 2 ways to use the Stochastic Oscillator in a trade.
Buy signal.
Traders can use the stochastic oscillator indicator to trade in the Market. As already mentioned, the %K is the actual and fastest stochastic oscillator indicator while the %D is the slow moving average indicator. And also as earlier mentioned, when the two lines intersect it indicates a trend reversal.
A buy signal is important in the market when the %K and %D line fall below the 20 oversold level. Traders are always advice to wait for %D line to rise above the 20 level.
Sell signal.
In case of a sell signal, both the %K line and the %D line should rise above the 80 Overbought level. When this happens, it indicates a sell position but also, traders are advice to wait for the %D line yo fall below the 80 level.
Divergence Stochastic oscillator.
Also, another important Signal in the stochastic oscillator is the divergence. As the word divergence means two things moving apart. In this case it's price and stochastic oscillator.
When prices experiences a lower low yet the stochastic oscillator is experiencing a higher low, this indicates a Bullish reversal.
MeanWhile when price is experiencing a higher high while the stochastic oscillator is experiencing a lower high, it signals a bearish reversal.
** Question 4. Define in your own words what is Parabolic Sar?**
Parabolic SAR sometime written as PSar is a technical analysis indicator that was developed by J Welles Wilder to determine trend movement of financial assets.
Also known as the Stop And Reverse where the name SAR comes from. The PSar is indicated on a chart by dots along price movement. The dots appear above the price movement during a downward trend and below the price when trend is in an upward movement. The PSar can be used together to indicates buy and sell signals.
Question 5. Explain in detail what the price must do for the Parabolic Sar to change from bullish to bearish direction and vice versa.
As we have stated above, the Parabolic SAR is represented on the chart by dots along the price movement. The position of these dots indicate to us if the market is bullish or bearish and a flip in the position of the dots can also signal reversal.
In a situation where the dot is above the price movement, this indicates that the market is in downtrend. If the dots out of a sudden flip position and moves below the moving price, this indicates a buy signal as the market is expected to bull.
On the other hand, when the dots are below the moving price, it is a bullish market and an uptrend. When the dots flip position and go above the price movement, this indicates a sell signal and bearish market.
Question 6. Briefly describe at least 2 ways to use Parabolic Sar in a trade?
I will be discussing two ways in which to use Parabolic SAR in a trade.
Bullish Trend.
We did mention above that when the doted Parabolic SAR indicator is above the price movement it indicates a downtrend and not a great position to buy. When the dots crosses below the price movement, then a bullish trend is indicated and traders can enter a trade.
Bearish Trend.
Conversely, when price is above the dot Parabolic SAR indicator, it means the market is already in a Bullish market. Immediately as price move below the dots Parabolic SAR indicator, then prices might tend to fall and thus the Parabolic SAR indicator signals a reversal and a bearish trend.
Question 1. It shows a step by step on how to add the Stochastic Oscillator to the chart (Indicating the% k Line and the% D Line, the overbought and oversold zone.
We will be using Tradingview to illustrate the steps involve
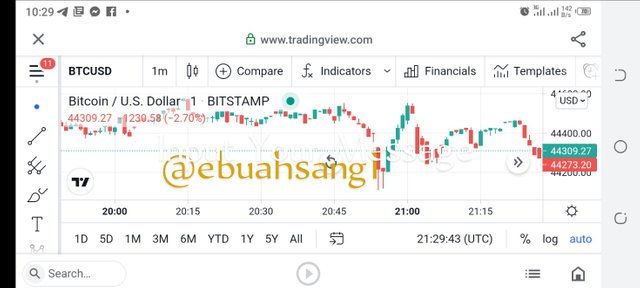
Step one. First thing to do is open a trading chart on Tradingview.
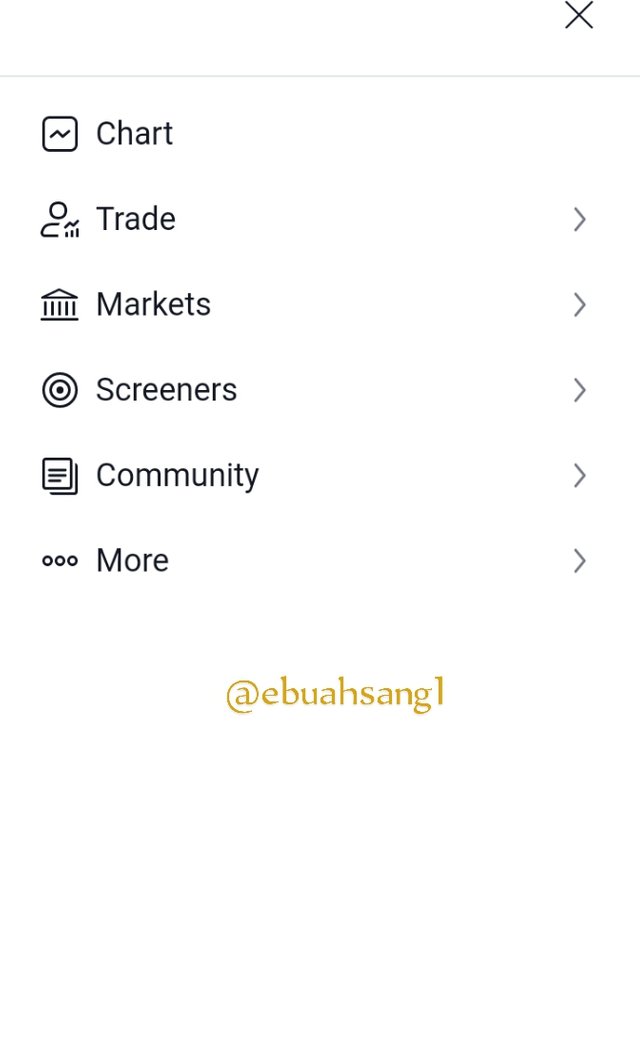
Step two. At the top center of chart is an icon fx indicators, we will click on it.
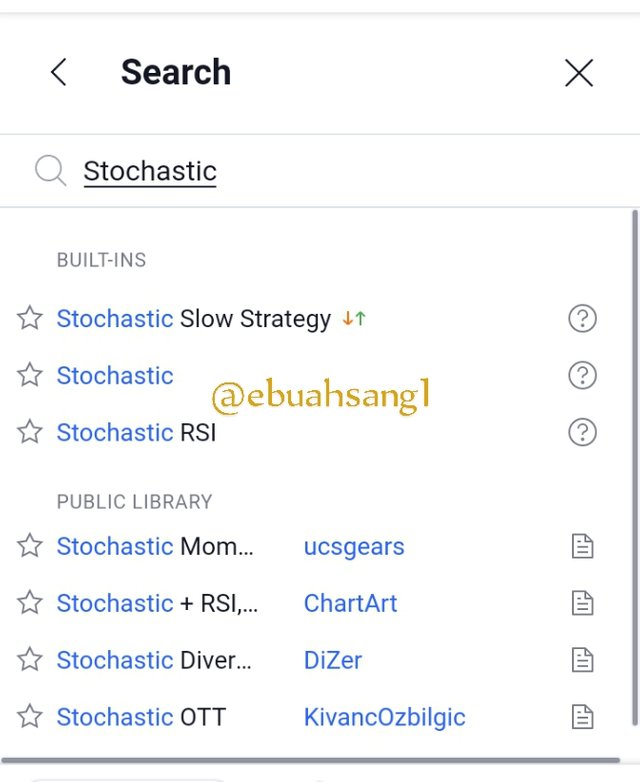
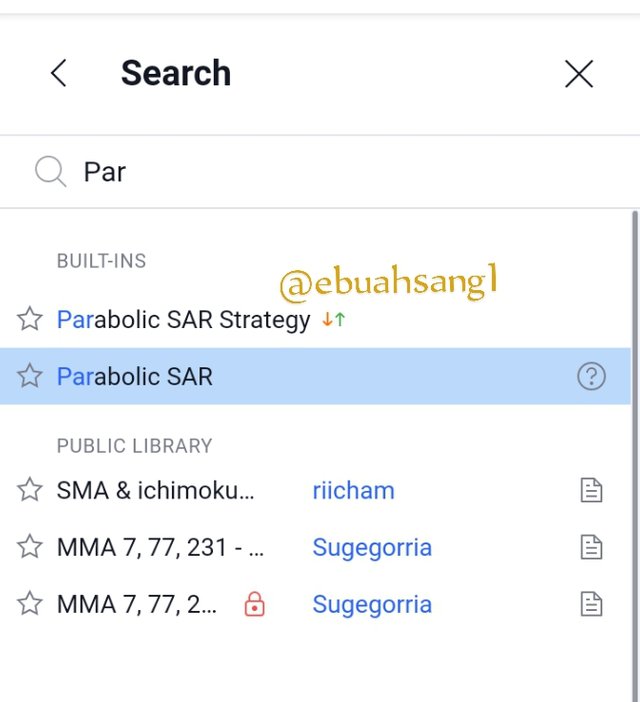
Step three. A new page will pop-up. On the search bar we will type Stochastic oscillator and click search.
Step four. We will go back to the trading chart. As can be seen on the chart, the Stochastic oscillator indicator has been added.
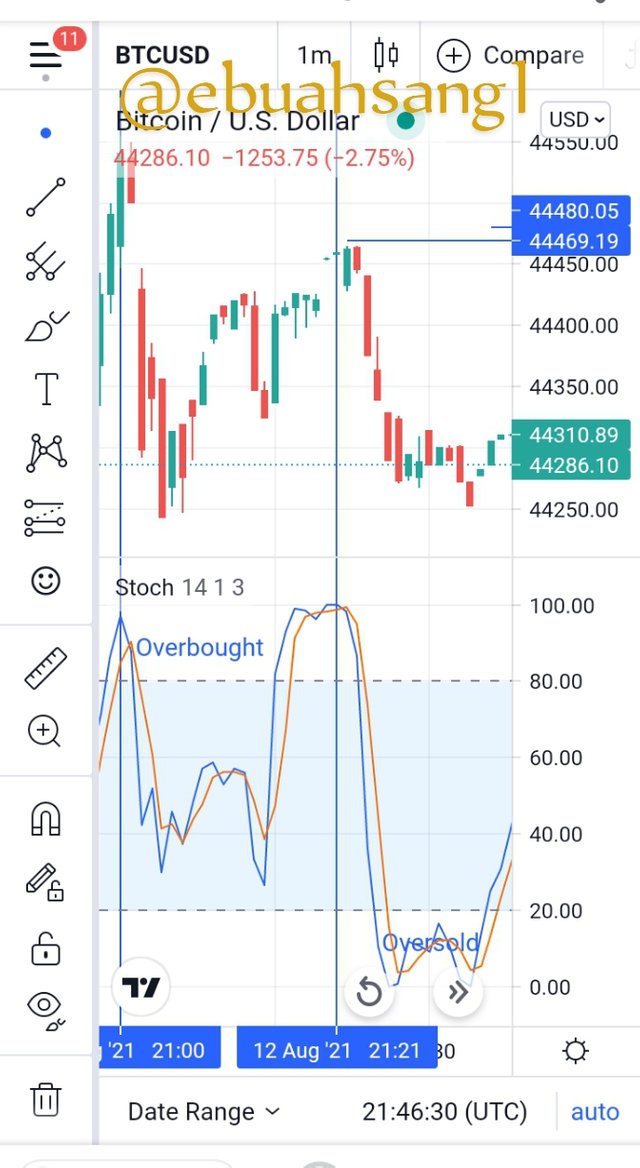
From the image above, the blue line is the %K faster Stochastic oscillator indicator while the red line is the %D slower Stochastic oscillator indicator.
The cross above the 80 Overbought level definitely indicates a reversal in the market while the cross below the 20 oversold level is a buy signal.
Question 2. Show step by step how to add Parabolic Sar to the chart and how it looks in an uptrend and in a downtrend.
Step one. First thing to do is open a trading chart on Tradingview.
Step two. At the top center of chart is an icon fx indicators, we will click on it.
Step three. A new page will pop-up. On the search bar we will type Parabolic Sar and click search.
Step four. We will go back to the trading chart. As can be seen on the chart, the Parabolic Sar indicator has been added.
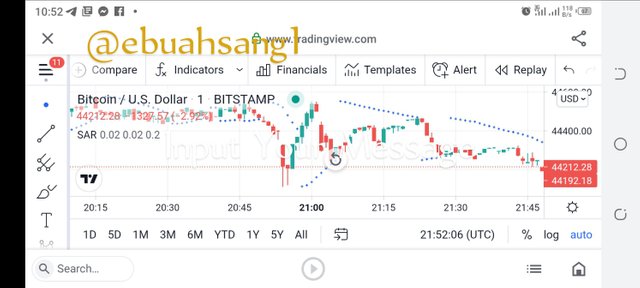
As seen on the image above. During a downtrend, the parabolic SAR is above price while during an uptrend the Parabolic indicator is below the price movement.
3.Add the two indicators (Stochastic Oscillator + Parabolic Sar) and simulate a trade in the same trading view, on how a trade would be taken.
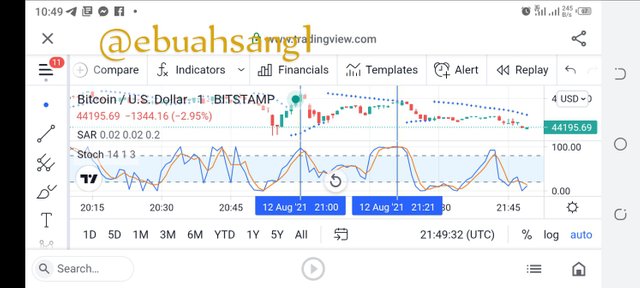
The image above is a chart where both the Stochastic oscillator indicator and the Parabolic SAR indicator are used in synergy.
As can be indicated on the chart link by the vertical lines, those are selling positions. Positions where the Stochastic oscillator is above the 80 level and the red %D line crosses over the %K line while the dots of the Parabolic SAR is above price and about to flip in the case of the second vertical line. This is a strong sell signal as there is evidence of overbought and flipping of position by the Parabolic SAR indicator.
Conclusion.
The Stochastic oscillator indicator is one of a very vital indicator in business world and as we can see it dates right back to 1950s, meaning it has stood the test of time. It also a good and accurate indicator.
Also, the Parabolic indicator is quite a unique and simple to use indicator. Signaling stop and reversals positions. It also a good indicator.
Using the Stochastic oscillator and Parabolic SAR indicators in synergy is a good match. As can be seen on the image above, it gives great signals.
I want to thank you professor for the lectures. I understand so much and I love reading your lessons. Thank you professor.
CC.
@lenonmc21