Steemit Crypto Academy Season 3 Week 2 - Beginner's Course | Introduction to Charts Homework for professor @reminiscence01 by @ebuahsang1
Pinterest, Edited"Postermywall"
Question 1. Explain the Japanese Candlestick Chart? (Chart screenshot required)
Question 2. Describe any other two types of charts? (Screenshot required)
Question 3. In your own words, explain why the Japanese Candlestick chart is mostly used by traders.
Question 4. Describe a bullish candle and a bearish candle identifying its anatomy? (Screenshot is required)
Explain the Japanese Candlestick Chart? (Chart screenshot required)
The Japanese Candlesticks is one of the most used and important technical analysis tool that is being used by traders to analyze the movement of price in the stock and forex market. This concept was initialized by Munehisa Homma a Japanese rice trader. During his routine trading in the market, he discovered that markets especially the rice market was influenced by emotions while recognizing the influence of demand and supply.
Candlesticks is a graphical representation of prices movement in the market, with the help of candlesticks, traders are able to identify patterns of price movement and make reliable trading decisions on the short-term and long term bases.
Japanese Candlestick Anatomy
The Japanese candlestick is made up of 4 parts that is OPEN, CLOSE, HIGH and LOW with each of them playing a vital role in indicating price movement at a particular time.
As earlier mentioned, the candlestick has four main parts, we will discuss in detail what it means here.
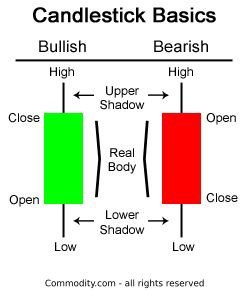
Open. (Opening price)
The open is where at which the candlestick starts. The opening price is not always located at the top of the candlestick; the position of the opening price always determine which type of candlestick.
Close. (Closing price)
The close price is the price at which the candlestick close, that is a record of the closing price of the candlestick.
High. (Highest Price)
The high is the highest price that is recorded by a candlestick in the market.
Low. (Lowest price)
This is the part of the candlestick that recorded lowest price. The interaction between this gives us the other areas of the candlestick, which are the Shadow and real Body. In some candlesticks, the shadow or body may be absent, that is in cases where the opening and closing price is the same.
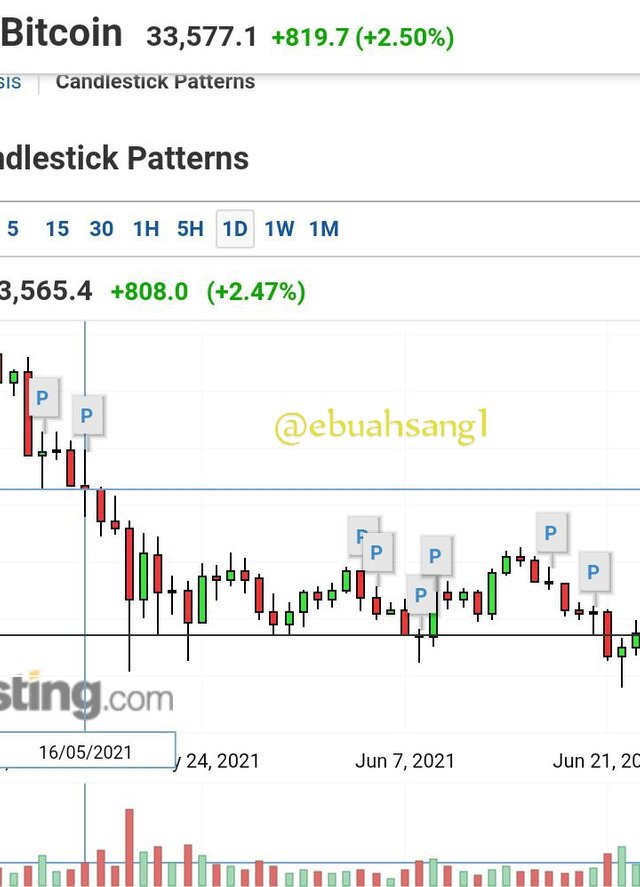
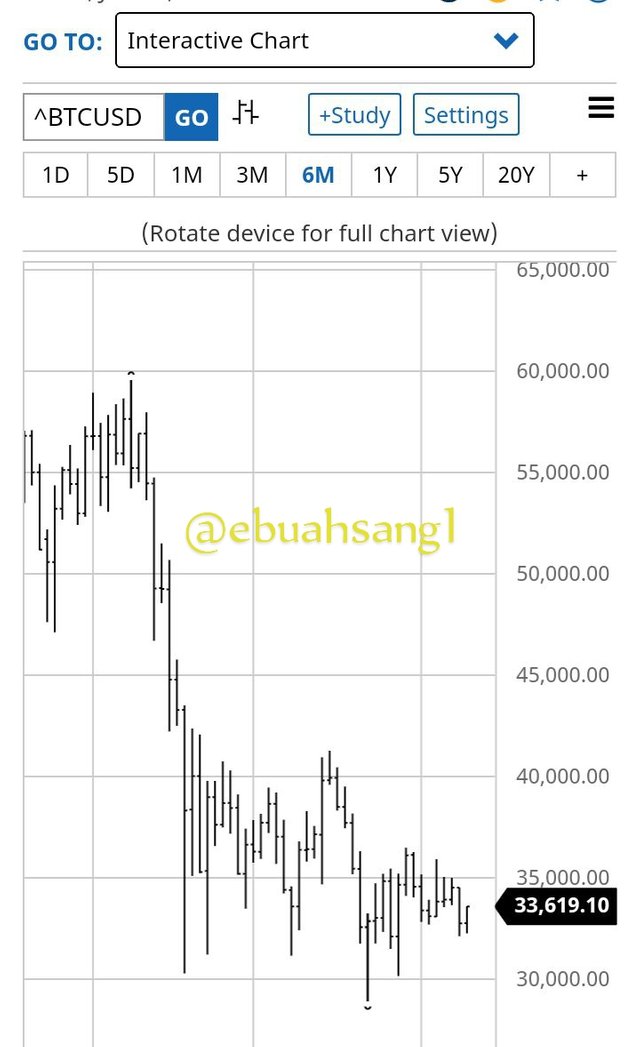
Describe any other two types of charts? (Screenshot required)
A line chart
A line chart is one of the most common type of chart used. This chart shows the movement of prices and indicates closing prices. Closing prices are represented by dots then these dots are then connected by lines to give a graphical representation. A careful study of line chart can indicate price movement but it is limited in showing appropriate analysis since it tracks
only closingg prices and nothing else.
(SCREENSHOT)
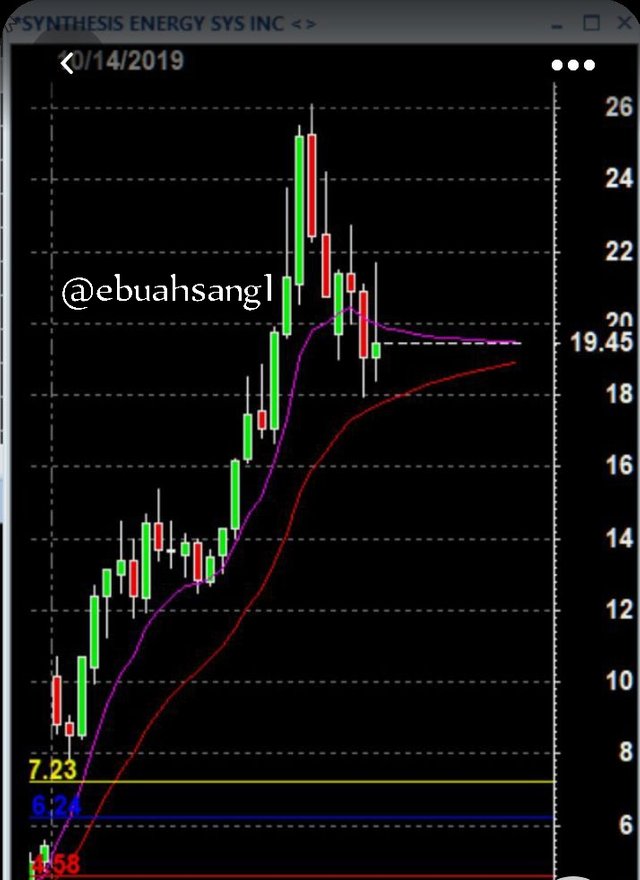
Bar charts.
Similar to both the candlestick charts in that the four parts, OPEN, CLOSE, HIGHand LOW. In bar chart the opening price also known as opening foot always faces the left while the closing price also called the closing foot faces the right. It’s an easy read since traders can easily see how prices transmit from one chart to the other.
(SCREENSHOT)
In your own words, explain why the Japanese Candlestick chart is mostly used by traders.
Price movement.
The candlestick gives the most insight to price movement in the market as each point, showing the starting and closing price as well as interaction or struggles between buyers and sellers.
Easy to Read.
Just by looking at a candlestick graph, a trader can easily identify whether the market is weak, strong or where the trend is going.
Risk Management.
The candlesticks give more insight on prices and other factors, these help the traders to determine whether a trade is risky or not.
Describe a bullish candle and a bearish candle identifying its anatomy? (Screenshot is required)
The interaction between the opening price and closing price gives rise to what we call the Bullish or Bearish Candlestick.
The Bullish candlestick show an increase and positive movement of price, that is when price open at a lower price and close at a higher price. In a bullish candles stick, the opening price is always at the low while the closing price is at the high.
screenshot Pinterest
Bearish candlestick
Bearish candlestick is the opposite of bullish candlestick. The bearish candlestick shows a downward trend in the movement of price. In the bearish candlestick, the opening prices is at the high while the closing price is at the low.
image source
Conclusion
It is very vital as trader for one to be capable of reading the various charts that indicate price movement and understand in details the information that is given by the graph. This will help recognize various entry and exist points in the market and as we can see the most used and reliable charts used by traders is the candlestick graph.I want to thank professor for this wonderful lesson.
CC.
@reminiscence01
Hello @ebuahsang1, I’m glad you participated in the 2nd week of the Beginner’s class at the Steemit Crypto Academy. Your grades in this task are as follows:
Observations:
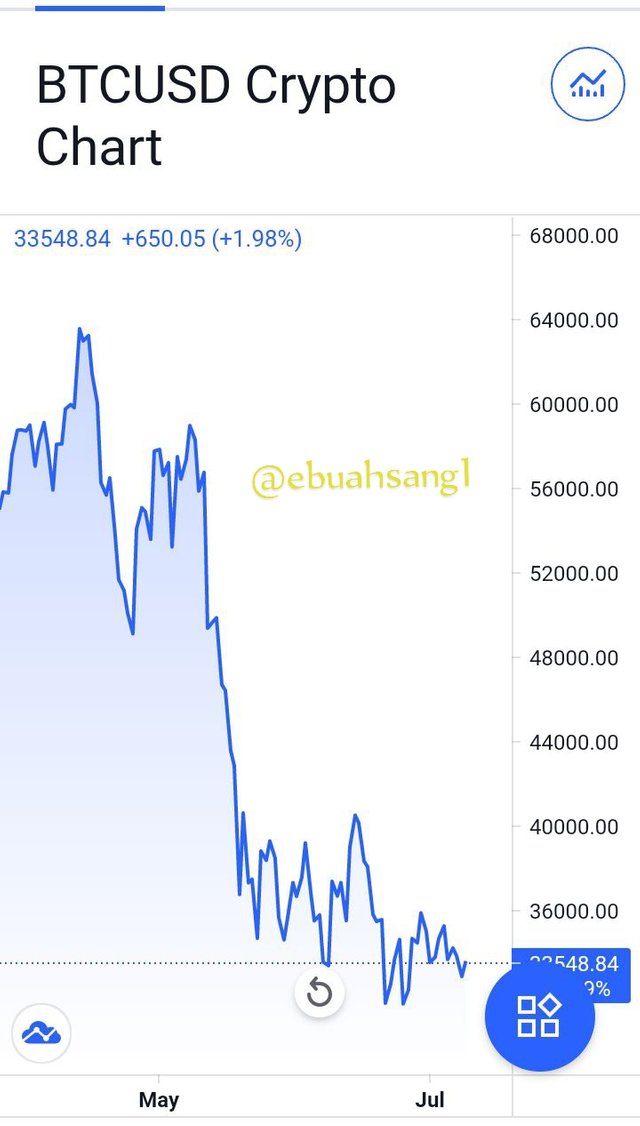
This image has a water mark of investing.com and you did not provide the source of the image. Please remove this image and use a copyright free image.
Recommendation / Feedback:
You need to soend time to produce a quality content. Also, you need to improve your writing skills. Thank you for participating in this homework task.