(Repost)- Candlestick Patterns-Steemit Crypto Academy Season 4 Beginners' course - Homework Post for Professor @reminiscence01 Task 10
Pinterest, edited in Postermywall"
1a) Explain the Japanese candlestick chart? (Original screenshot required).
b) In your own words, explain why the Japanese Candlestick chart is the most used in the financial market.
c) Describe a bullish and a bearish candle. Also, explain its anatomy. (Original screenshot required)
)
Developed by a Japanese rice trader right back in the 1700s, Japanese candlestick is one of the most used tools by traders in the financial market all over the world. The concept was developed by Munehisa Homma a rice trader in Japan in his effort to try and describe the relationship between buyers and sellers in the Market.
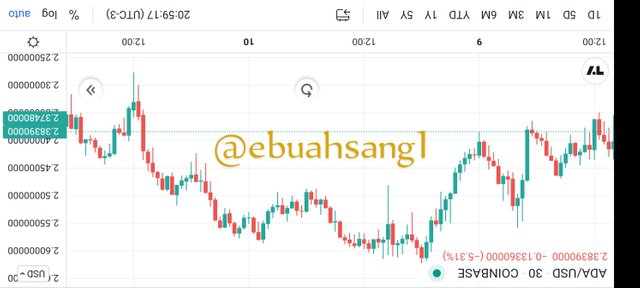
Screenshot"
The Japanese candlestick can be defined as a price chart that indicates the opening, closing, highest and lowest points of price in a market over a given period of time be it one hour, day, week or month.
Traders all over the world use the candlestick pattern to predict price movement, reading similar candlestick shapes. There are over 18 shapes of candlesticks.
Today all over the whole, the Japanese candlesticks is the most preferred chart that is being used amongst traders for the following reasons.
Offers more information and insights
Traders love the candlestick because it offers more insights into price. The candlestick offers highest price, lowest price, opening price and closing price of any period at the first glance.Easy to Read. The Japanese candlestick pattern is very easy to read. Fr example, the colorization of the candlestick helps traders easily know price movement. A red candlestick means falling prices while a blue or green candlestick indicates rising prices.
Reliable Pattern movement. Candlestick have patterns and sharps. The sharp of the candlestick can help traders in predicting price movement as from the shape of a candlestick, traders can clearly see what happened to the price over the period of time.
Candle show Emotions. Also, it is important for us to note that the development of candlestick was as a result of Homma trying to study the emotions in the market, the law of supply and demand. Candlestick patterns also help traders to get the emotion in a Market.
The most important reason why candlestick pattern are preferred is because of the ability of to give the four points of price moments at any given period. Traders are able to see opening, Closing, Highest and Lowest price in the market
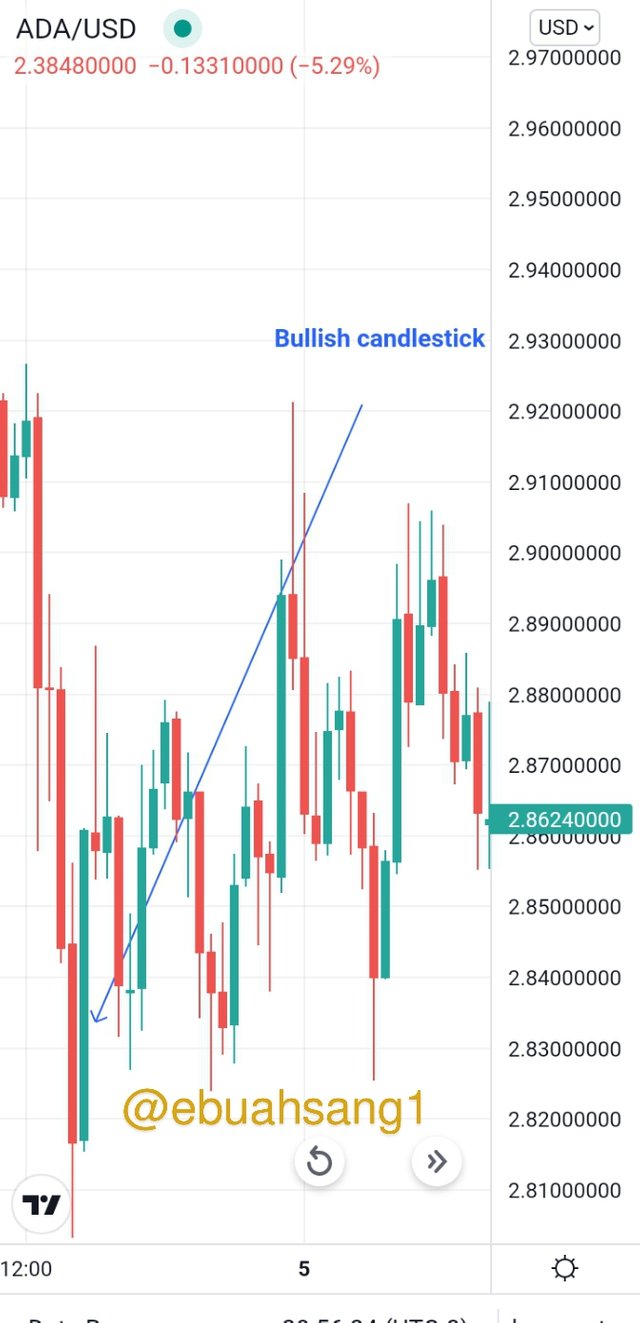
Bullish Candlestick..
A bullish candlestick is a reversal candlestick which is mostly formed at the bottom of a downtrend. The Bullish candlestick is mostly colored white or green. The Bullish candlestick usually indicates that buyers are taking over the market and price are in an uptrend movement.
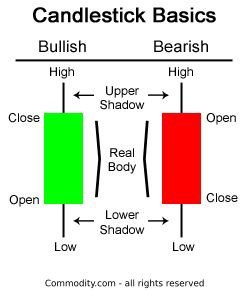
Anatomy of candlesticks.
The anatomy of a candlestick usually consist of four main parts/point, opening price, closing price, Highest price and lowest price. The interaction of these different points give rise to two other parts, the body of the candlestick and the shadow of the Candlestick.
Part of a candlestick.
Pinterest"
Opening price: The opening price is the price at which the market opens for the period.
Closing price. This is the point/price at which the market closes for the period and is the last price of the period.
Highest price. The point is the highest point at which price touched during a specific period.
Lowest price. This is the lowest point price reach during a specific period in the market.
The other two parts of that are formed as an interaction between this four points are the body and shadow.
Body. The body in a candles is the difference or distance between the opening price and closing price. The greater the distance the greater the body and the smaller the distance the smaller the body.
Shadow. The shadow is the difference or distance between the closing/opening price and the highest/lowest price.
Anatomy of a Bullish candlestick.
In a bullish candlestick, the closing price of the period is always above the opening price on the market and as we remember, it is either a green or white candlestick. And the length of the Bullish candlestick engulf the previous bearish candlestick.
Screenshot"
As we can see from the image above, the Bullish candlestick comes immediately after a red Bearish Candlestick.
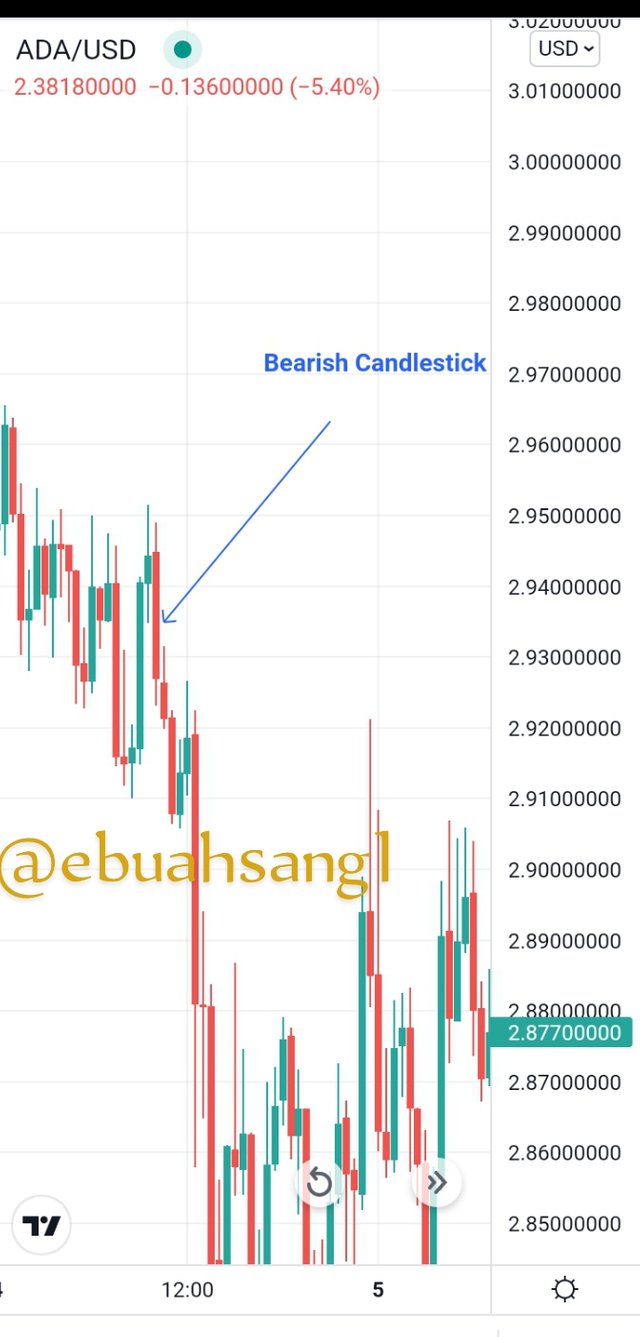
Bearish Candlestick..
Conversely to the bullish candlestick which starts at the end of a downtrend or after a bearish candlestick, the Bearish Candlestick forms after a bullish candlestick or at the end of an uptrend market.
Bullish candlestick usually indicates that sellers are taking over control of the market and the market is in a reversal probably a downtrend. The Bearish Candlestick is red or black Candlestick in the market.
Anatomy of Bearish Candlestick.
Unlike the bullish candlestick where closing price is a above opening price, in a bearish candlestick, the closing price is below the opening price. Meaning prices are closing lower than they open, that is a drop in price.
Screenshot"
As you can see from the screenshot above, the bearish comes after the Bullish candlestick and price is in a downtrend.
Candlestick as can be seen are the most useful charts patterns in the world. Easy to read and interpret. It is advisable for all traders to have a better understanding of what they represent.
I want to thank professor @reminiscence01 for this amazing lecture. It is clear, precise and important Lecture.
CC. Professor @sapwood
Professor @sapwood. I don't understand.
My repost will expire in a hours. After it does will I repost it again. I'm really unfortunate this season.
I thought to bring it to your notice. Thank your sir.
Kindly do a repost again and mention me by following the same rules as you did.