Crypto Academy / Season 3 / Week 8 : Crypto Assets and the Random Index (KDJ) Homework post for Professor @asaj by@ebuahsang1
Pinterest, edited in Postermywall"
Question 1. In your own words define the random index and explain how it is calculated
The random index also known as the KDJ is a new technical analysis tool that is being used in the financial market to determine entry and exit position in a trending market.
Inspired by George Lane, the KDJ indicator is similar to the Stochastic oscillator indicator in that it tries to measure momentum in the market. Like the Stochastic indicator, there is a %K line, %D line and an additional %J line wherefore the name KDJ comes from. The %K and %D line is same as in the Stochastic oscillator indicator where %K is the faster line which is more sensitive to price changes over a period of time. The %D line is the 3-Moving average of the %K line and it is not as sensitive as the %K line. The third line in the KDJ indicator is the %J line which represents the divergence of the value D from the %K line.
It is important to note that the KDJ indicator is best to be used in trending market and not in flat market as it turns to give false signals in flat market. It is equally important to note that the KDJ indicator is used when the three lines converge and the %J line crosses the %D and %J line from the bottom in an overbought zone, then it is a good sell signal and vice versa when the J line crosses below the %k and %D line in an oversold zone, it is a good buy signal.
To calculate the KDJ indicator, we will need to first get the Highest price, Lowest price, and closing price of the a chosen period.
After which we have to calculate the Reserve Value of the asset for the day(RSV). The formulas for calculating the reserve value is
RSV=(CN-LN)/HN-LN)*100.
Where
N = Chosen period.
CN= Closing price of the period
LN = Lowest price of the period.
HN= Highest price of the period.
After calculating the RSV, we need to then calculate K and D value. The formula is as follows:
K value of the day (Kn) = 2/3Kn1+1/3RSVn
D value of the day (Dn) = 2/3Dn1+1/3Kn
There for the formula for J is
J value = 3Kn-2Dn.
Where
Kn1= previous day K value
Dn1= Previous day D value
Kn = K value of the day
Dn = D value of the day.
50 is usually used in cases where the Kn1 or Dn1 are not known.
Question 2. Is the random index reliable? Explain.
It is a known fact all over the trading world that no signal is perfectly accurate. A lot of variables are involve in a real life situation and so no technical analysis tool is completely reliable.
However, the KDJ indicator is a reliable indicator to use in the short term or in a trending Market. It is a momentum indicator and thus measures the momentum in the market.
So the KDJ indicator is not a reliable and accurate indicator to use in a flat market because it might give false signals. The KDJ indicator like all other indicator is good and more reliable when used with other indicators.
Question 3. How is the random index added to a chart and what are the recommended parameters? (Screenshot required)
There are three basic steps to adding the KDJ indicator in a chart. For the purpose of this homework, we will be using Tradingview.
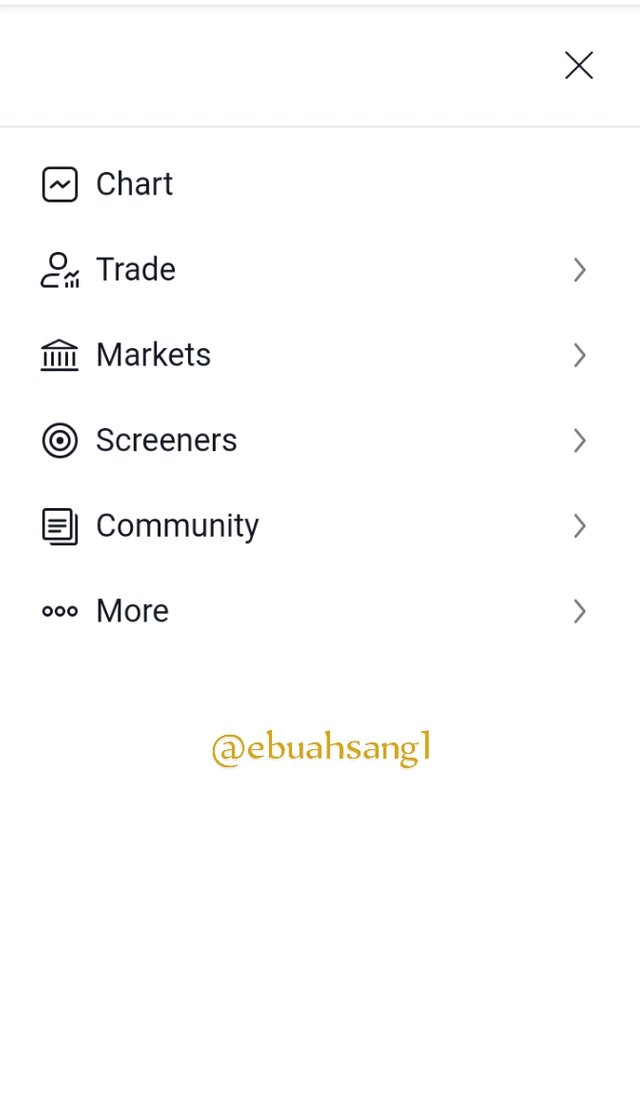
- Step one. The first thing to do is to launch a chart on the Tradingview platform.
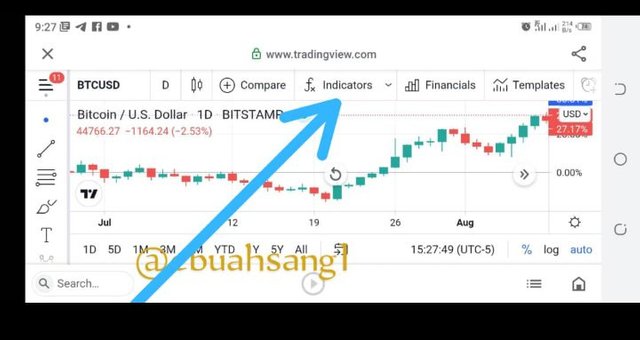
- Step two. At the top center of the chart on Tradingview, there is an Icon labeled fx indicators. We will click on it.
- Step three. After we have clicked on the fx indicators, a new page will pop-up. We will type KDJ on the search bar and the KDJ indicator will display. We will then click on it.
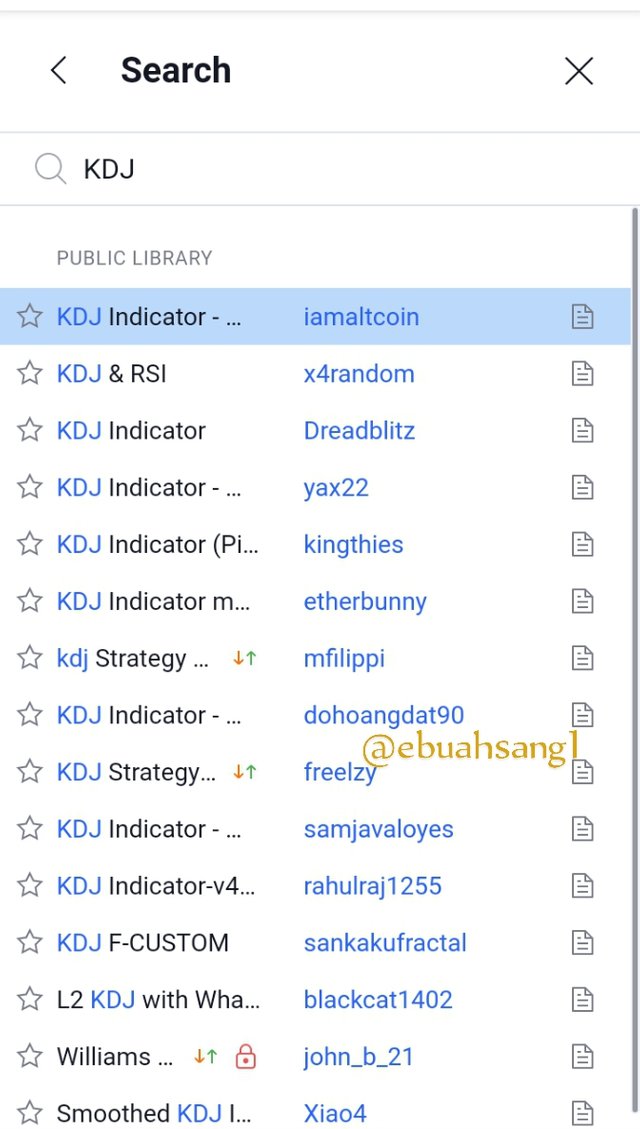
- And there we have our indicator as seen below.
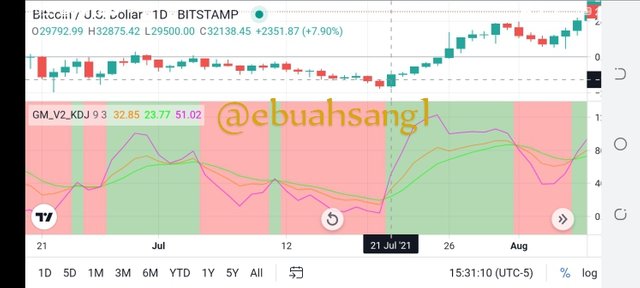
Input.
As already stated above, the KDJ indicator is best suited in the short run and when market is in a trend. It is therefore important to set the time period to a shorter period. A recommended period is 9 period and 3 signal.
If we Wish to change this on the chart, we click on the indicator on the chart. Then we click on the setting icon.
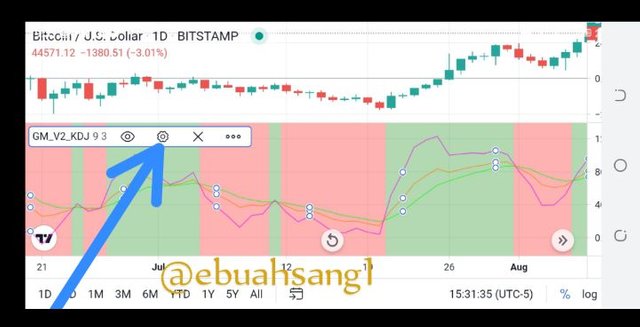
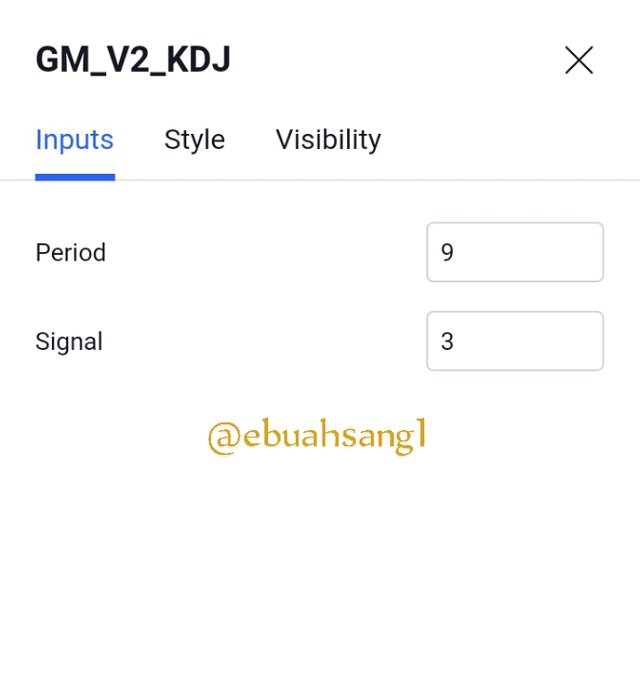
Under the input we can change the period if we want to, but we are going to use the default period which is 9 days and 3 signal.
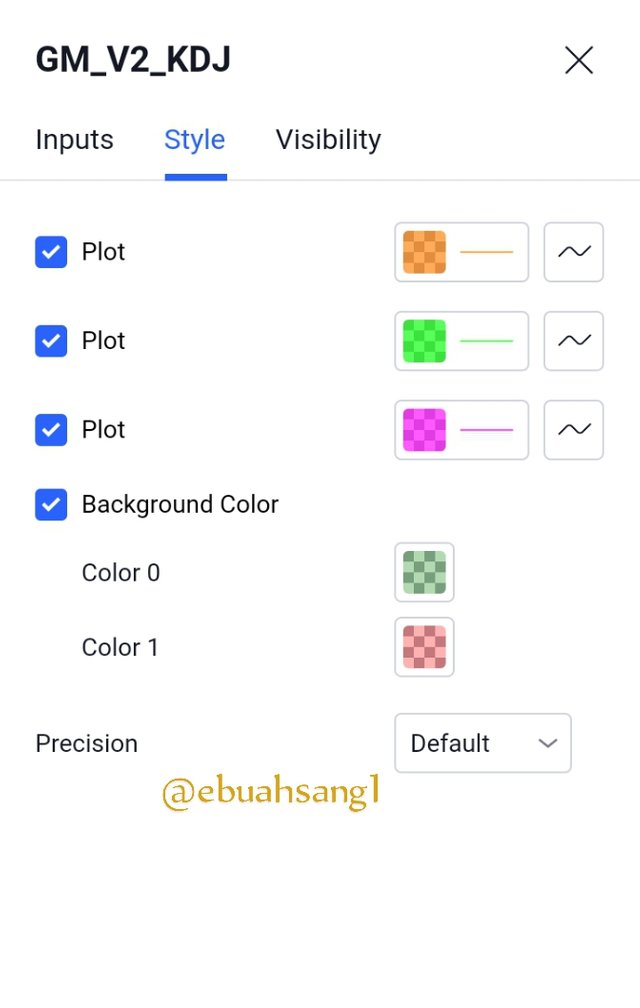
Style.
We can also edit and vary the color of the %K, %D and %J line. The %K line is green, while the %D line is orange. The %J line is purple and we can change the color to anything color we want under Style.
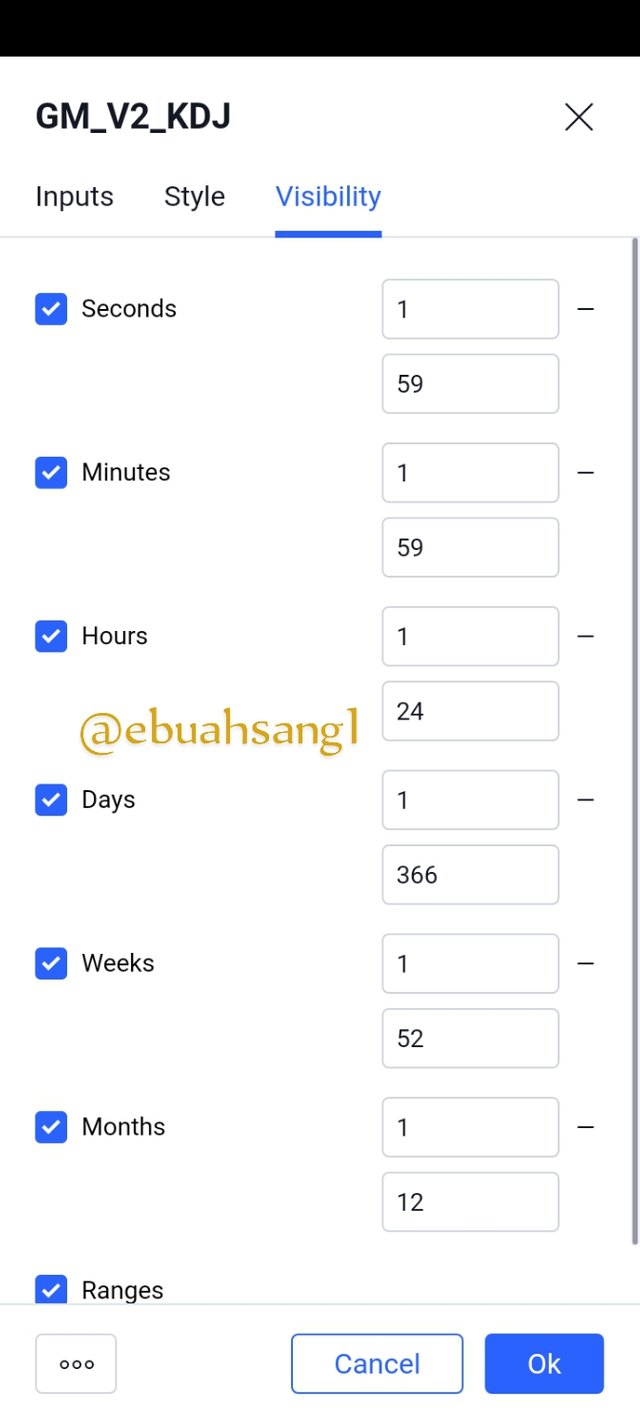
Visibility.
Under the visibility parameter, we can vary the minute, hour, days and week on our KDJ indicator.
Question 4. Differences between KDJ, ADX, and ATR
| Random index KDJ | Average Direction index ADX | Average True Range ATR |
|---|---|---|
| Evaluate price trend to identify overbought and oversold positions | Determine the trend strength of a financial asset | Determine the volatility of an asset of within a specified range. |
| KDJ is a three line indicator, %K, %D and %J | ADX is a one line trend | A one line indicator. |
| A good indicator of price direction since it indicates price movement | Does not indicate price direction, it just shows the strength of the trend | Doesn't indicate price direction either. |
| KDJ has a default of 9,3,3 | Default of 14,14,14 | Default of 14, 14, 14. |
Question 5. Use the signals of the random index to buy and sell any two cryptocurrencies. (Screenshot required)
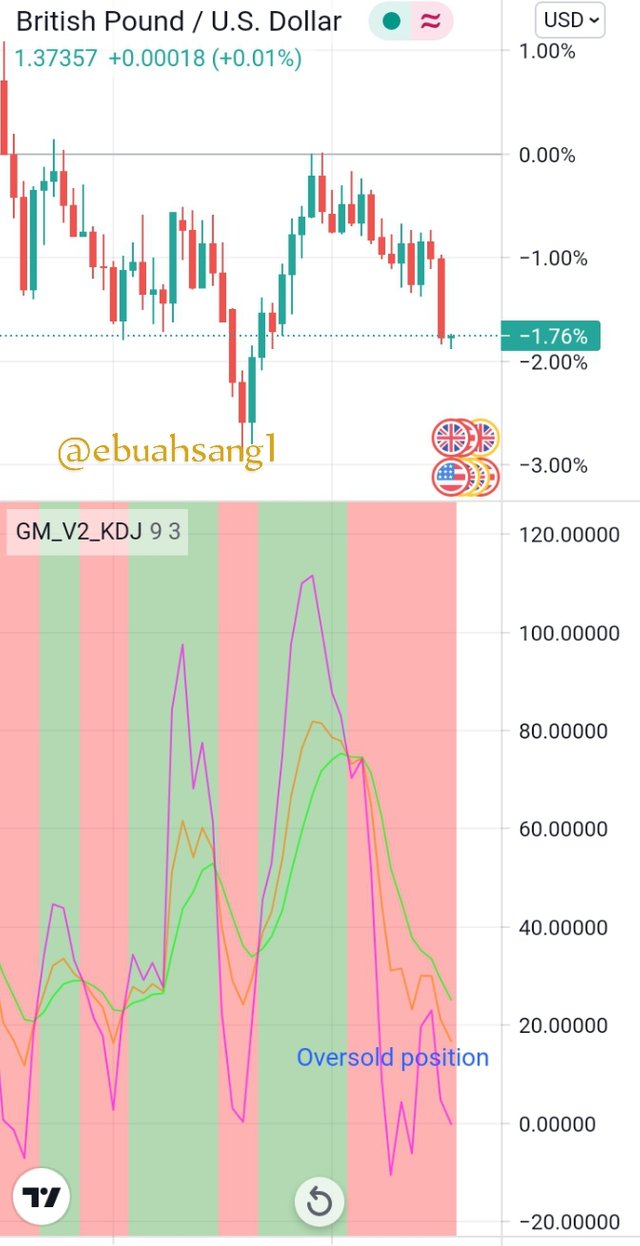
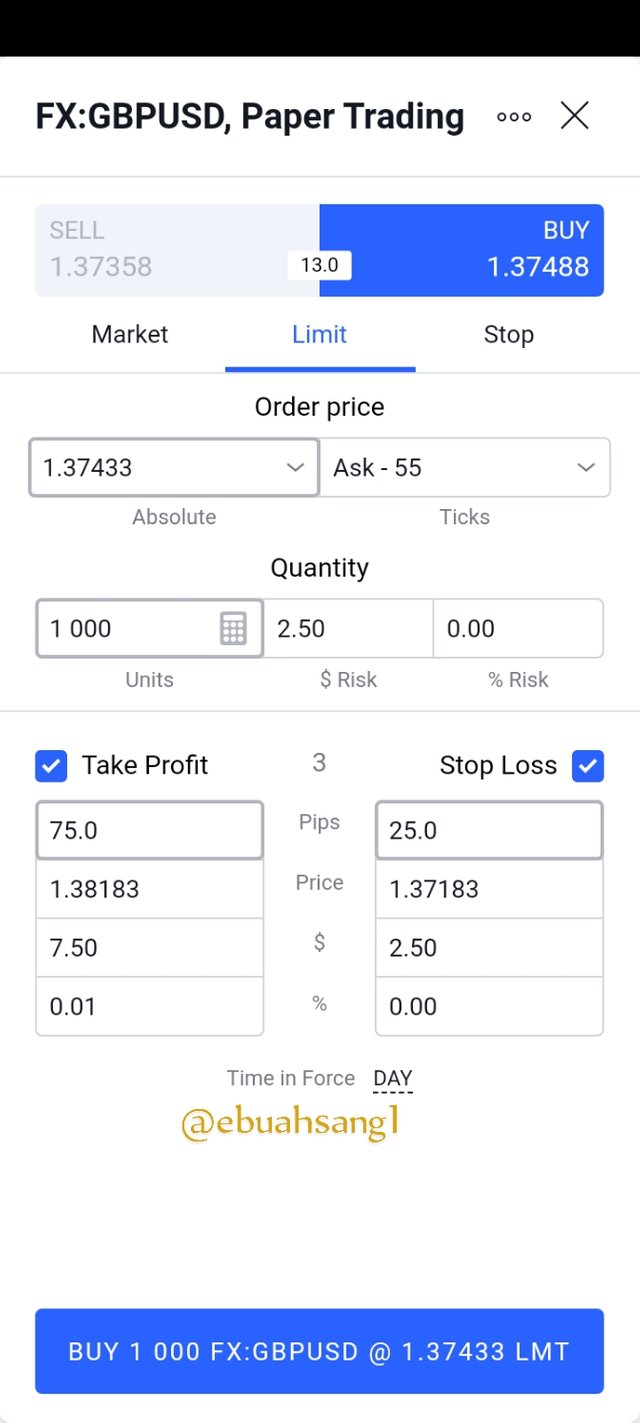
Buy Signal ( GBPUSD)
Using the KDJ indicator to analyze trade on a chart, I will be buying the GBPUSD in the forex market. A buy signal in a KDJ signal occurs when the three line are below the 20 level. This level is an oversold level and indicates a buy signal in the nearest future. We can see from the chart illustration that the %J line is below the %K and %D lines.
It is for this reason that I decided to place a buy trade on this asset anticipating a price reversal.
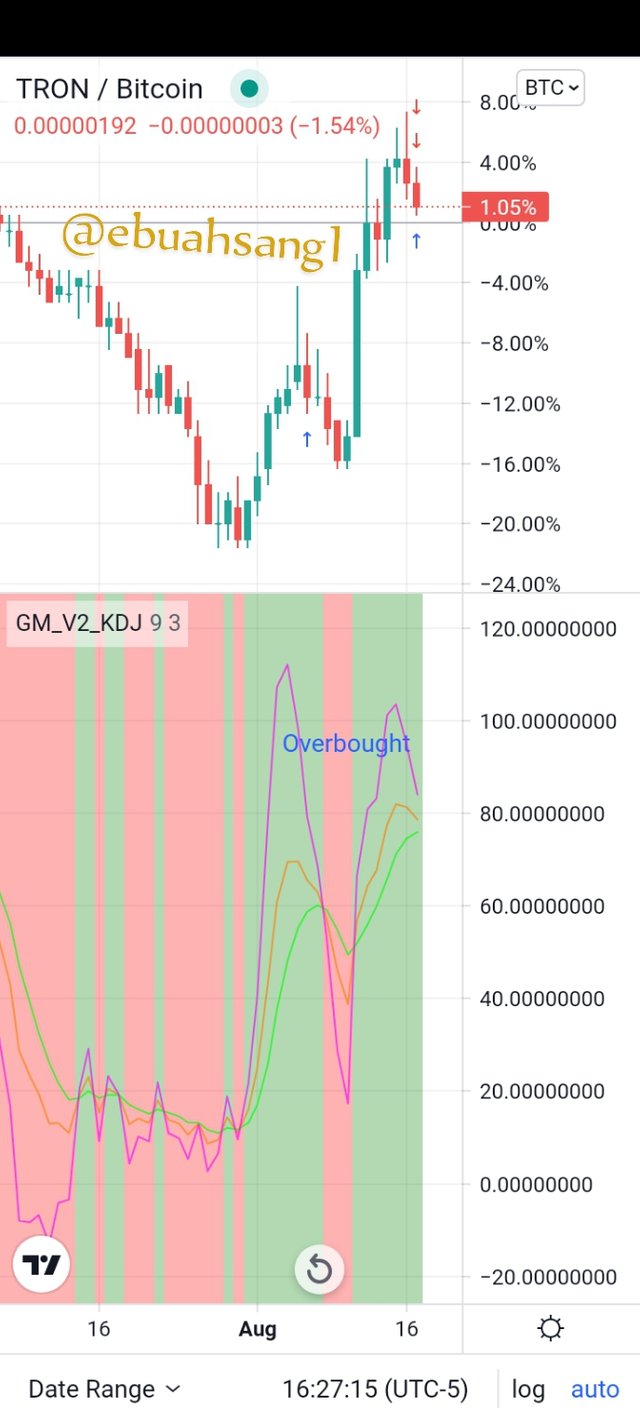
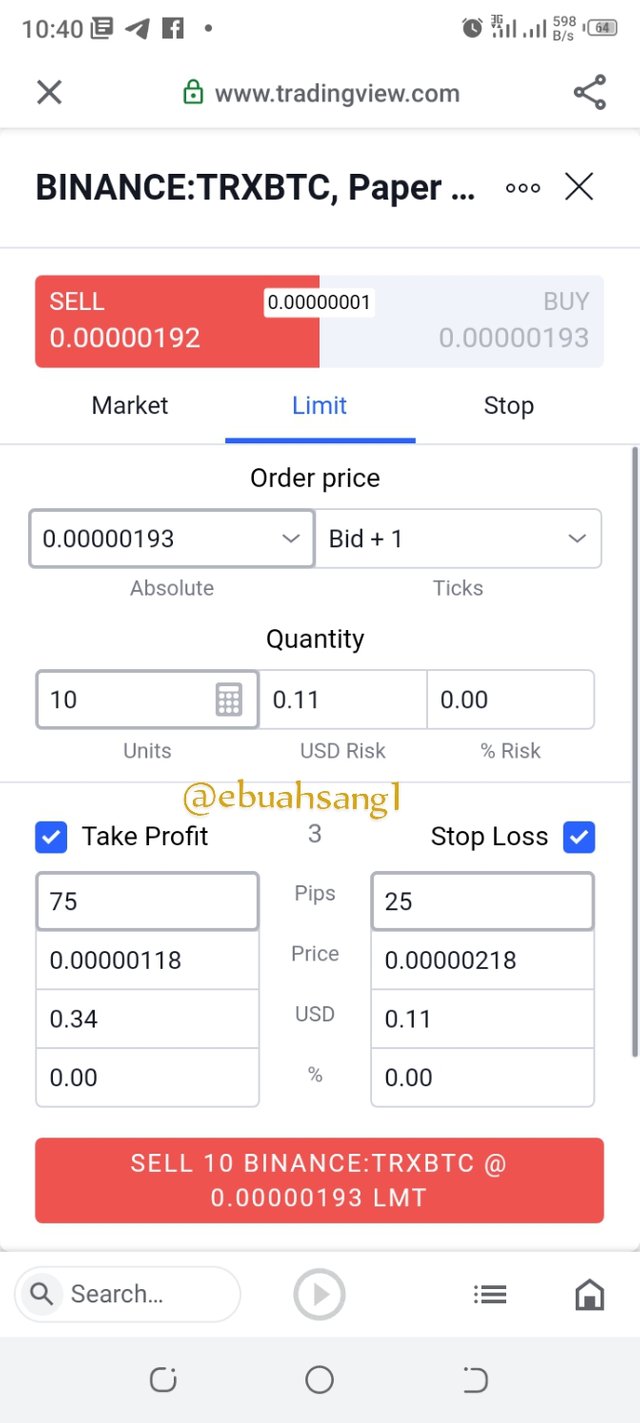
Sell Signal (TRXBTC)
A sell signal in the KDJ indicator occurs when all three lines are above the 80 level indicating that the asset has been overbought. And when the %J line is above the %K and %D lines.
As can be seen on the image below, the purple %J line is above the %K and %D line on the TRXBTC chart. This is a perfect indicator of a trend reversal and that's why I decided to enter the market at this level.
Conclusion
The KDJ indicator is a very good and accurate technical analysis tool that is being used over the world by traders. It is a very good indicator to be used over a short period of time and in a trending market as it must be noted that in a flat market, it might give faulty signals.
I want to thank the professor so his detail explanation of the topic and an interesting assignment. I had fun reading and researching.
Thank you professor
CC. Professor @asaj
Good job @ebuahsang1!
Thanks for performing the above task in the eighth week of Steemit Crypto Academy Season 3. The time and effort put into this work is appreciated. Hence, you have scored 6.5 out of 10. Here are the details:
Remarks
You have displayed a good understanding of the topic. You have completed the assigned task. However, here are my observations;
Your work could have looked better if you had uploaded photos in landscape mode. Also, take a quick look at an extract from your answer to task 2.
The above statement is unclear or not entirely true. This depends on what you meant by short term. Well, KDJ indicator is best for wider timeframes.
Thank you for the grade and corrections professor. I bas taken it under advisement.