Crypto Academy / Season 3 / Week 3 - Homework Post for @ lenonmc21 || Trends, Trend Lines and Chart Patterns by @ebuahsang1
Pinterest, Edited"Postermywall"
DEFINE IN YOUR OWN WORDS WHAT IS "TREND" AND TREND LINES AND WHAT IS THEIR ROLE IN CHARTS?
WHAT IS TREND.
Trend as defined by the oxford dictionary is a general direction in which something is developing or changing.
In the crypto world, trend can be defined as the tendency for price to move or change in a particular direction. So when we talk about trends in crypto currency, we refer to PRICE MOVEMENT. There are general 3 trend movement that's
- Uptrend. When prices are moving upward that is a bullish market.
- Downtrend. When prices are moving downward that is in a bearish market.
- Sideways. That is when prices are relatively stable within a time period.
There is a wise saying in the market that “The trend is your friend". This simply meaning if you are looking to be profitable in the market, it is very essential to follow trends and not bet against trends. And so, it is very important to be able to identify Trends in the Market and a very common way of identifying trends is in the used of TRENDLINES.
WHAT ARE TRENDLINES.
Trendline is a very essential technical analysis tool that is used by traders to identify and take advantage of price movement. A trendline is a line drawn by traders which connect a series of price points on a chart. This line usually connect series of high pivots to indicate uptrends or low pivots (lows) to indicate downtrends. Trendlines are very powerful representations of support and resistance in the market.
ROLE OF TRENDLINES IN CHARTS.
- Trendlines help traders to identify price directions in the market to make good trades.
- Trends and trendline also give traders a good data for analyzing price, identifying areas of support and resistance.
- Trendlines also help traders in identifying entry and exist positions in the market.
EXPLAIN HOW TO DRAW AN UPTREND LINE AND A DOWNTREND LINE (SHOW A SCREENSHOT OF EACH)
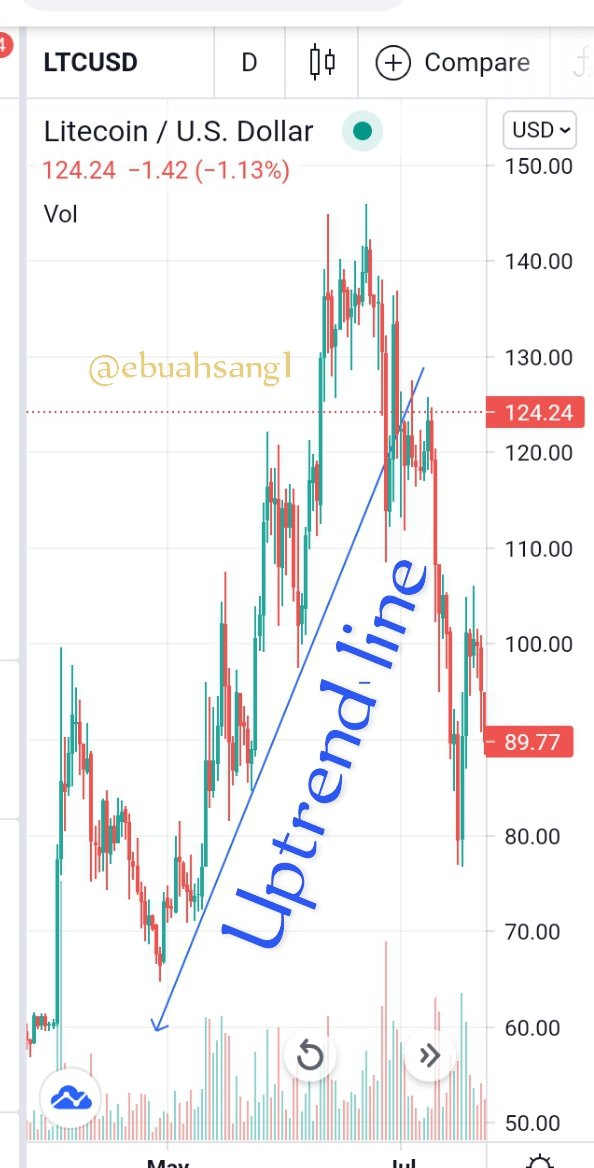
UPTREND LINE.
Uptrend lines are lines that indicate an upward movement of price on a chart. An uptrend line connects the lower points what we usually call higher lows on a chart. In an uptrend, the next low is higher than the previous low, that is why say higher lows. To draw an uptrend line in the chart, we simply connect the pivots of higher lows. First we start by identifying all the lowest points on an uptrend chart and then we indicate by putting a dot on it. Next thing is we draw a line connecting the dots on chart.
Source"
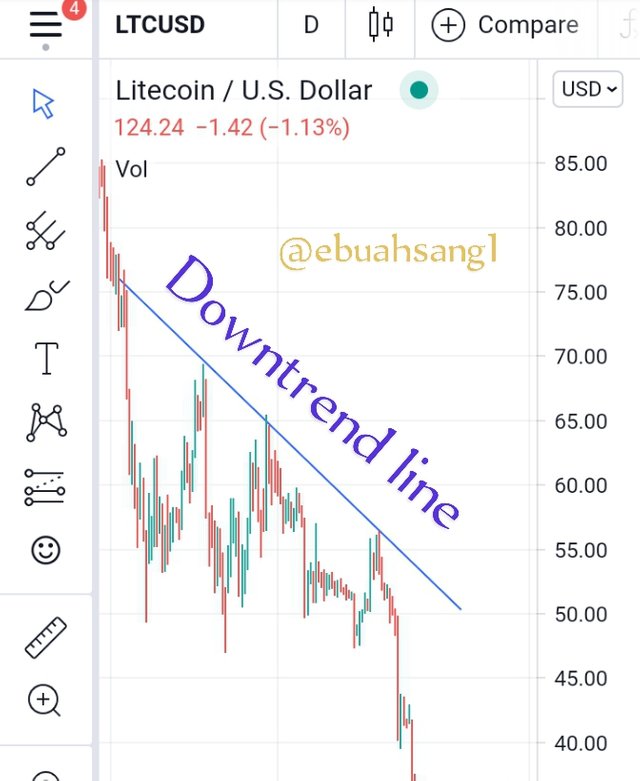
DOWNTREND LINE.
Downtrend line is a line that indicates a downward movement of price on a chart. As opposed to the uptrend line, the downtrend connects the lower highs on a chart. In a downtrend, the next high is always lower than the present high giving rise to the name, Lower highs. To draw a downtrend line, we will draw a line connecting all the high price point on the chart. First we start by identifying all the higher points on the downtrend chart and the we indicate by putting a dot on it. Next thing is we draw a line connecting the dots on chart.
Source"
DEFINE IN YOUR WORDS WHAT SUPPORT AND RESISTANCE ARE AND HOW WE IDENTIFY BOTH ZONES
The concept of Support and Resistance are very important concepts when it comes to technical analysis tools in the market.
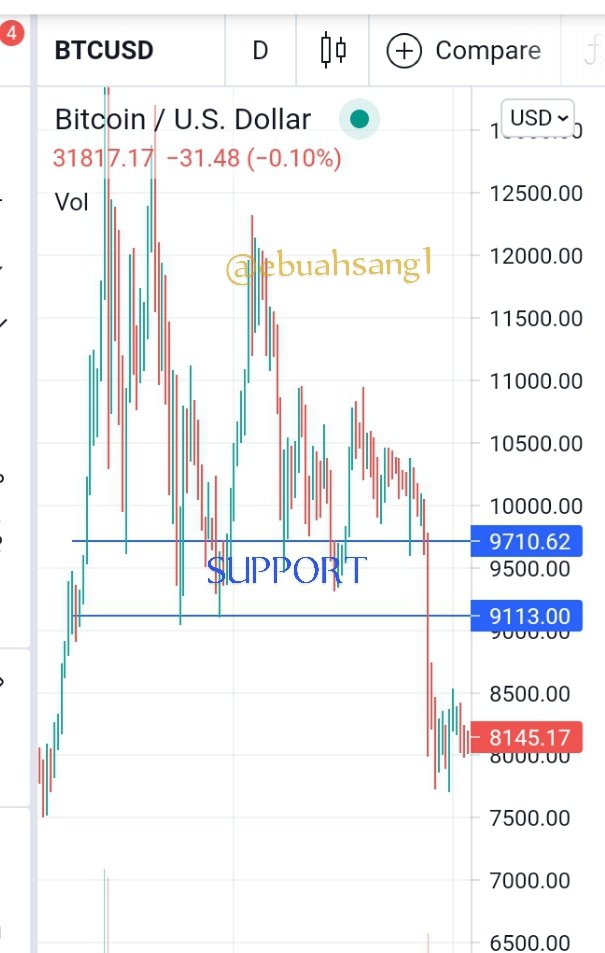
SUPPORT.
Support is an area in a downtrend where price pause or reverse. Support is a zone of struggle between sellers and buyers and it always occur during a downtrend. In a downtrend, sellers are more than buyers, and thus causing price to fall but at support area new buyers come into the market and causes price to pause or reverse.
Source"
HOW TO IDENTIFY SUPPORT.
To identify support on a chart, we have to carefully study the chart to see the areas where prices change trend. First, we identify areas in a chart where we have price reversal, a price level where reversals are frequent, that is the lowest points on a downtrend. We then Mark these points with a dots and draw a line linking the dots. Usually, support always happens at a certain price level.
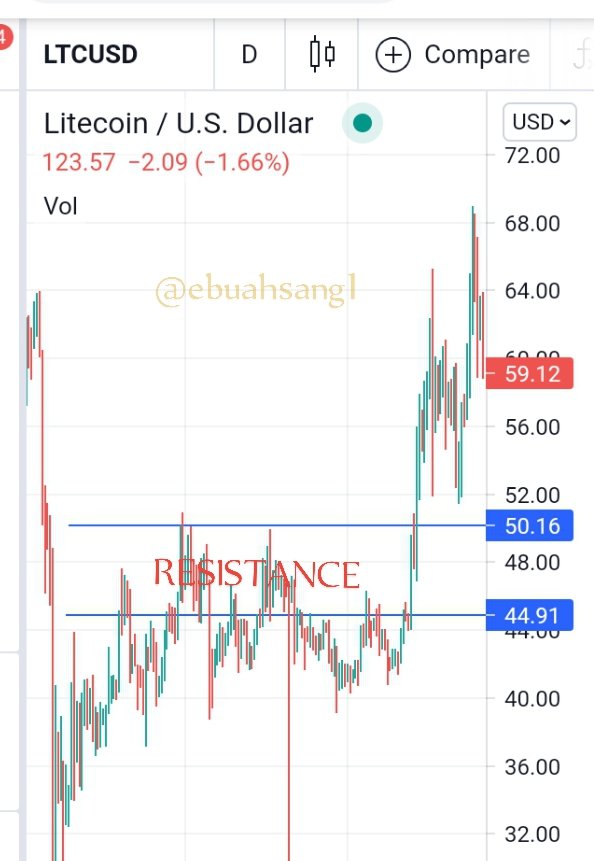
RESISTANCE.
Contrary to Support, Resistance are always found during an uptrend. Resistance is a price level/area in an uptrend where price has the potential to pause or reverse. During an uptrend demand is higher than supply, this causes price to increase, then at a certain price or zone, new sellers come in the market to beat down rising prices resulting in a price reversal.
Source"
HOW TO IDENTIFY RESISTANCE.
Resistance price level can be identified by looking for areas with higher highs on the charts. Areas indicating with a dot on every high. After identifying, we look for a price level that had frequent uptrend reversal and link the highs with a line.
EXPLAIN IN YOUR WORDS ATLEAST 2 SIMPLE CHARTS PATTERN WITH SCREENSHOT
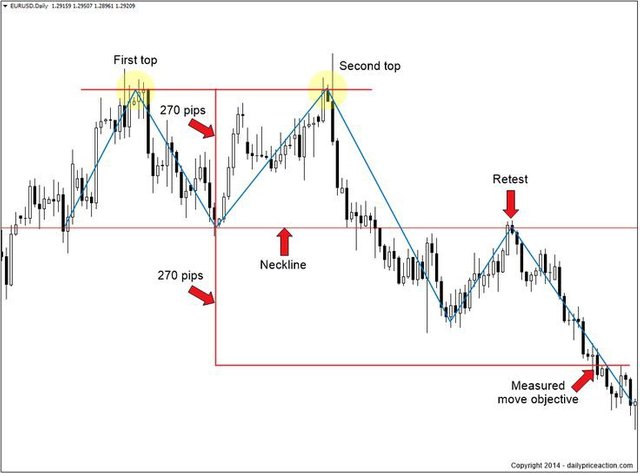
DOUBLE TOP
Another pattern that traders use to identify reversals in the market is called Double Top. In a double top reversal, prices will experience a rise to a high then retrace to a level of support and then rises once more to the high point again before retracing to a more permanently reversal. So a double top is the formation of two consecutive tops before a potential downtrend and it is an extremely bearish chartpattern.
Pinterest"
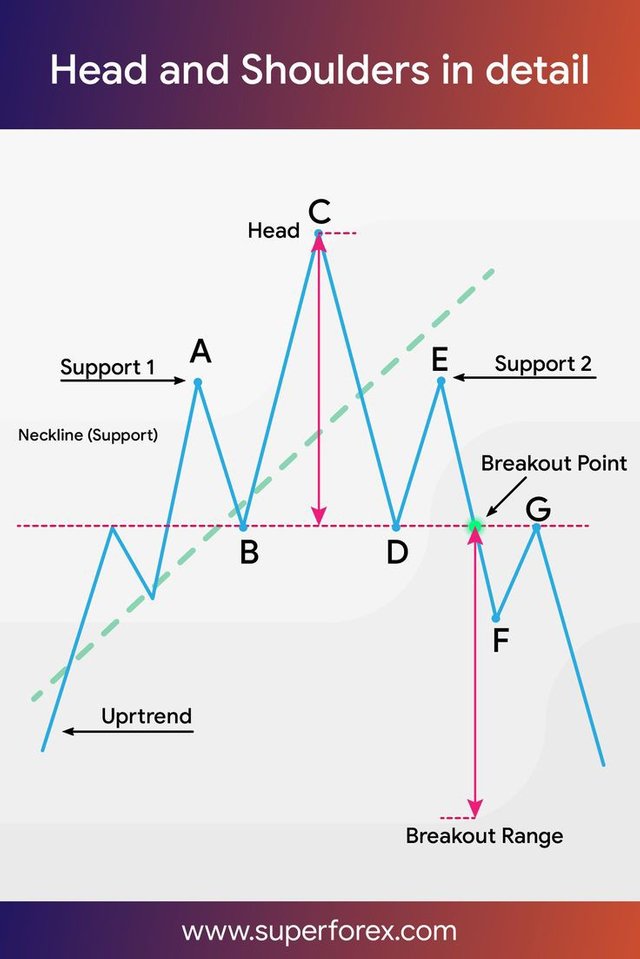
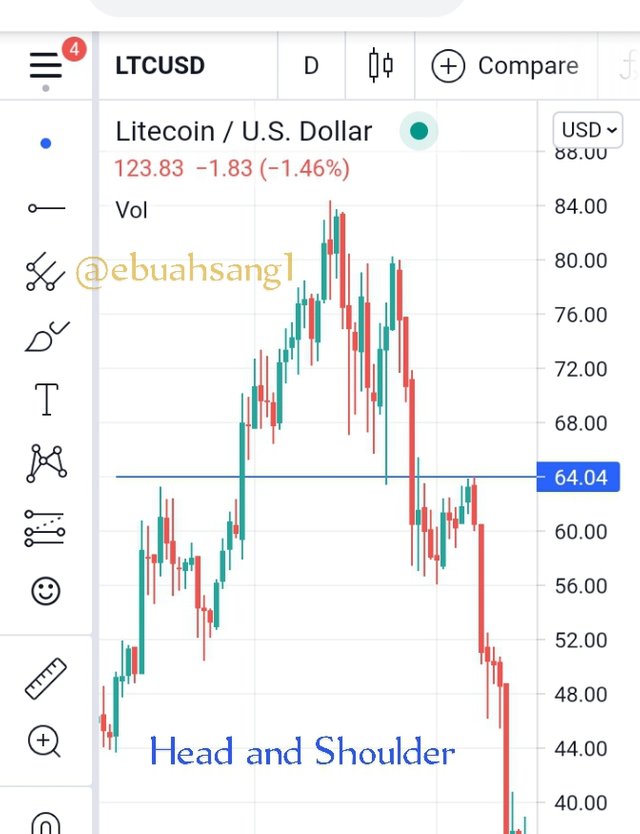
HEAD AND SHOULDER
Another chart pattern is the Head and shoulders. In a head and shoulder pattern, the first and the third highs are slightly the same height and are small than the second high which is higher. The second high in the middle is the highest high in the chart, thus the name “Heads and Shoulders”. Most traders believe the head and shoulders to be one of the most reliable trend reversal patterns.
Pinterest, Edited"Postermywall"
 )
)
CONCLUSION
In conclusion, trends are very important indicators in the trading world. it is very important to know the various trend and how to draw a trend line. It is also highly important to be able to identify areas of support and resistance in the market and take key notes in potential pattern reversal in the market. Knowledge of all of this will make one into a highly skilled trader. Thank you professor for the lessons, it was brief, precise and straight to the point.
CC: @lenonmc21