Technical Indicators - Crypto Academy / Season 4 Week 2 - Homework Post for @reminiscence01
Hello everyone, It's a new week once again and I'm glad to be participating in this week's lecture by @reminiscence01.

Technical indicators are tools of technical analysis used to analyze charts based on calculations of past occurrences on chart since patterns on chart are said to be harmonic. They are achieved by mathematical calculations based on past patterns statistics and are very useful in technical analysis.
They are considered an important technical analysis tool as they help to confirm if signals generated by other tools before entry or exit of the market. One can use technical indicators to tell if the market id overbought or oversold and move quickly, thereby maximizing profits and it is very good for short term traders as analysis with them are quicker.
We know that there are two types of analysis, fundamental and technical analysis. Technical indicators are a very important part of technical analysis and hence, an important aspect of crypto currency analysis. The issue is most people use only technical indicators and draw their conclusions based on that. Like I stated above, technical indicators are to be used in tandem with other technical analysis tools.
They are very good though like the moving averages which helps smooth out the market noise so one can see the trend. After doing this, one then uses other technical analysis tools to confirm the right decision for the market before making a move and not relying solely on it.
Adding indicators on the chart is very easy to do. We will take a step by step process, using trading view
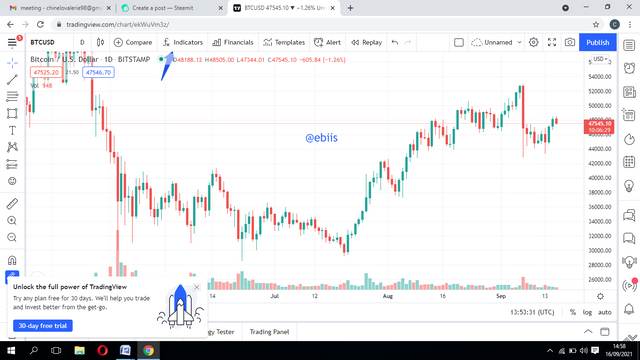
First, click on "chart" option and then, click on the symbol "fx" on the toolbar at the top of the screen as shown below
.png)
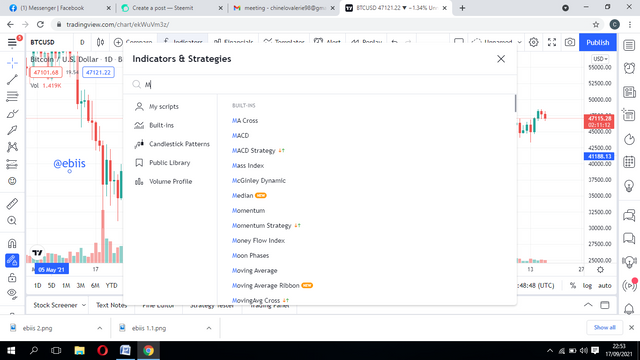
You then type out the particular indicator you want or you scroll down and search for the particular one you want, based on the category as seen below
.png)
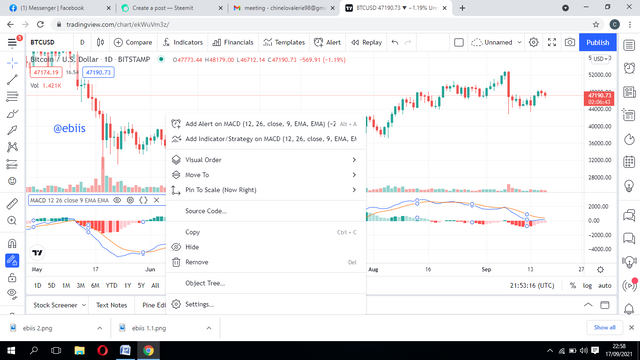
To edit it's properties, you click on the indicator and some options appear for you to choose from.
.png)
There are different categories of technical indicators. They include;
- Trend indicators: These are indicators that helps you know the direction of a trend. They include moving averages, MACD, Moving Average Convergence Divergence and the parabolic SAR, with the moving averages being the most common. There's a popular saying that the trend is your friend. With these indicators, one can and trade in the direction of the trend and also notice trend changes to get into the trade early. Note that when the market is said to be bullish, they're talking about an uptrend and bearish is the opposite.
An example of MACD on chart is shown below
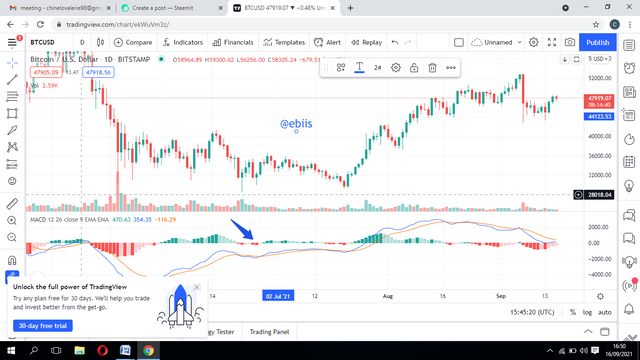.png)
- Momentum indicators: These Indicators help to know the momentum of price swings on the chart, that is the speed at which price fluctuates down and up and if the fluctuation is reduced or price swings are reduced, it indicates low momentum. Some examples includes Stochastics oscillator, RSI, Relative Strength Index.
- An example of RSI on chart is seen below
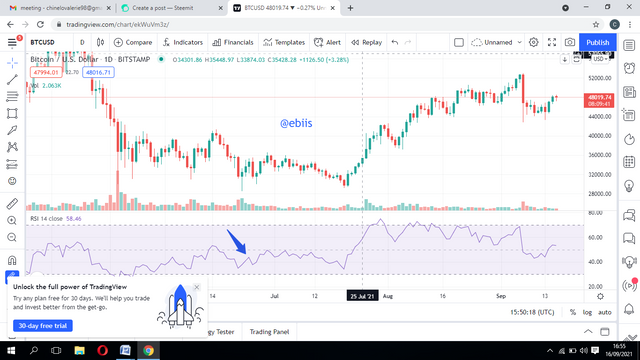.png)
- Volume indicators: When trading volume is high, the trend is said to be strong, while a lower volume indicates a weaker trend. Volume indicators are used to measure strength and weakness of a trend, in order to know how eagerly people are trading a trend. Examples includes, the On Balance Volume Indicator, OBV.
- An example of the OBV indicator on chart is seen below
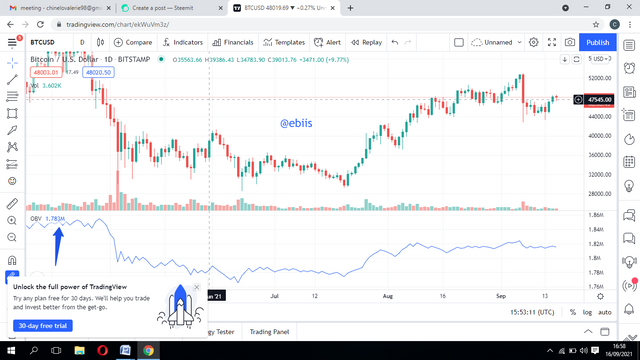.png)
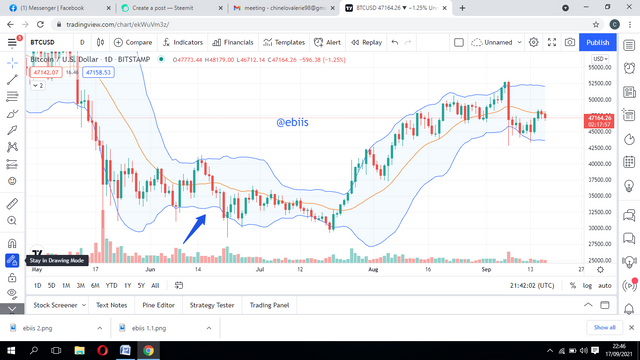
Image from source - Volatility indicators: These help in confirming how volatile the market prices are. You can tell if prices are very unstable and keep going or down or if they're fairly stable. Some examples includes, the ADX indicator and Bollinger bands. An example of Bollinger bands on chart is seen below
.png)
Image from source b. Briefly explain the reason why indicators are not advisable to be used as a stand alone tool for technical analysis. Technical indicators, though very useful, are not meant to be used as a stand alone tool for technical analysis. Many traders make this mistake and even go further to assure people that they're covered when they use a good number of technical indicators. Most of these indicators helps to predict future market prices based on certain calculations of past trends.
Technical indicators are meant to be used in conjunction with other technical analysis tools. We use them to confirm a signal gotten using other tools and to develop trading strategies.
Even though technical indicators could give traders a lot of information about the chart, it's just one of the technical analysis tools and one needs to consider a lot of other things before trading according to his trading strategy.c. Explain how an investor can increase the success rate of a technical indicator signal. A technical indicator signal success rate can be increased by having a good trading strategy. That's why people are advised not to rush into a trade just because one indicator is showing one thing. One can use other indicators to be double sure if the predictions of both tally.
It is not advisable though, to go crowding your chart with too many indicators as this could make the chart look untidy and one could get confused. Instead, one should focus on certain indicators and know how to use them very well. Then know how to use these combinations of indicators in tandem with his trading strategy.
Conclusion
Technical indicators are a fundamental tool for technical analysis and are a very useful tool for traders, especially short term ones. They can be studied and when used properly in combination with other technical analysis tools, could produce good signals and good results. It is advisable for one not to rely solely on technical indicators to make one's decisions though as most people do.