Trading with Volume Indicator| Crypto Academy / S4W2 - Homework Post for professor @kouba01
- Explain the volume indicator in your own words.
- Use a platform other than Tradingview to present the volume indicator on a chart and show how to configure its parameters by justifying your choices. (Screenshot required)
- What is the link between Volume and Trend and How to use volume to predict a trend reversal? (Screenshot required)
- How to use the volume to have a signal confirmation? (Screenshot required)
- How does the volume reflect the evolution of prices in the charts and why does the volume sometimes anticipate the price? (Screenshot required)
- Is it better to use the volume indicator alone or use it in parallel with another indicator when trading? Justify your answer
- The volume indicators are multiple, choose one of them to briefly explain its usefulness in crypto trading.
- Conclusion:
Good evening follow Steemian, I welcome you to my CryptoAcademy homework task for this week. Its on a lecture by professor @kouba01 and it's on how to use volume indicator to trade.
WHAT IS VOLUME INDICATOR?.
Volume indicator in my understanding is a key and important Indicator that can be used to check the strength of increase and reduce of price in the market, information of volume indicators are represented by vertical columns located at bottom of the graph. The more trading activities, the higher the volume indicators likewise the lower the trading activities the lower the the indicator, i.e the bar help traders indicate how market activities move at a particular time or day
Volume indicator is sometimes called real-time indicators because it can be used to know how other investor value or perform activities at a given period of time, for a given asserts or currency. They are ways to use the volume indicator, which are for
Uses of volume indicators
- For discovering strong and core area of resistance
- To easily Identifier a breakout
- To find out reversals easily and faster
- It is used to know if Buying pressure is higher or lower than the Selling pressure
So therefore i will say a volume indicator is an Indicator that is used to indicate the strength of a trend, find reversals faster and define area of support and resistance. The volume indicators can also be said to be simple to use because it have just few trade indicating options,
2 Volume indicator on a chart
Below are Steps to add and configure the Volume Indicator
Step 1
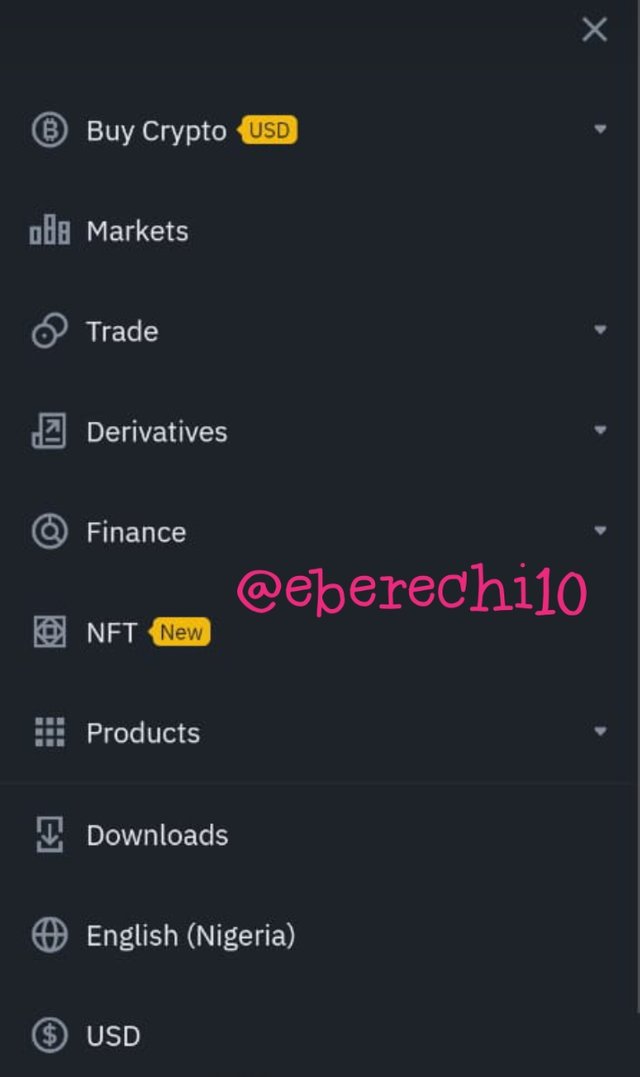
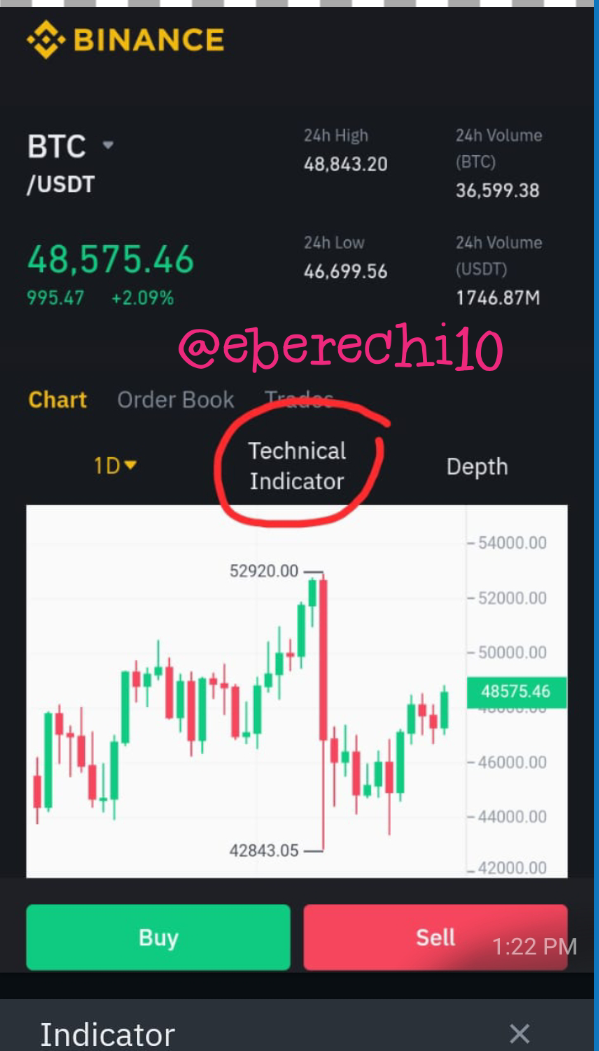
Access any trading platform, I am using "Binanace" because it's one of the most used trading platform
Step 2:
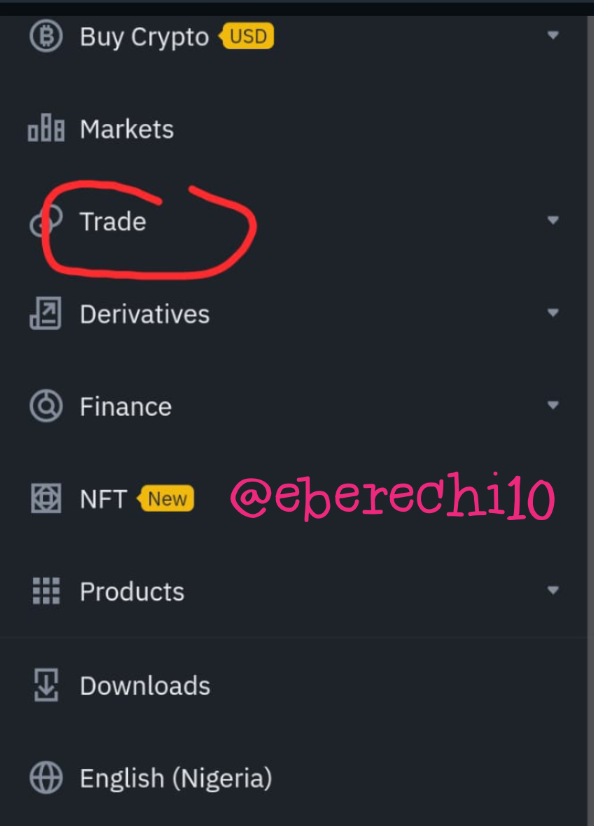
Step 3:
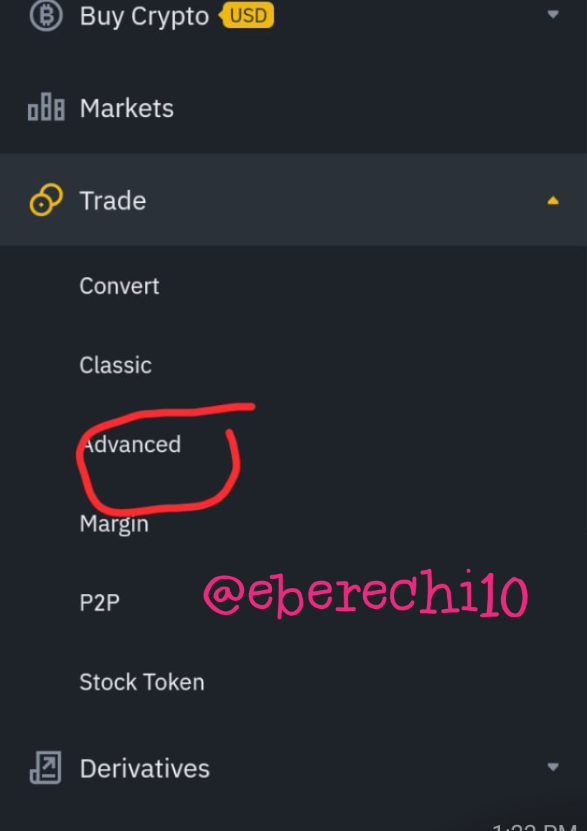
Click on the Trade Tab. And choose your desired trading options, but i am using a
"Advanced".
Step 4:
Click on technical indicators
Step 6:
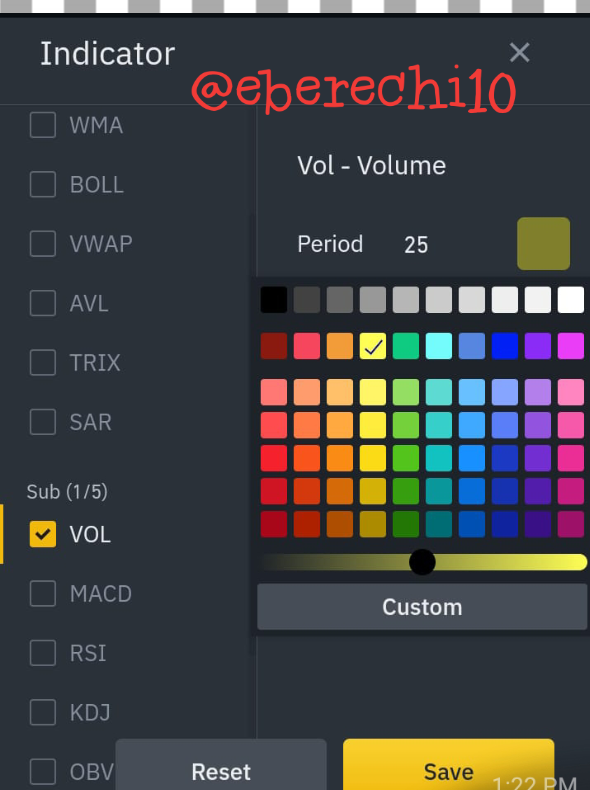
check the box at it side
Step 7:
you can make other setting like setting your desired period and your desired color
Step 8:
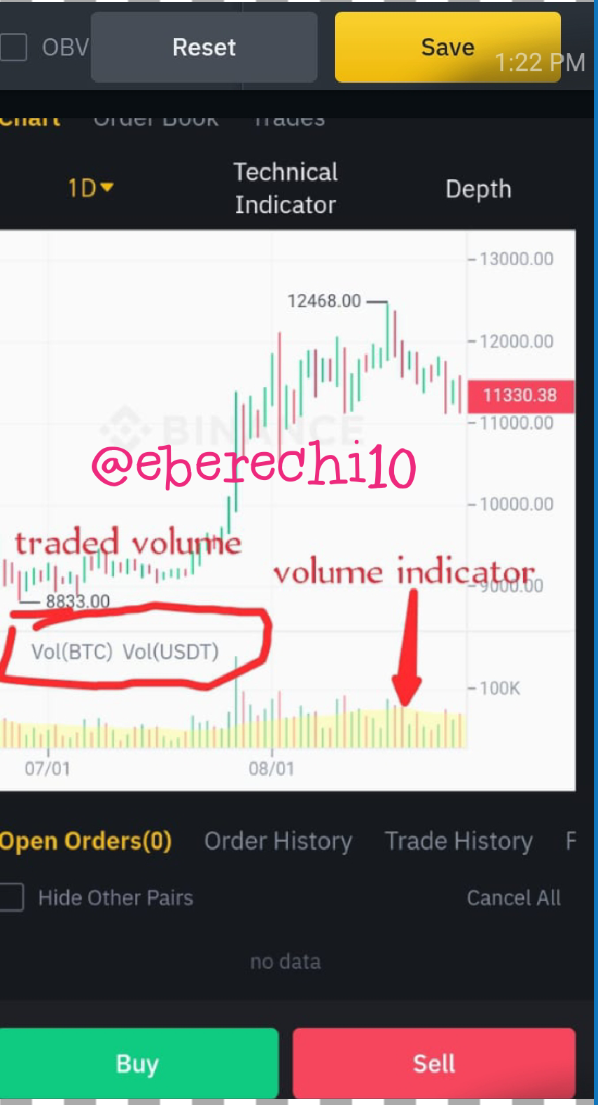
Click on save
Finally the indicator is setup.
3 THE RELATIONSHIP BETWEEN VOLUME AND TREND AND HOW TO USE THEM?
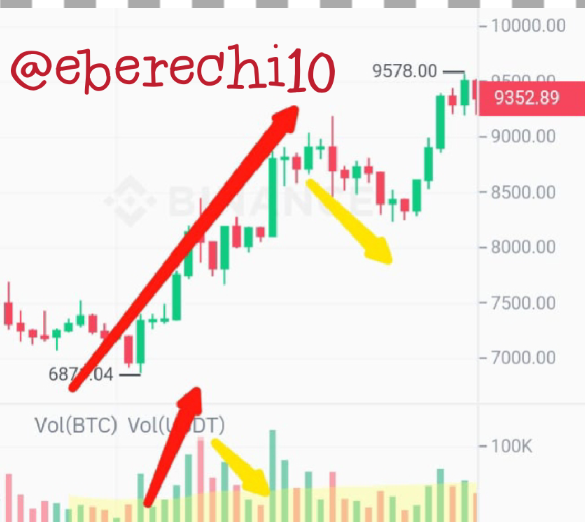
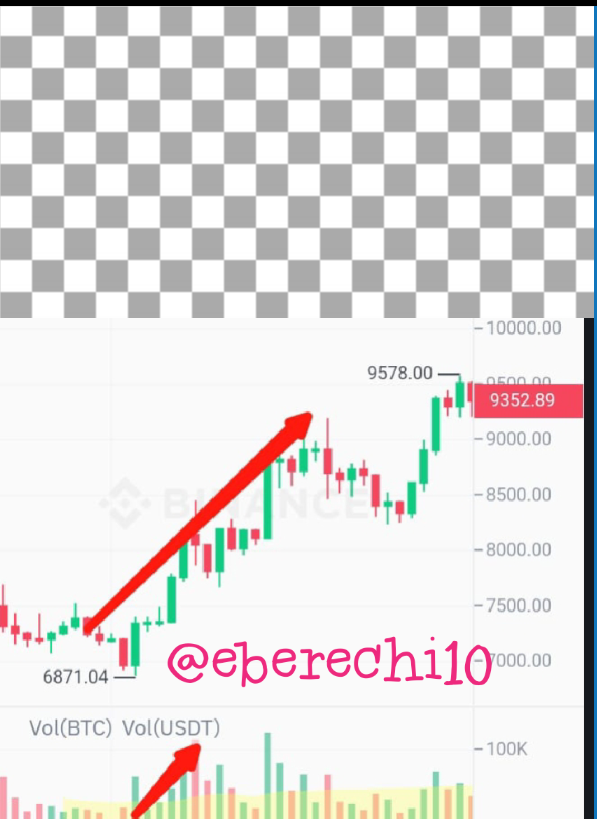
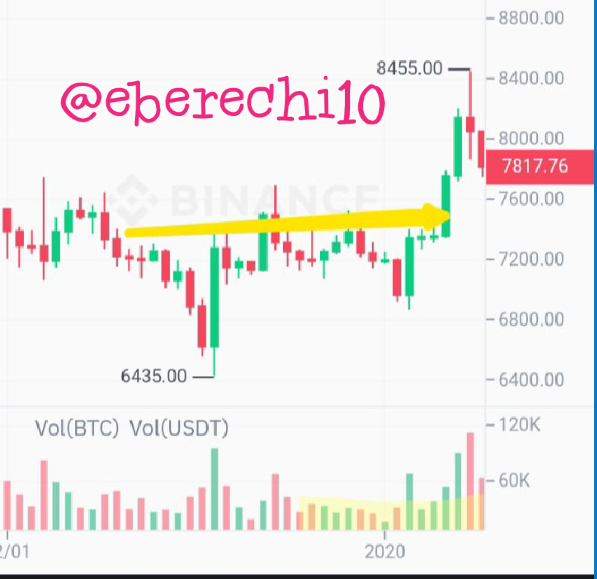
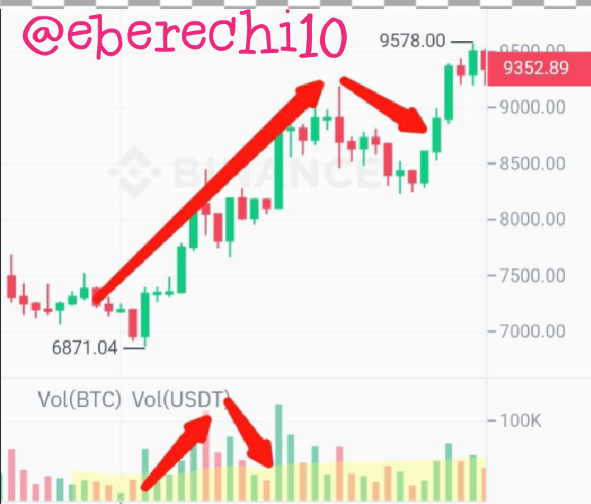
As i have said earlier the volume indicators is an Indicator that has a special attribute when it comes to calculating the strength of the trend in market, i.e calculating movement of trend is one of the major aim of developing the volume indicator. The volume indicators helps trader know strong and weakness of a particular trend at a particular time, in other to prevent lost in their trade.
Uptrend:
Uptrend is when the volume decreases and increases the price of an assert
Downtrend
This when the volume is used to calculate pressures (selling and buying pressure) in the market, volume do decreases when rebounds occurs.
4 Volume to have a signal confirmation?
Volume indicator help traders get signals from movement of assert, this signals are of different types, they are
- Strength of trend signal,
- Breakout
- False Breakout signal,
- Buy and Sell signal etc.
** Calculating strength signal of
a trend:**
If the volume stay above zero level, there is higher buying pressure, the stronger the volume the stronger the trend. When the volume indicator is below zero, then higher selling pressure
** Using Volume to Confirm Breakout signal:**
When the volume moves higher than zero, it means there is higher buying pressure and it means there is higher probability of a breakout occuring in an assert. If the volume is Lower than zero then it is said that the assert has high selling pressure which will also increase the chance of breakout.
** Confirming false Breakout signal.**
A false Breakout signal can be detected using a volume indicator. If a break is conducted above resistance and we are having negative result or a break is conducted below the support and we are have positive results, then we know it is a false Breakout signal.
Using volume indicator on buy and signal
If the volume indicator is above zero on the chart it tells traders that there's a buy signal but if it is below zero it tells it user's that there is a sell signal
5 Volume affecting price
Volume indicator is an Indicator that show the strength of buying activities and the strength of selling activities of an assert at a particular time, that is the more buyers or sellers are partaking in trading of an assert, either buying and selling, the more the volume indicator momentum increase or decrease depending on the entry either by buyers and sellers.
Volume sometimes anticipate the price?
The volume indicator anticipate the price of an assert because as i have said before the volume indicator measures the strength of buying and selling activities of an assert in the market, if the indicator indicate below zero, then the is selling pressure and if it indicates above zero then the is buying pressure. With this fact any trader knows that it's is best to buy when the is higher selling pressure, in other to make profit and the trader would know it's best to sell when the is higher buying pressure in other to make profit from the assert in the trade
6 Using volume indicator alone or using parallel with another indicator
Yes, it is good to add other indicator while you are trying to make a trade because all this indicators are set of code, which definitely will make mistakes. No indicator is 100% accurate so it is advisable to uses more than one indicator while performing trading activities, this will increase the probability of accuracy while trading and it will help reduce probability of losing in a transaction.
Volume indicator with all it's great abilities still have many limitations that is this indicator cannot perform so type of technical analysis
For example, Volume indicator alone can't give directly productive input or output signal in a market. Volume indicators can't produce pinpoint entry price and exit prices.
7 Explain one Indicator and usefulness in crypto.
one of the best volume indicator is the "Chaikin Money Flow indicator". It was discovered in the 80s by a trader known as "Marc Chaikin" . The difference between this volume indicator with other indicator is that is used to measure institutional accumulation distribution of an assert at a particular period of time. CMF Indicator is an Indicator like other volume indicators that is used to improve calculate the strength of trends in the market but it cannot stop loss points entries price and exit prices
Chaikin Money Flow
Step 1:
MFM = ((Cv– Lv) – (Hv – Cv)) / (Hv – Lv)
Cv = close value
Lv = Low value
Hv =High value
MFM = Money Flow Multiplier
Step 2 :
Money Flow Volume = Money Flow Multiplier x Volume for the Period
- CMF
CMF = 21-day Average of the Daily Money Flow / 21-day Average of the Volume
CONCLUSION
In every trading the importance of volume indicator to trades can not be overemphasize, it has helped traders to know the direction of market and then make the right decision. The volume indicator is a tool that helps investigate value of assets traded or trading any time. It is important for a trader to avoid much loss, it's advise that a trader adds more indicators to assist them take decision when trading.
Thank you @kouba01
Hello @eberechi10,
Thank you for participating in the 2nd Week Crypto Course in its 4th season and for your efforts to complete the suggested tasks, you deserve a Total|5/10 rating, according to the following scale:
My review :
Work with average content. It was possible to go deeper into the ideas presented and provide several examples. Here are some notes that I bring to you.
Your explanation of the volume indicator was brief and did not highlight its most important characteristics.
As for the second question, you did not justify your choice of settings.
You did not provide a good explanation of the indicator's relationship to the trend and its repercussions, and the same for confirming the signals.
The rest of the questions and I was somewhat satisfied with your answer.
Thanks again for your effort, and we look forward to reading your next work.
Sincerely,@kouba01
Thank you professor