On-Chain metric (part 2) Steemit crypto academy|| S3W4 Homework post for @sapwood


(1)
Market cap is a type of On-Chain metrics derived by multiplying the circulating supply of an asset with its current price within a given period of time.
It is usually the value used by investors to determine how productive or futuristic a cryptocurrency is or will be. If the market cap value of an asset is huge, such project is said to be a good one and if otherwise, it is considered of lesser value.
Furthermore, the market capitalisation of an asset is used to describe the size of an asset most especially when placed side by side with other cryptocurrencies and the market. The market cap is price x circulating supply.
The formula for this is:
Market cap = the price multiply by circulating supply
For instance, if crypto X has the circulating supply of 16,988,000 and the asset price is $13. We calculate the market cap of the said cryptocurrency in the representation below:
Market cap crypto X = 16,988,000×$13
Market cap crypto X = 22,844,000.
Market cap when placed side by side with Realised capitalisation provides the largest value of an asset based on the predominating quantity and price of an asset in circulation while realized capitalisation provides the smallest value of an asset relying on its Unspent Transaction Output (UTXO).
The Realised cap just like the the market cap is a type of On-Chain metrics used to determine the exact value of a cryptocurrency within a specified period of time by relying on its UTXO or the actual price at which it was last moved.
That being said, a realised cap can be described as the change of market cap which values the UTXO relying on the price when it was last transacted or moved. Moreso, Realised cap does not increase the effect of lost and dormant cryptocurrencies based on their actual existence in the network. In furtherance, when a cryptocurrency transacted at a cheaper rate is spent, it changes the value of that asset to its actual price at that period and still goes on to increase the Realised capitalisation.
The prevailing feature of Realised cap which considers the last price at which an asset is transacted makes it the best metric for estimating the real economic weight stored in the asset.
To calculate the Realised capitalisation of an asset, you need to follow the representation below:
Last purchase price of an unspent asset in ratio (UTXO) × Supply value.
Hence, assuming a crypto X has a unit price of $70 in Jan 2020, and a UTXO balance of 120 X, a transaction carried out in Dec 2020 spent 10 X, at $50, and the UTXO balance 70 X was sent back to the sender's wallet as change, the realized Cap of the UTXO is calculated as:
Realized Cap (UTXO) = 70 × $120
Realized Cap (UTXO) = $8,400
(2)
In this part of the question, I will still have to expand more on the concept on market capitalisation, Realised capitalisation and finally the MVRV ratio and I will also represent these concepts using the santiment chart to also a short and long term analysis on BTC.
Realised Capitalisation
As earlier stated, the Realised cap is an On-Chain metric that indicates the actual value of an asset by looking at the UTXO of that asset at a given period. The Realised cap of asset considers the actual price at which a coin is last transacted or moved.
I will be carrying out an analysis for both short term and long term realised capital of an asset with an On-Chain metric platform santiment to be precise.
Short term (3m)

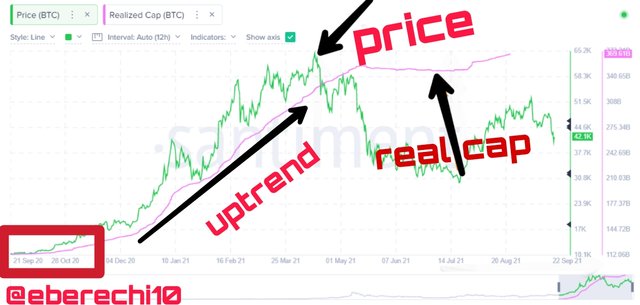
In the chart above, you can view the line indicated as the Realised cap and another as the price and scrolling the cursor sideways, you can see the price of the asset per time.
This is a 3 months chart from 22 June to 22 September. For the specified period of time, you will notice fluctuation in the price of Bitcoin from $44,053.79 - $32,505.66 and this led to a downward move of the Realised cap within the space of 3 months.
Furthermore, whenever the price is in a downward trend, realised cap is affected as it decreases but in uptrend move, the Realised cap starts creating a slope. In other words, there is usually an uptrend in realised cap when the unspent UTXO are being spent by investors as a result of increase in price. This when they utilize such opportunity to their own profit.
Also, there is usually a downtrend in real cap because no investor wants to spend their UTXO and be in loss. Investors like to holdback their UTXO.
Long term (1yr)
The long term analysis of realised cap read from September 2020 to September 2021 and from 21 Sept, you will notice a sideways trend to 11 Oct and then it took its stand to trend upwards from Dec 28 last year to 1 may 2021 as seen in the screenshots above.
Market capitalisation
As I penned before, the market capitalisation of an asset is used to describe the size of an asset most especially when placed side by side with other cryptocurrencies and the market.
Short term (3m)
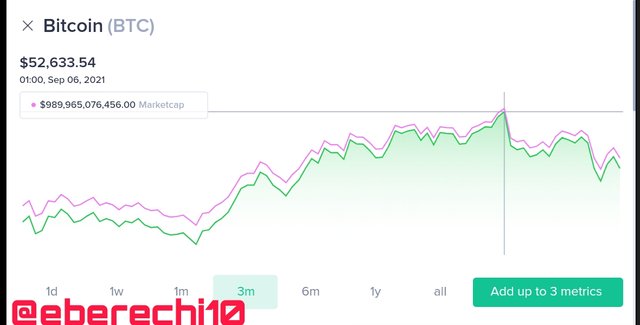
Here is the market cap analysis represented on a 3 months chart of Bitcoin. Unlike other On-Chain metric tool, the market cap is more understandable as the market cap takes the exact move as the price of the asset.
If the asset price declines, this will cause the market cap to declines and the same thing is applicable when the price is trending up.
** All time**
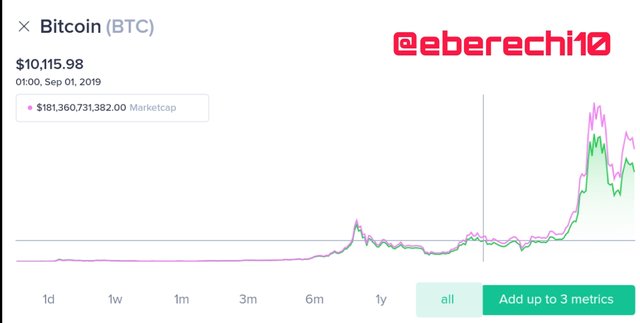
I choose to carry out the analysis using a all time chart as the one year chart on market cap chart did not represent the price chart.
MVRV Ratio
MVRV stands for market value to realised value. As the name implies, this ratio is used to compare market Capital and realised capital. The balance between the two concepts can be strike using the ratio.
This tool is used to indicate highest and lowest level in the market. We can determine the MVRV of an asset by dividing the market cap by the realised market.
I will also carry out an analysis on the long term and short term of MVRV using the On-Chain metric santiment.
Short term (3m)
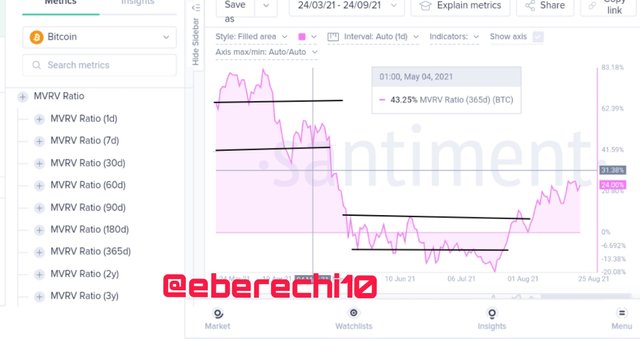
The short term analysis I carried out for MVRV is 90 days which is 3 months.
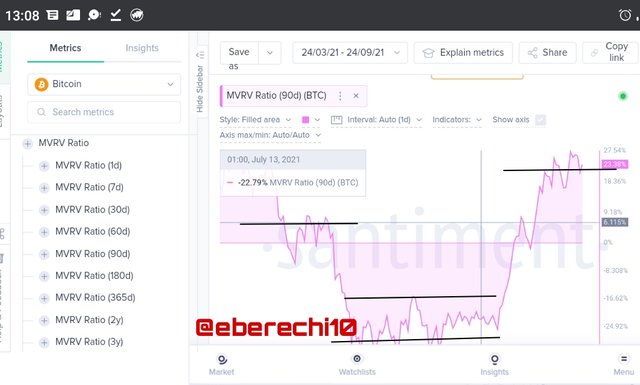
The lines drawn in between the charts are tools used in determine the highest point and lowest level of an asset by mere looking at the chart.
From the image above, you can find out that the MVRV ratio of Bitcoin took its lowest low from 30 of June to early September. Note again that downward trend was also swayed by the price of the asset too.
Long term (1yr)
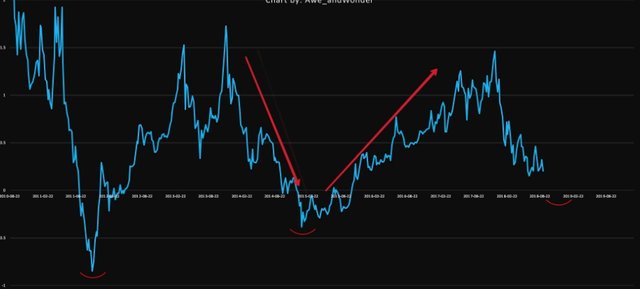
My long term analysis is represented in a 1 year chart indicated with lines which point to the highest level and the lowest level of an asset.
From the chart, each highest level of the MVRV ratio is quickly preceded by a downtrend which will quickly reverse while the lowest level of MVRV ratio is always preceded by a price upsurge.
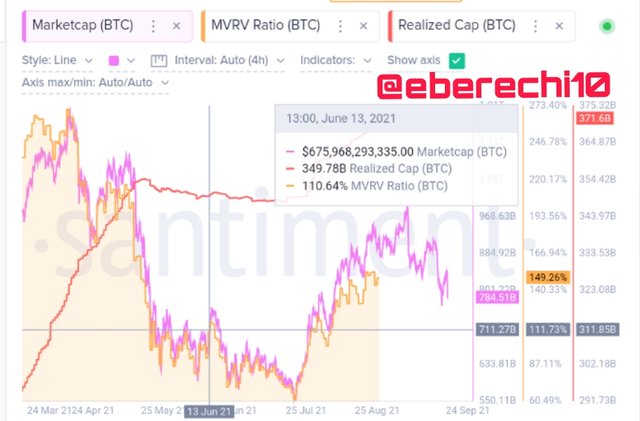
Then, lastly, we combine the On-Chain metric tools which are the market cap, realised cap and the MVRV ratio represented in a chart.
(3)
Yes MVRV is a useful tool in predicting trend and a relative one at that depending on the movement of market. As such, understanding the threshold will determine the expected price trend movement.
Using MVRV ratio to determine when the price is fair, furthermore, Determining the best time to enter a trading market is easy with this tool. In other to get huge returns.
Also, in determine whether a price is of fair value it means the asset is overvalued and may likely experience a downtrend in price.
Whenever an asset is above fair value by the MVRV ratio, an upend is on the way just as explained before.
Upper threshold: Indicates a resistance level and the market trends above the upper threshold it indicates a breakage of resistance level and this signifies that it is not a good time to enter the market for a long term trading.
The uptrending market is not a reliable tool to know the possibility of occurrence reversal.
Lower threshold: This indicates support level and conversely, when the market trends below the lower threshold, it indicates a breakage of support level meaning it is not a good time to enter the market mostly for a short term trading.
The low threshold is more reliable if the market is uptrending.
It is normal for steep to occur in realised Capitalisation when the market is trending upwards and this is because people who invested in the market at a lower rate is now selling off at a higher rate to get huge returns.
Consequently, a trader that invested when the market price is trending up, and decided to sell in downtrend market, there will be a steep downtrend in the realised cap.
Investors retain their unspent UTXO in time of downtrending in the price and this is affected by realised Capitalisation.
Note: All unsourced images are gotten from an On-Chain metric platform santiment.
Thanks and best regards
Cc.
@sapwood