Crypto Academy / Season 4 / Week 4 / Advanced : Crypto Trading with Williams % R Indicator
Questions
- Explain the Williams %R indicator by introducing how it is calculated, how it works? And what is the best setting? With justification for your choice.
- How do you interpret overbought and oversold signals with The Williams %R when trading cryptocurrencies? (screenshot required)
- What are "failure swings" and how do you define it using The Williams %R? (screenshot required)
- How to use bearish and bullish divergence with the Williams %R indicator? What are its main conclusions? (screenshot required)
- How do you spot a trend using Williams %R? How are false signals filtered? (screenshot required)
- Use the chart of any pair (eg STEEM/USDT) to present the various signals from the Williams %R indicator. (Screen capture required)
- Conclusion:
Answers
Explain the Williams %R indicator by introducing how it is calculated, how it works? And what is the best setting? With justification for your choice.
The Williams% R or William's Percent Range (% R) indicator is of the world most used indicators used by crypto traders to monitor best time to enter the exchange market and best time to exit the exchange market, without losing any assert of theirs. The Williams % R was innovated by scientist and a trader named "Larry Williams" in the year 1973. Although Larry Williams have also innovated a lot of different awesome indicators but The Williams%R is said to be one of the best of his innovations.
This indicator works as an oscillator. It helps calculate the speed at which price of a particular assert is increasing or decreasing at a particular period of time, so traders could reduce the risk or probability of experienced lose. It discoves area accumulation, which lead to trend reversals in a chart.
It's is also used to calculate the movement of bulls and bears to find the bullish sentiment to close stock price an upper or lower limit for a particular time, that is if chart's moves to the direction of zero the when bull strength is at its maximum, while if the chart moves to towards 100, then it's bear strength is moving towards the maximum. Also if the bear gains strength the the close price goes low and if the bull gains strength the close price becomes higher.
How Williams's % R indicator is been calculated
Williams%R can been calculated mathematically to maximize the success result of the indicator, by using the below formula.
Williams % R = (The past highest value of the assert at "N" period - value of the price at close daily ) / (The past highest value of an asset at "N" period- The past lowest value of the assert at "N" period) * -100.
Example, if the highest high of the past period was observed to be 60, and the daily closed price 50 , while the lowest low is 30,
Williams %R = (60- 50) / (60 - 30) * -100
W%R = 10 / 30 * -100
W%R = 0.33 * -100 = -33%
That is Williams's %R = -33%,
The assert is a experiencing failure swing
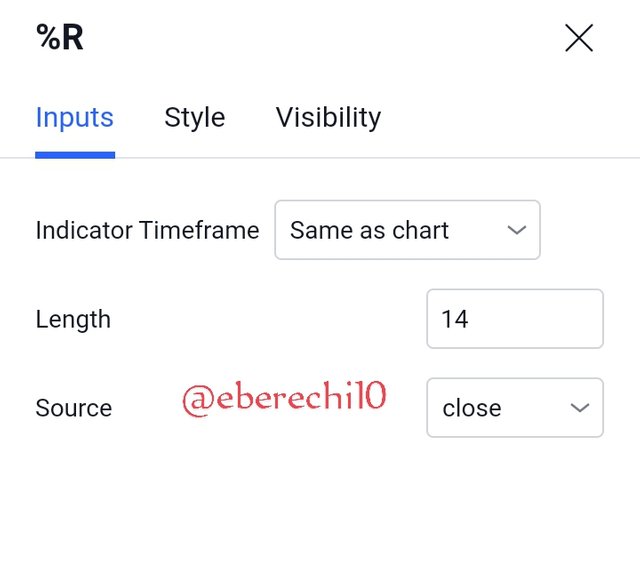
And what is the best setting?
After login in you go to chart
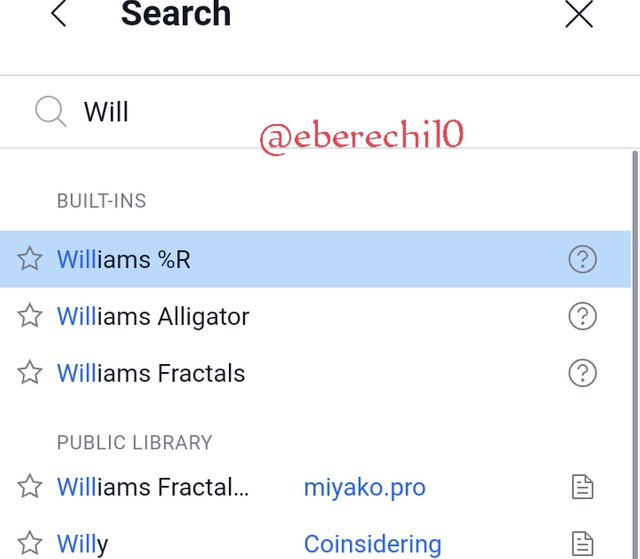
Click on indicator and search Williams % R
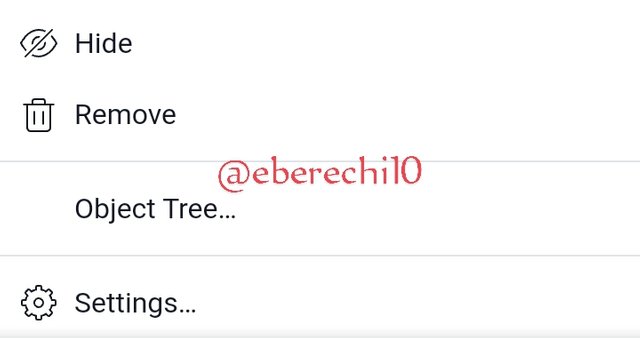
Click on the three dots and click setting

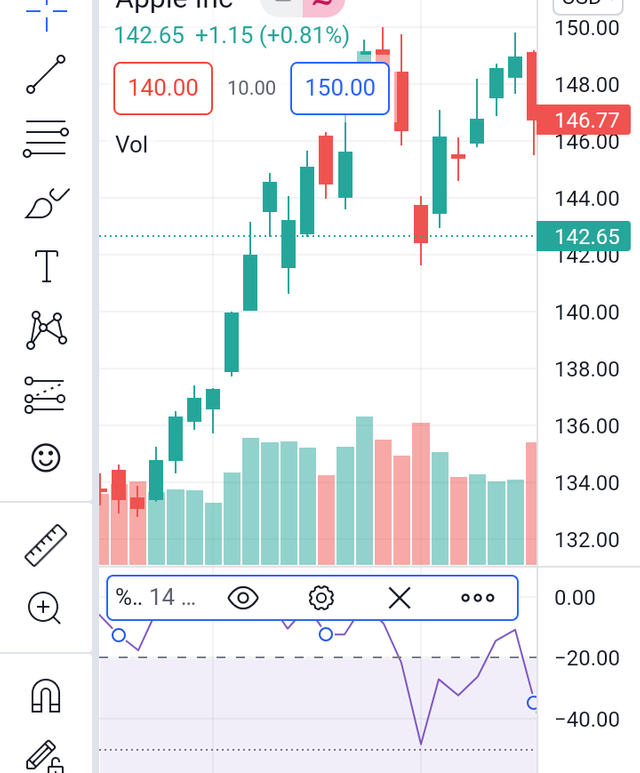
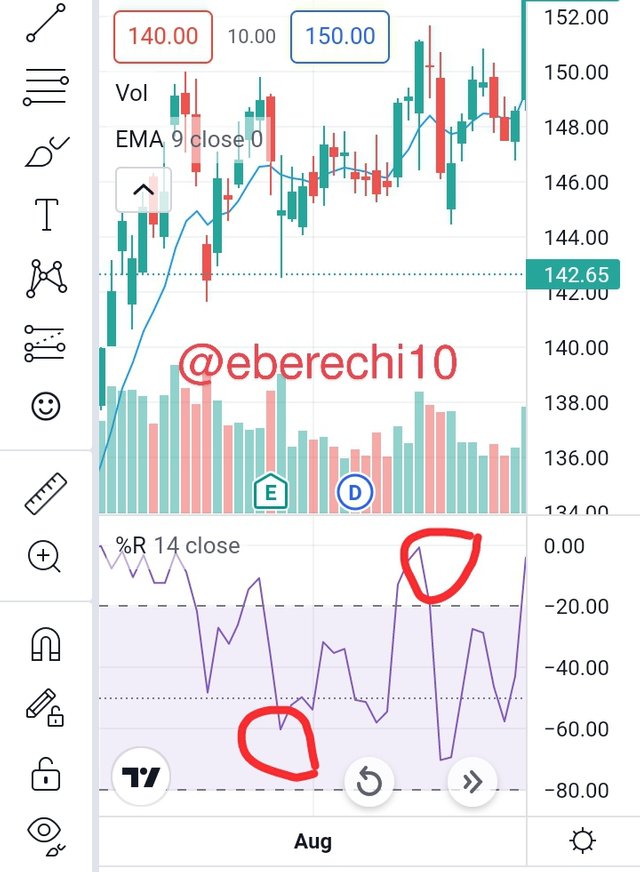
How do you interpret overbought and oversold signals with The Williams %R when trading cryptocurrencies? (screenshot required)?
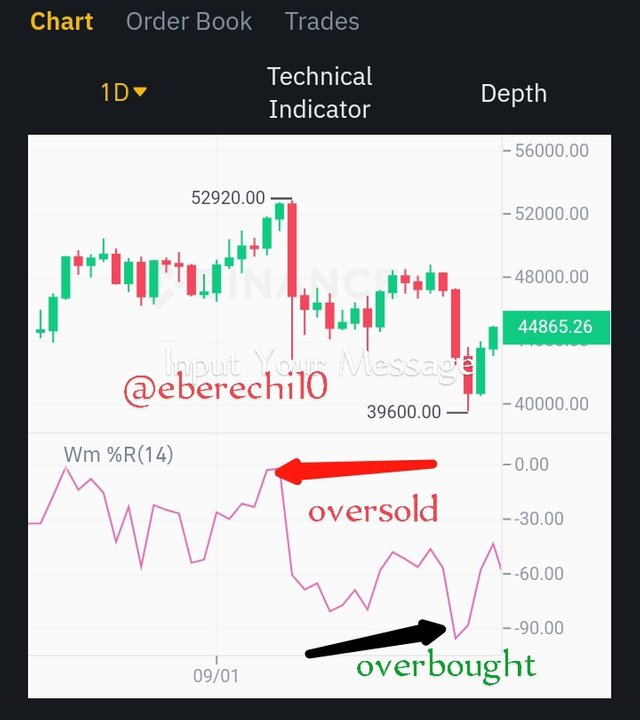
The Williams percent range is works as an oscillator due to the fact that it values ranges from 0 to -100. To find out if an assert has been oversold or whether the assert has been overbought, you have to calculate to determine it. If the Williams %R indicator is reading figures between -80 and -100, then that assert has been oversold but if the figure reads between figures between -20 and 0, then that assert has been overbought,
When an asset is overbought or if an assert has been oversold, trader are not advised to hurry while selling or buying because it might be risky, so traders are expected to wait for confirmation before making any transactions.
This help maximize profits from traders and risks of lose of asserts and profits.
Traders must wait for a
bullish signal before they buy asserts and wait for a bearish signal to sell asserts.

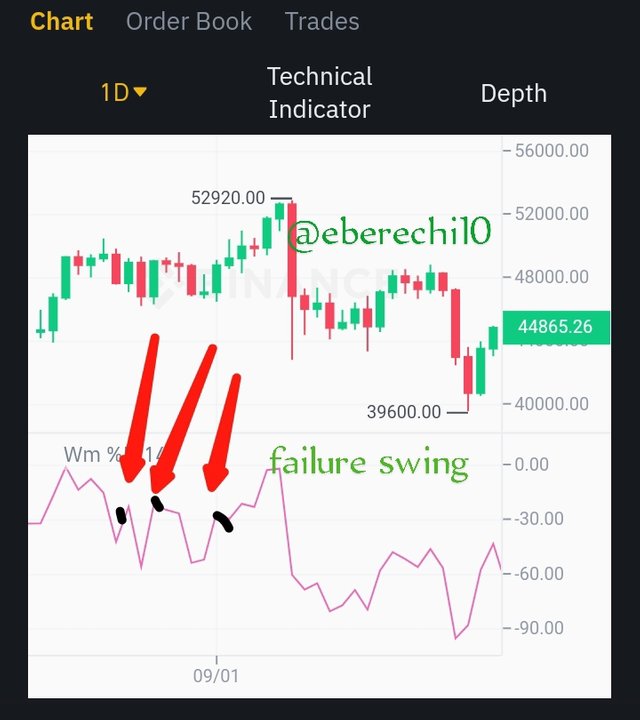
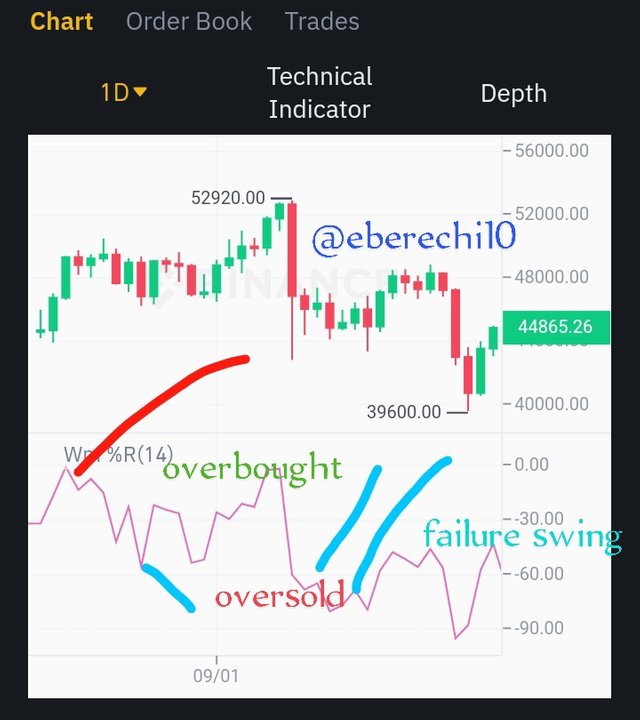
What are "failure swings" and how do you define it using The Williams %R? (screenshot required)?
The act of Swing failure in Williams % R indicator, is when the price of an assert didn't rise above the high reference line or when the asset falls below it low reference line. It happens when price of asset an exchange market, don'tnot correspond to the scale reading of an indicator. It's a type of oscillator that start from 0 and end at -100, it's right to say that the swing failure set in,if the uptrend can be more than -20 , and the downward trend cannot fall lower than -80,
How to use bearish and bullish divergence with the Williams %R indicator? What are its main conclusions? (screenshot required)
Bearish and bullish divergence are signal that helps traders analyse, calculate and predict price of an assert in the exchange market.
It's is not a regulary seen signal, but when seen it's is a good advantage for traders to maximize their profit from transactions in the exchange market
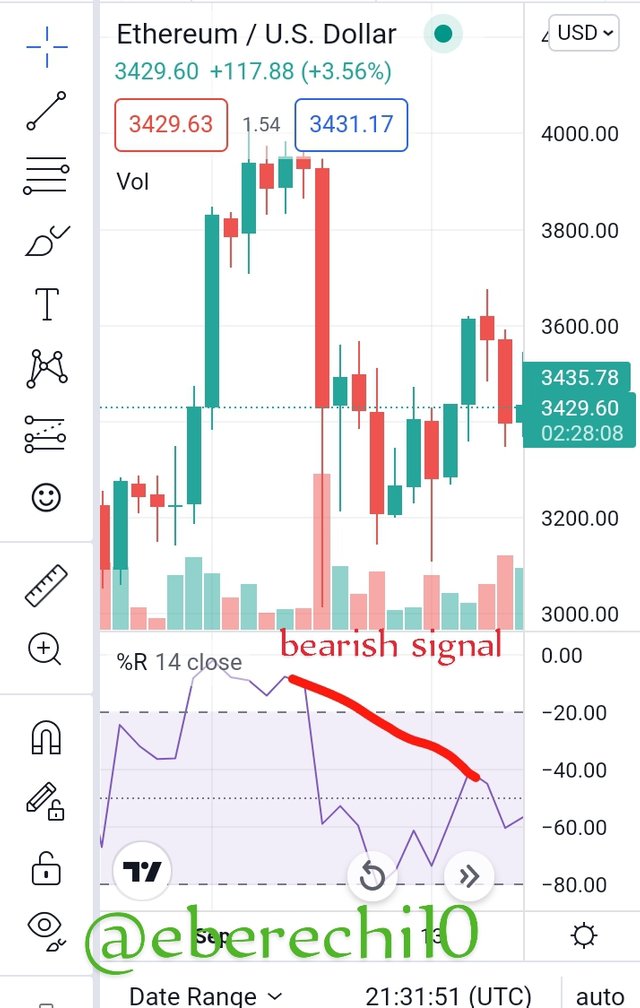
The Bearish divergence with Williams's %R :
These occurs when the price of an assert or commodity is moving rising but the Williams %R indicator is moving in an opposite direction. When this signal is seen it means it's the best time traders are expected to sell their desired commodity or assert, this is known as weakness of buyers making it a great advantage for trader to sell their goods the require.
The Bullish divergence with Williams %R
These occurs when the price of an assert or commodity is moving downwards but the Williams %R indicator is moving in an opposite direction. When this signal is seen it means it's the best time traders are expected to buy their desired commodity or assert, this is known as weakness of sellers in the exchange market making it a great advantage for trader to buy the goods the require.
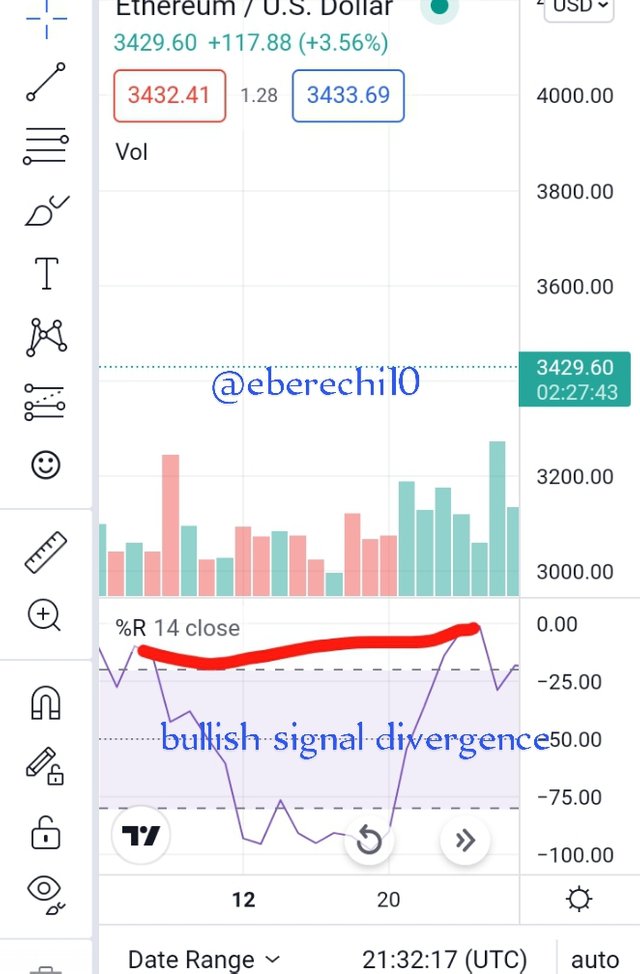
Each time there's a bearish signal and bullish siginal on chart with Williams % R indicator, the predictions are mostly accurate, and reliable , that is bearish signal and bullish signal are be very useful to traders because it also help traders get maximum profit from trades or transactions, and tell traders the best time to enter and leave any transaction in an exchange market.
How do you spot a trend using Williams %R? How are false signals filtered? (screenshot required)
The Williams % R is a type of indicator that helps traders in different aspect , but it is more beneficial when it's is added with another good indicator because no indicator is supposed to be used alone. Indicators needs other indicator to maximize it importance and reliability to traders. EMA is one of the important indicators that is can be used with Williams % R indicator to maximize results and predictions. The combination of this two indicators will reduce the reduce the false siginal in a chart
Use the chart of any pair (eg STEEM/USDT) to present the various signals from the Williams %R indicator. (Screen capture required)
The main signal that the Williams % R has two major uses
- Its help predict overbought and oversold of an asset in a transaction
- It's help find failure swing in a transaction
Conclusion
The Williams % R indicator is another awesome indicator , that has been important to traders because it helps reduce lose of asserts, and increases profit for traders in the exchange or crypto market, because it helps monitor if an asset has been oversold or overbought, in favor of the traders. I want to thank the prof for impacting unto me such awesome knowledge on Williams % R indicator.
Thank you very much prof @kouba01
Hello @eberechi10,
Thank you for participating in the 4th Week Crypto Course in its 4th season and for your efforts to complete the suggested tasks, you deserve a Total|6/10 rating, according to the following scale:
My review :
An article with an acceptable content, where all the answers were not deep in the analysis, despite the fact that they contained useful information, but the interpretation and explanation required opening several dimensions of the question according to a clear methodology.
Thanks again for your effort, and we look forward to reading your next work.
Sincerely,@kouba01
Thank you professor, promise to do better next time