[Leverage With Derivatives Trading Using 5 Min Chart]-Steemit Crypto Academy | S6W1 | Homework Post for @reddileep

Image designed by Canva
After spending a small vacation now we are here with the sixth season of the Crypto Academy, So I was waiting for the start of this season. Anyhow, I found that this season focused on trading. I'm very pleased to submit my homework post regarding "Leverage With Derivatives Trading Using 5 Min Chart". And I want to convey my regards to Professor @reddileep for preparing this valuable lesson. Let's move into the tasks without wasting time.

Introduce Leverage Trading in your own words

When we dig the history then we can find out this leverage concept is firstly found in Forex trading, so those days the trader has an option to borrow some amount of money from the broker. By this, we can assume the leverage technique came into the crypto market. We can define this leverage when we consider the trading which allows traders to enter larger positions than actually, they have. And the other hand we can define this system as one of the riskiest methods in trading, here I'll give you a simple example to clear the concept easily. Suppose someone has $100 in his wallet but by using this method he can place a $1000 trade, this is simply said as the Leverage Trading Facility.
As a trader, you can find your jackpot even the market is in an uptrend or a downtrend or and other words if you master this leverage trading method then you can take your profit in bullish and as well the bearish market. Here we can find out two options for up and downtrends such as long and short respectively. The very important thing you have to keep in your mind is your prediction or analyze correctly otherwise you'll lose your whole amount of money you have invested, that is called the process of "liquidation" so that before entering this method you should have a clear idea about the above-mentioned leverage trading. These are the major fact I have to mention under this topic.
What are the benefits of Leverage Trading?
We have already discussed that this is a very beneficial method for traders and also relative to the other basic trading methods such as spot trading, staking, yield finance, etc. This is the time to discuss briefly the benefits of leverage trading. Here I'll list out the benefits one by one.
According to our initial capital we have the chance to borrow funds for very low-interest rates so that by this method you can trade more than you have.
Here we can find out user-friendly interface so that easily visible the profit without doing any calculation, so that when your desired profit comes you can simply close the trade.
Another interesting fact is you can take portions of the profit without canceling the whole order, therefore you can maintain the entry point for further.
We can use some trading techniques to make the trade worthy and gain some profit and also find out the exit point by using those techniques such as scalp trading.
If your expectation does not work then you have some options such as cross margin to add extra funds to the trade to avoid the liquidation limit.
What are the disadvantages of Leverage Trading?
As well as the advantages it has several disadvantages although it is a profitable trading method. For the growth of a better trader, he or she must know these disadvantages also to avoid mistakes when trading.
We have already discussed that this Leverage Trading Method is very risky in crypto trading so we must think twice before confirming the order otherwise a small mistake may lead our whole investment to great disaster.
If unexpected things happen for example market crash then there will be a greater possibility to liquidate your capital when the loss equals your initial fund.
The other disadvantage is that we'll be charged some amount for our investment as per the funding fee, but we know that in spot trading there is no fee for depositing the coins.
If the trade is lost for a long period then daily some amount will deduct daily from the capital due to this reason gradually liquidation level will rise.
Basic Indicators that we can use for Leverage Trading
Here we are going to discuss that what are the basic indicators we can use to make our trade a successful one, in case of that we have to select several indicators which can give a clear idea about the market behavior or we have to select an indicator that can give a clear image about the trend before place the order. As we know that identifying the trend in this Leverage Trading is a very important factor.
There are so many indicators nowadays so that it is not a big deal to find an indicator that suits the leverage trading, here we'll discuss several indicators in detail such as,
- Parabolic SAR
- Exponential Moving Average (EMA)
- RSI indicator
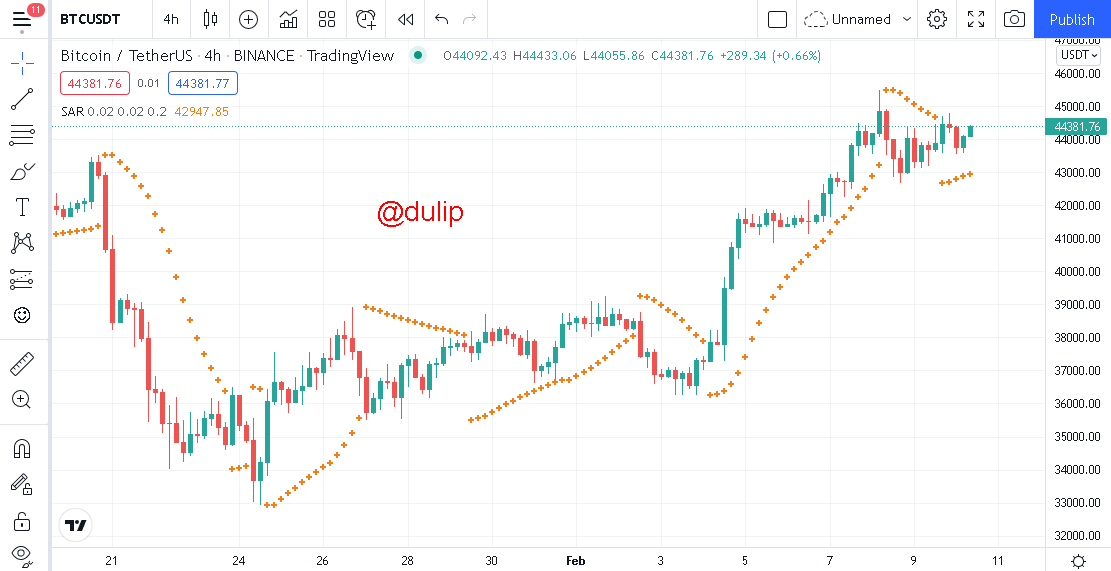
Parabolic SAR

The Parabolic SAR is an indicator that was developed by J. Welles is based on trend so we can say that the main purpose of this indicator is to reveal the trend of the market direction whether it is in an uptrend or a downtrend. This Parabolic SAR has a very nice graphical representation by using dots showing a prediction to the trader as an example, if the dots appear above the graph that means the current market is in a downtrend so as vice-versa we can find out the uptrend also. The bellow chart shows all the default settings but as per your choice, you can change the colour and thickness.
Exponential Moving Average (EMA)
The exponential moving average or simply called EMA is also one of the basic indicators that we can use for Leverage Trading to identify the trend. The basic purpose of developing this indicator is to correct the lag in simple moving average when dealing with greater loads of data. When we compare with the simple moving average indicator this EMA has a quick response or fast reaction with the identification in market trend. Now we'll have to look at the behavior of the EMA. When the market price is beneath the EMA then it indicates a bearish trend and the opportunity of selling. Vise-versa when the price is trading above the EMA price it indicates a bullish trend. Here we use 200 periods of EMA, the reason behind this is we'll put into the account price data in the last 200 days if we select the day candles chart.

Relative Strength Index (RSI)
Now we'll have a look at another indicator we can use for leverage trading, the Relative Strength Index, or simply named as RSI based on the volatility so this determines it by the overbought and oversold zones. When the RSI is entered above 70 thresholds then it shows the end of the following trend and can expect the price will reverse at this point. The Vice-versa trend will reverse when RSI will reach the oversold region, which means 30 thresholds. When this RSI information connects with Parabolic SAR and the EMA trader can place the order with greater confidence.

Leverage Trading using special trading strategies
As the next task, we have to discuss the special trading strategies that we can use for leverage trading. So that we have to follow a few steps. Therefore we have to switch our chart in trading view to Heikin Ashi Chart for better filtration of the market trends. The other basic parameter is our time frame it should be in 5 min.
Buying and Selling Strategy
Here we have to study several conditions before entering a buying strategy, so as the first condition market price should be above the EMA therefore we can take our first hint from that now the market is following an uptrend. As the second condition, we have to look at the Parabolic SAR indicator. If the dots are below the market price level then our second hint is also correct to enter a buy position. Finally, we can confirm our two hints from the RSI Indicator, here RSI has a role as a confirmation tool. If RSI is below the mid-range then we can confirm but for further understanding, you can observe a while, because these three indicators must say the same result otherwise your trading is not secure, which means has a chance to divert from the expected trend.
In the above paragraph, I explained the conditions and the steps you have to follow in buy position likewise the phenomena will be reversed in a sell position so here I'm not going to explain it further again. The only thing you have to keep in mind follow the Heikin Ashi Chart and shift to the 5 min chart and then follow the above-mentioned three indicators.


By comparing the above two different situations you can get a clear idea about the buy and sell positions and also the behavior of the three indicators as well.
Time for a real Leverage Trading
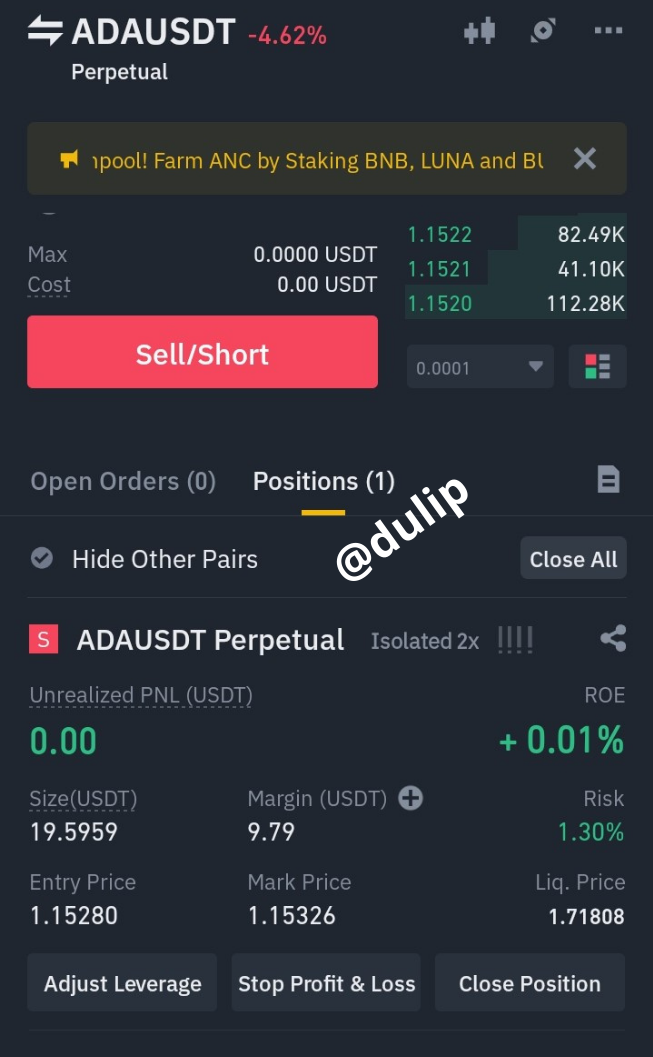
This is the last task of this lesson so to perform this I Selected ADA/USDT pair. All the analyses were carried out through the Trading View and as per the exchange, I select Binance Exchange to execute this trade.
First I select the ADA/USDT pair chart from the Trading view and then as per the lesson I shift the chart into Heikin Ashi Chart and also for 5 min. After that, I insert our basic three indicators as we discussed earlier. Now I'll clear further by using the following image. As the below screenshots, I took a little profit by performing this leverage trading method.
.png)
Here you can clearly identify my entry point as well as my target point. I executed the trade 2x isolated margin in Binance but here I faced one problem I closed the trade before it reach its target position, the reason was EMA was below the market price level so I thought that it will reverse the pattern.

Conclusion
Leverage Trading is one of the riskiest methods of trading in Cryptocurrencies although the trader can take profits if he follows the proper methods in trading such as analyzers and indicators. This lesson very clearly expresses how to execute a leverage trade step by step as well as explains the dark side of leverage trading. If a trader can use correctly that Parabolic SAR, EMA, and RSI indicators he or she can definitely take some profit through this leverage trading.
Finally, I want to convey my heartiest thanks to Professor @reddileep for preparing this valuable lesson.