Trading with Volume Indicator - Crypto Academy / S4W2 - Homework Post for [Kouba01]

Explain the volume indicator in your own words.
Volume indicator is a potential technical tool in the hands of traders that help them in making valid trading decisions. Actually there are many indicators that make use of volume of assets to provide signals. For now , we will not focus on indicators based on volume but on volume itself.
Volume indicator represents the quantity of assets traded over a particular period of time. It is represented as vertical bars of fixed width but variable length at the bottom of charts to be analysed. Usually two different colors ( green and red) are used for volume bars. As mentioned above volume bars represent the quantity of assets traded over a particular period of time therefore bigger volume bars indicate a good quantity of asset traded over the said time period and reflects that traders are interested in trading the particular asset. Similarly shorter volume bars indicate the volume of the traded asset and reflect the decrease in interest of the traders in that particular trend.
Use a platform other than Tradingview to present the volume indicator on a chart and show how to configure its parameters by justifying your choices. (Screenshot required)
For this task, I will be using my Binance account to show volume indicator and its Comfograrion.
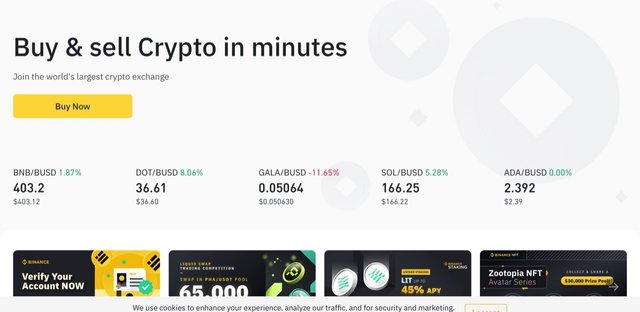
- Go to binance official website https://www.binance.com and log in to your account.
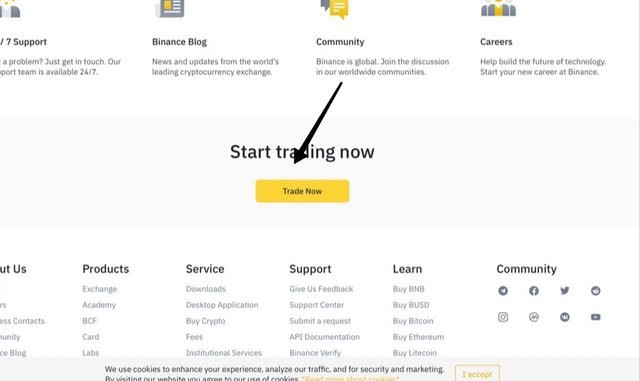
- From the main page of website,
scroll down and click on Trade now. You will be taken to trading page with default trading pair of BTC /USDT . We can change it by clicking on trading pair.
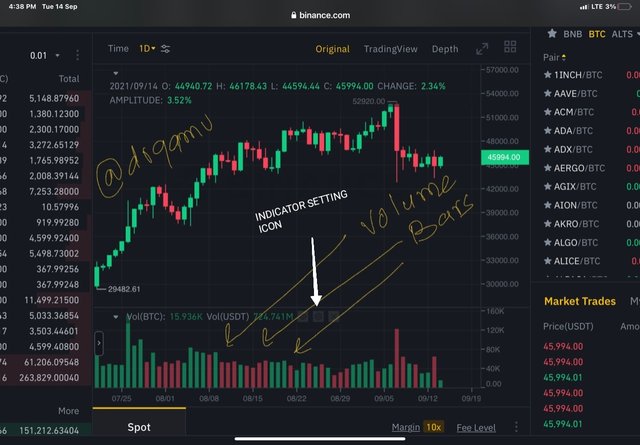
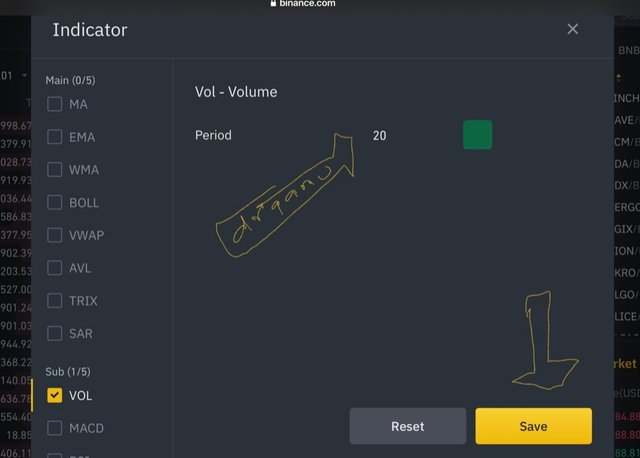
- Next we click on indicator icon as shown below. A list of indicators will open from where we select volume . Click on save .
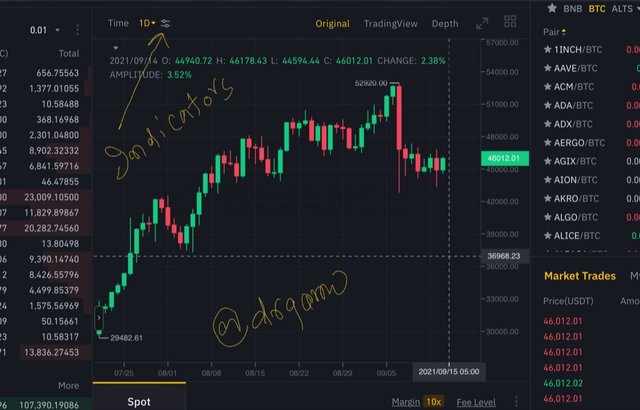
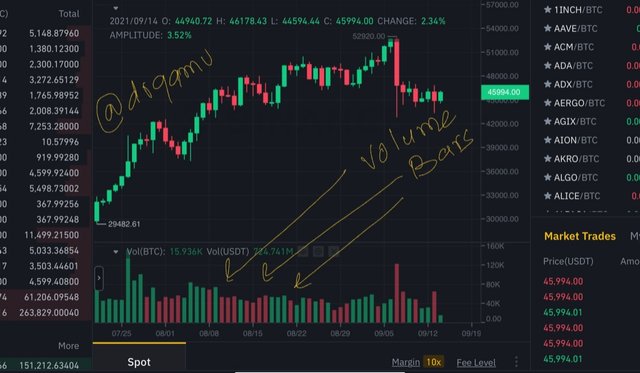
- Volume Bars will be shown below the main chart.
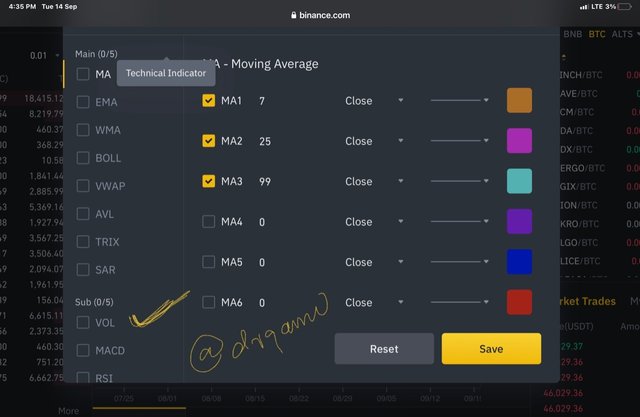
- To configure the settings of indicator, click on settings icon as shown below. Settings will load. For volume, we can add moving average to volume bars in addition to color of bars.
What is the link between Volume and Trend and How to use volume to predict a trend reversal? (Screenshot required)
Market trends can be either upwards, downwards or sideways. Uptrend or bullish trend indicates the rising price of asset because traders or investors are interested in market. Downtrend or bearish trend indicates decreasing price of asset because of decreasing interest. In sideways or choppy market, price is fluctuating between two more or less definite values.
As a general rule, for every buyer there must be a seller. Nature of buyer or seller may be different. Whether an individual or a financial institute is buying or selling, there must be second party to take the trade of opposite nature. So volume has to increase during both uptrend and downtrend. Downtrend must not be confused with decreasing volume. Therefore, volume bars will peak during both uptrend and downtrend. For the sake of simplicity, I'll explain it as :
Price is increasing and volume is increasing. It means that there is good buying pressure or trader interest in particular asset. It is seen during uptrend.
Price is decreasing and volume is increasing, it means that there is a good selling pressire in the market. it is seen during downtrend.
Price is increasing but volume is not increasing - Early sign of reversal.
Price is increasing but volume is decreasing - indicates that there is decreasing buying pressure or traders are not interested in buying.
Price is decreasing and volume is also decreasing - indicates that traders are not interested to sell the assets or selling pressure is low despite failing price.
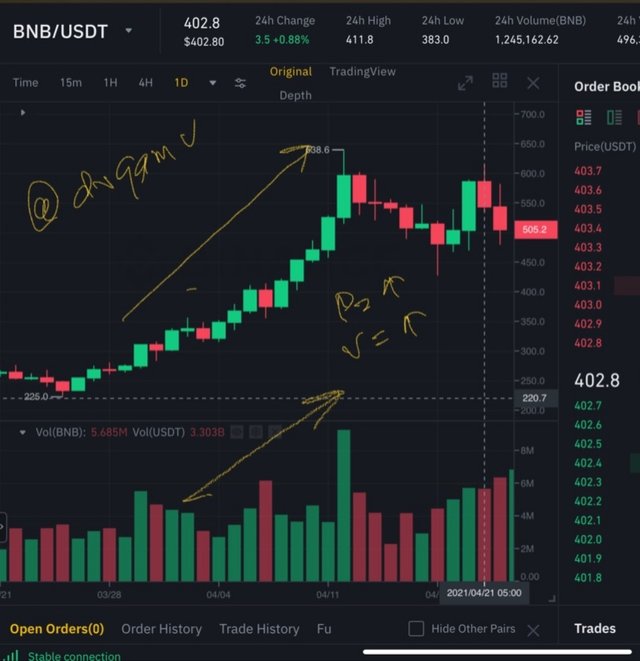
BNB/USDT chart showing increase in volume with increase in price suggesting strong uptrend
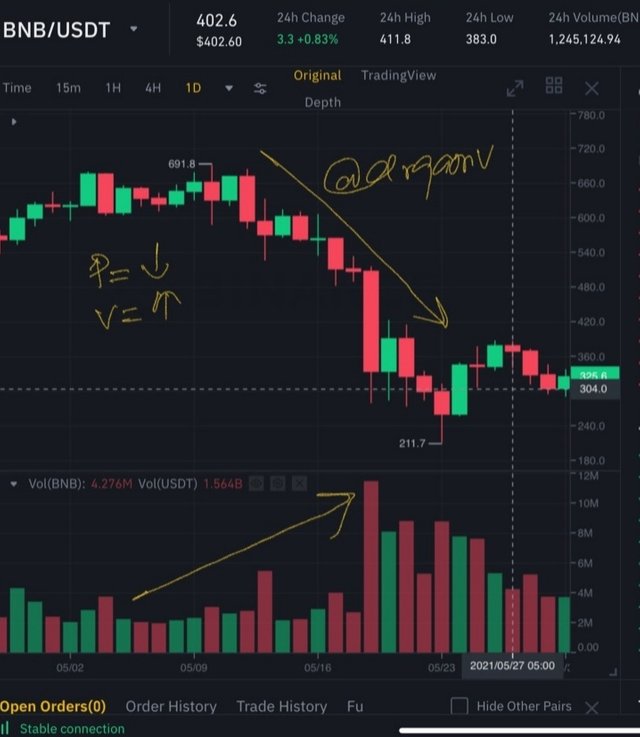
BNB/USDT chart showing decrease in pricee with increase in volume suggesting a strong down trend
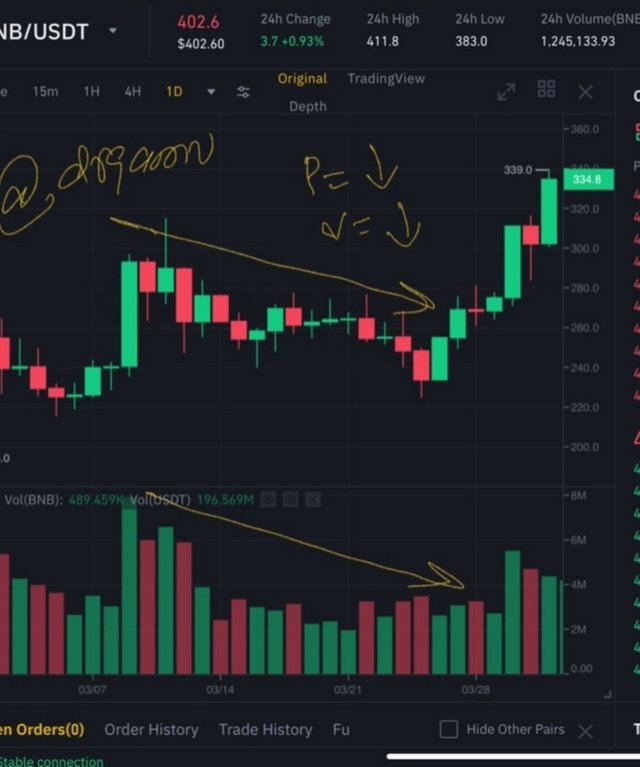
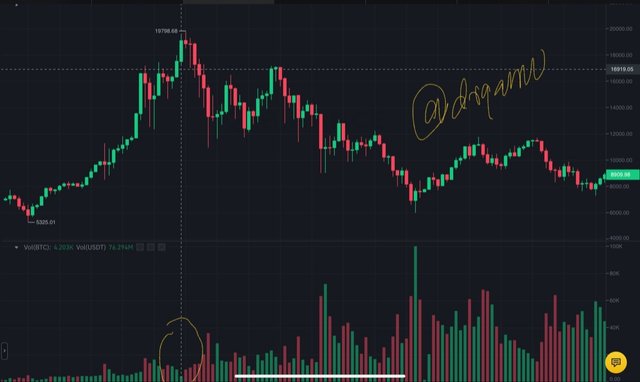
BNB/USDT chart showing decrease in price as well as decrease in volume suggesting decreasing interest of people in selling and forthcoming reversal
How to use the volume to have a signal confirmation? (Screenshot required)
Volume can be used for signal confirmation in two ways. First is to confirm the strength of trend and second is to validate breakouts.
As mentioned above, with increase in price, volume should increase to validate the strength of bullish trend and similarly volume should increase for decrease in Price of asset to confirm the srrength of downtrend. If volume does not abide these general commandments , it would suggest that momentum is weak and price rally may be followed by sideways or reversal pattern. So in such cases, volume will help traders in deciding whether to stay in trade for gaining more profit or exit to avoid loss.
Secondly, volume helps to validate the breakouts. If price breaks reaistance level with a good volume, it means a valid breakout and is a signal for breakout traders to enter into buy trade and benefit from subsequent price rally. Similarly, when price breaks resistance with good volume, it suggests valid breakout and indicates that price would fall further. It is a signal to short the market or exit the buy trade.
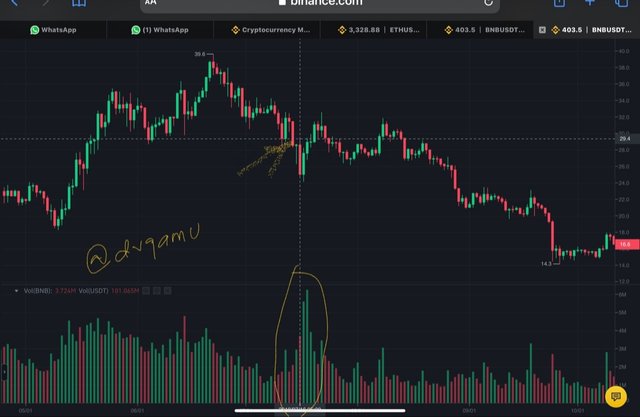
BNB/USDT chart showing support break with good volume and we can see huge price drop thereafter
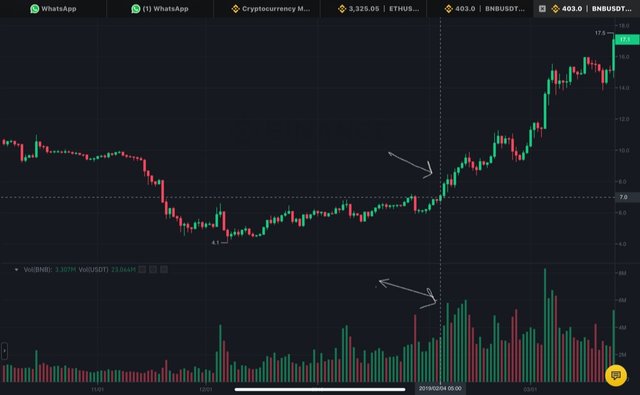
BNB/USDT chart showing resistance breakout with good volume with a huge uptrending rally thereafter
ETH/USDT chart showing breakout of resistance with low volumes which soon returned back into zone and turned out to be a fakeout. Hence volume is a good supplementsry tool to validate or refute the signal
How does the volume reflect the evolution of prices in the charts and why does the volume sometimes anticipate the price? (Screenshot required)
Volume of an asset reflects the number of traders involved in trading. If volume is more, it means traders are easily able to get their trades executed. Suppose during an uptrend, increase in price is associated by increase in volume. It means that there is good buying pressure in the market and it would be reflected as further increase in price because more and more traders would like to get benefitted from the up going price rally and buy with the hope of selling at better price later.
Similarly, if decreasing price during downtrend is associated with good volume, it means more and more traders are selling the asset. It may be due to some traders booking price at the beginning of downtrend and some selling out later during the course of trend to prevent losses. So a good volume during downtrend would be reflected as further price drop.
Similarly during divergence of volume, traders are not following the trend and that is than reflected as trend reversal. So by looking at volume, we can sometimes predict the price with fair degree of accuracy.
Is it better to use the volume indicator alone or use it in parallel with another indicator when trading? Justify your answer
It is undoubtedly better to use Volume indicator in parallel with other indicators like support and resistance, candlestick patrerns , EMAs , RSi, ADX etc because no indicator is 100% authentic and certain in providing signals. Moreover, volume is not the sole factor that determines price of an asset as can be seen during ICOs and Donations when increasing volume is not necessarily followed by increase in price .
Look at ETH/BTC chart below :
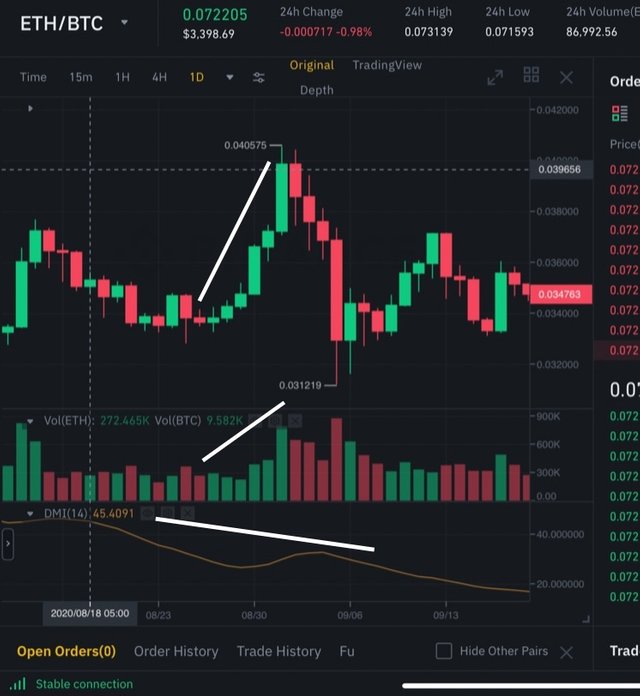
For the portion of uptrend shown above, we see as price increases volume increases signaling a strong bullish trend. If we follow only volume and price action, we may have neutralised a portion of our profit with subsequent rapid reversal of price as volume doesn't point towards reversal. But looking at other indicator, Average directional index along with price we can see that ADX is decreasing which means decreasing strength of the trend while volume was showing increasing trend strength. So taking support from ADX would have been beneficial for the trader then using volume and price action alone.
The volume indicators are multiple, choose one of them to briefly explain its usefulness in crypto trading.
There are many volume based indicators with different peculiarities like volume RSI, On-balance volumen(OBV), money flow index, volume price trend indicator, Chaikin Money Flow Indicator etc. For this task, I'll be discussing On-balance volume indicator (OBV) .
OBV was developed by Joseph Granville in 1963 . It is a momentum indicator that correlates price with volume.
Calculation of OBV.
OBV determines whether the volume is favouring the trend or not. Formulae are given below.
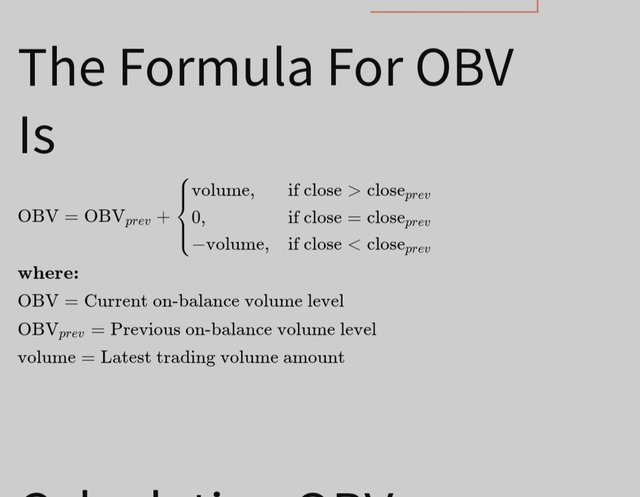
Let's take an example of one day time frame. Three possibilities for price exists as :
The asset that we have choosen for analysis has closed at Price higher than yesterday's closing price . In this case , OBV is calculated by summation of today's volume and yesterday's volume.
if today's closing price is lower than yesterday's closing Price, than OBV is calculated by subtracting today's volume from yesterday's volume
- Ir today's closing price is same as that of yesterday, than OBV will remain same .
Working of OBV
I'll be explaining working of OBV with example .we will have to look at both OBV and price chart.
If both OBV and Price action are making higher high and higher lows , it indicates strong bullish trend and is likely to continue.
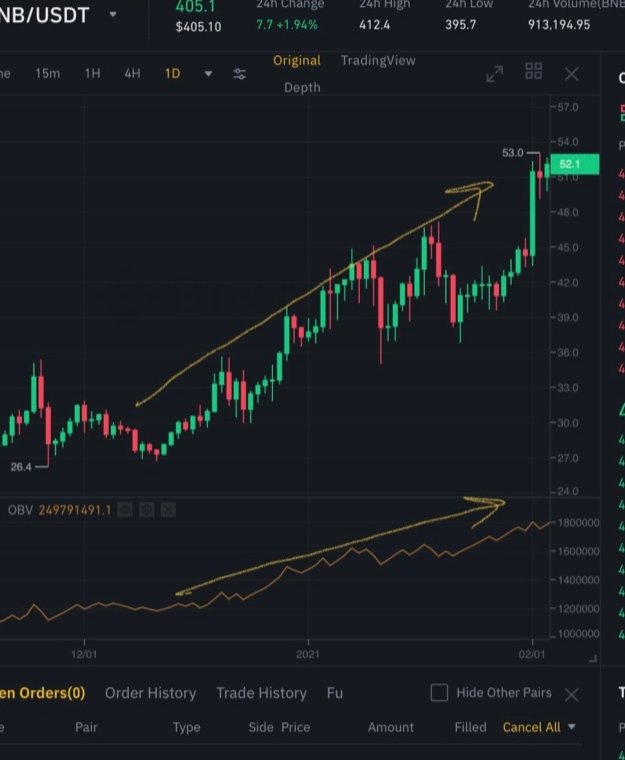
BNB/USDT chart showing both OBV and price syncingIf both OBV and Price action are making lower lows and lower highs , it indicates strong bearish trend and is likely to continue.
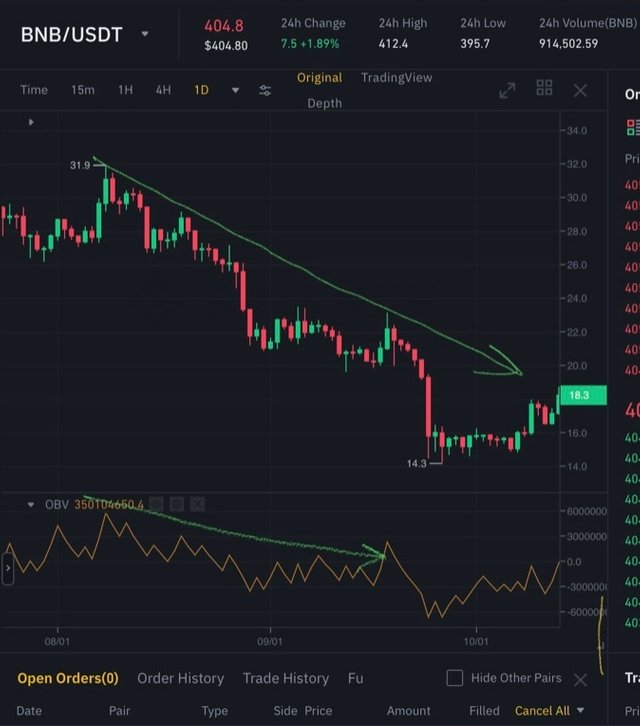
BNB/USDT chart showing both OBV and price making lower lows and lower highsWhen price is making higher highs but OBV is making lower highs, that is known as negative divergence and indicates forthcoming bearish trend.
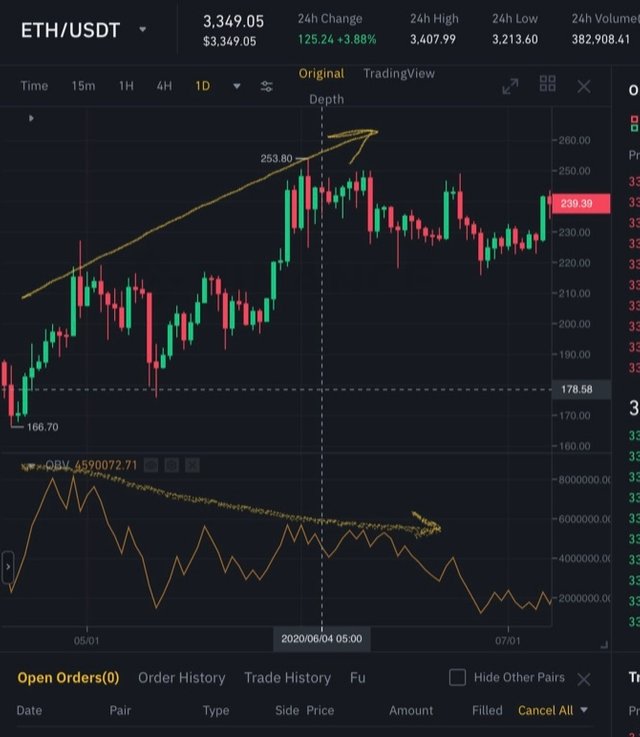
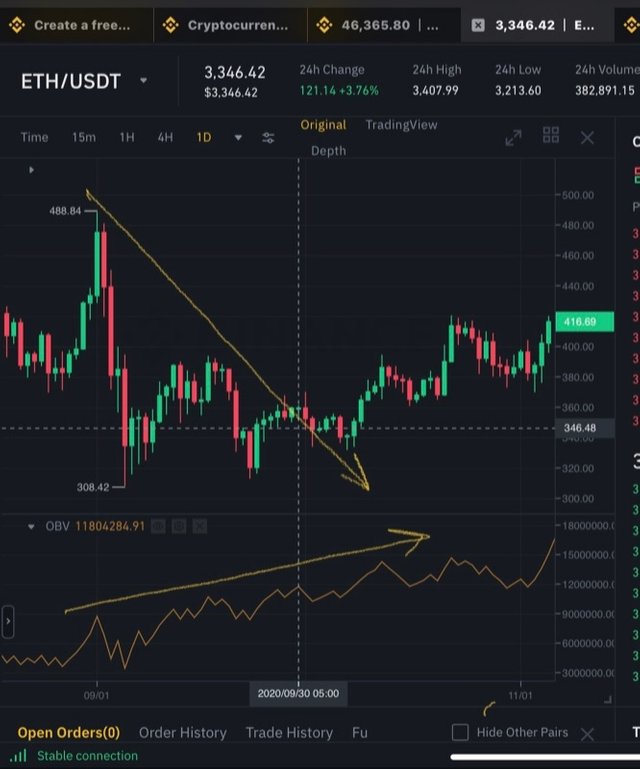
ETH/USDT chart showing negative divergenceWhen price is making lower highs but OBV is making higher highs, that is known as positive divergence and indicates forthcoming bullish trend.
( )
)
ETH/USDT chart showing positive divergence and rise in price thereafter
Conclusion:
Volume indicator represents number of shares or coins traded over a particular time frame. Larger volume bars represent more number of hands exchanged between buyers and sellers. Whether these high volume bars are formed during uptrend or downtrend, they represent srrength of that particular trend. Divergence in volume can be used to predict price reversal. Volume indicator is useful during breakouts to prevent traders from falling into fakeouts. Although simple but very useful tool when used along with other indicators. Volume of an asset is such an important parameter that about a dozen of indicators have been created based on volume.
Hi @drqamu
Thanks for participating in the Steemit Crypto Academy
Feedback
This is good content. Thanks for demonstrating your understanding of Trading with the Volume indicator.
Total| 9/10
Thank you