Trading with Accumulation / Distribution (A/D) Indicator - Crypto Academy / S4W5 - Homework Post for [@allbert]
Hope you are all fine. Today i am writing homework task for professor @allbert , which is about accumulation distribution indicator.

Explain in your own words what the A/D Indicator is and how and why it relates to volume. (Screenshots needed).
Accumulation distribution indicator as the name implies is is a tool to determine whether an asset is in accumulation phase or distribution phase of a market cycle. The analogy is drawn on the basis of price and volume of an asset. So to understand A/D, we should have basic understanding of accumulation and distribution.
An asset is said to be in accumulation phase, when the price of an asset increases with the increase in volume. On the other hand, an asset is said to be in distribution phase, when the price of an asset decreases with the decrease in volume. In terms of market psychology we can understand it as, during accumulation phase traders are willing to buy the asset and therefore more and more traders are participating in the trade of the asset, that results in increase in the volume and the price. On the contrary, during distribution phase, the traders lose the interest in buying and therefore resort to selling and that pushes the price of an asset down.
If A/D is projected upwards while price is rising, it confirms uptrend. While as if A/D is projecting downwards while price is falling, it confirms downtrend.
Theoretically speaking, as accumulation and distribution is the function of volume,
therefore A/D indicator is dependent upon volume. Same inference can be drawn from the mathematical derivation of A/D as discussed in formula in next section.
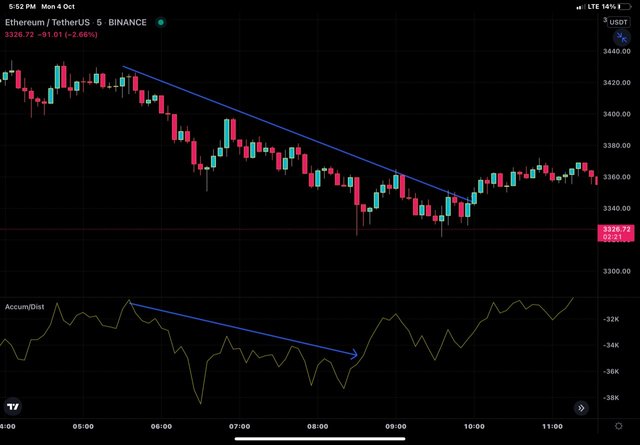
Now let try to look at the chart below and analyse how A/D is influenced by volume.
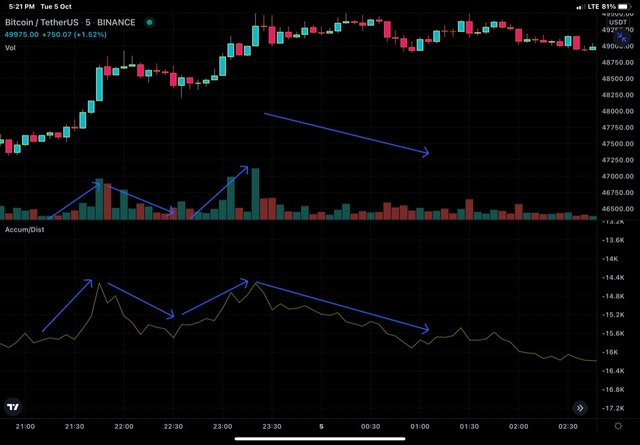
In the BTC/USDT chart above, i have marked areas of increasing volume and corresponding upstroke of indicator and also areas of decreasing volume and downstroke of A/D indicator. It is clearly shown that as the volume of an BTC increases, price increases and so does A/D indicator. On the other hand, as volume decreases price decrease and A/D indicator also decreases.
Through some platforms, show the process of how to place the A/D Indicator (Screenshots needed).
I'll be using tradingview app. You can do it from official website of trading view too.so i begin by aunching trading view app.
Select any trading pair. Chart of the pair will load.
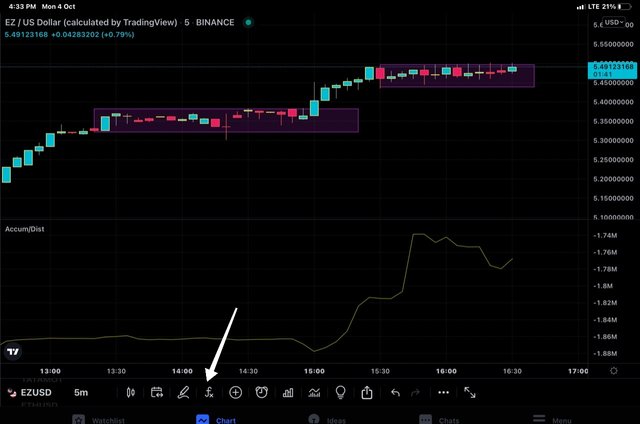
Click on indicators from the top menu. In my case, i have Indicators option at bottom of the chart.
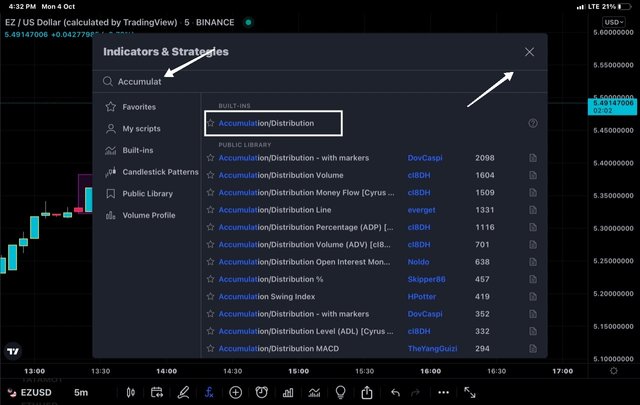
Next we type accumulation distribution in the search box provided and select same Indicator from the suggestions.
Go back to your chart and you will find indicator loaded at bottom of your chart.
Explain through an example the formula of the A/D Indicator. (Originality will be taken into account).
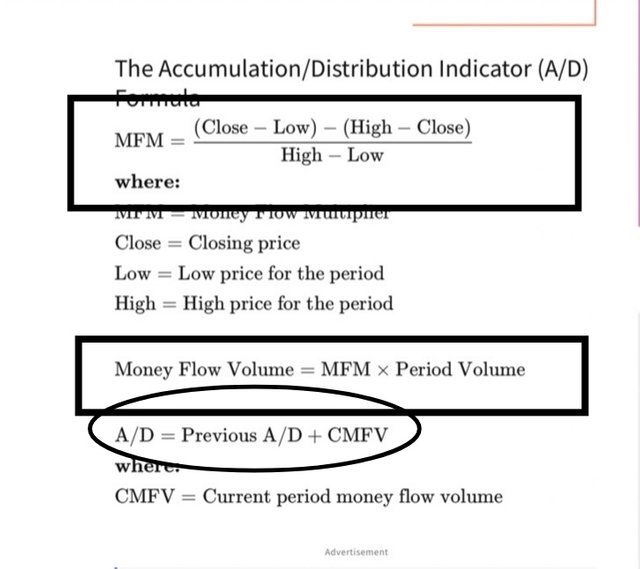
The formula for calculating A/D is given below.
Source
So to calculate A/D for any period, we need to calculate Money flow multiplier (MFM) and **money flow volume(MFV) **.
MFM= High−Low
(Close−Low)/ (High−Close)
Money Flow Volume=MFM×Period Volume
A/D=Previous A/D + CMFV
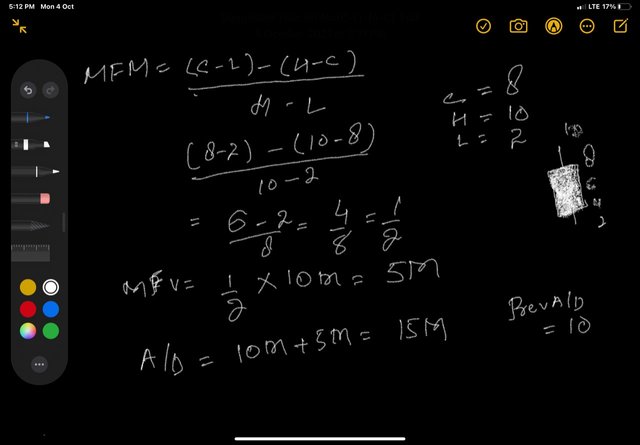
For calculating money flow volume, we need to know High, low and closing price of an asset for any period. Let's presume any asset A has high of 10$ , low of 2$ and closing price of 8$ during any period and volume during that period is 10M. So MFM for that period will be 1/2 and MFV will be 5M.
How is it possible to detect and confirm a trend through the A/D indicator? (Screenshots needed)
To detect and confirm the trend, we need to look at price as well as A/D
If A/D is projected upwards while price is rising, it confirms uptrend. While as if A/D is projecting downwards while price is falling, it confirms downtrend. Uptrend means that buyers are showing interest in the asset under consideration and therefore money is flowing into the asset that keeps on pushing the price of asset higher. On the contrary, downtrend means a decreasing interest of the the buyers in the asset and they resort to selling and flow of money out of the market and thereby decreasing the price of an asset.
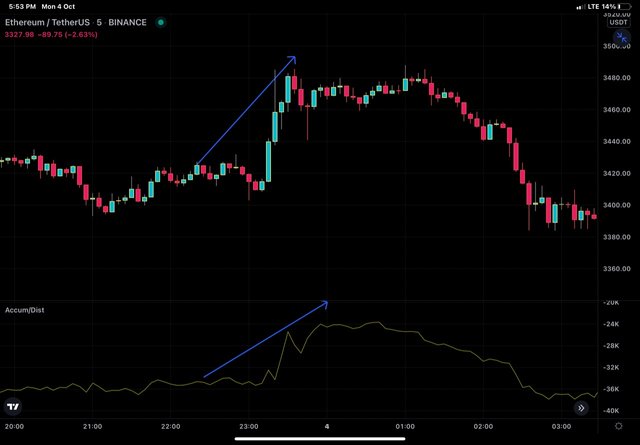
ETH/USDT chart showing syncing of price and A/D during uptrend
ETH/USDT chart showing syncing of price and A/D during downtrend
Another perspective of A/D indicator is divergence. Divergence refers to the direction of the AD indicator against the price rally. If the price of an asset is increasing while as AD indicator is projected in the downward direction, it means the negative divergence and indicates the forthcoming price drop. On the contrary, if the price of an asset is decreasing and AD Indicator is projected upwards, it means a positive divergence and indicate the forthcoming bullish trend. So divergence of the A/D indicator help in predicting the trend before the trend actually starts and once the trend has started then the direction of the AD indicator reflects the strength of the trend.
I'll be giving an example of bearish divergence that i spotted before actual price drop.
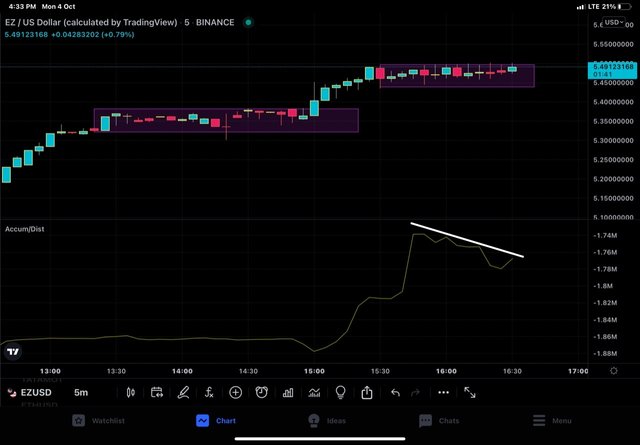
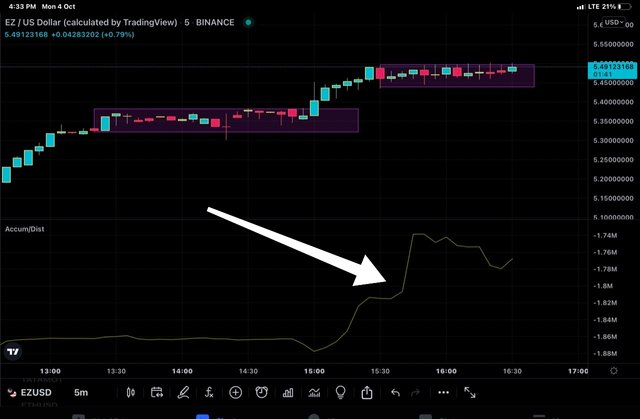
EZ/USD chart showing bearish divergence
In the chart above, we can see that EZ is consolidating in a particular range as indicated by rectangle drawn. When we look at the corresponding AD indicator, we can see that the AD indicator is projecting downwards indicating that the consolidation will be followed by a drop in price. In the next screenshot, we will see weather that happened or not.
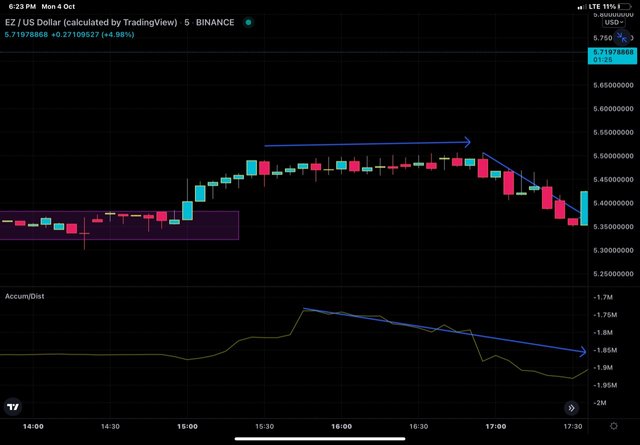
EZ/USD chartshowing bearish divergence
In the chart above, we can see that price drop does occur after bearish divergence.
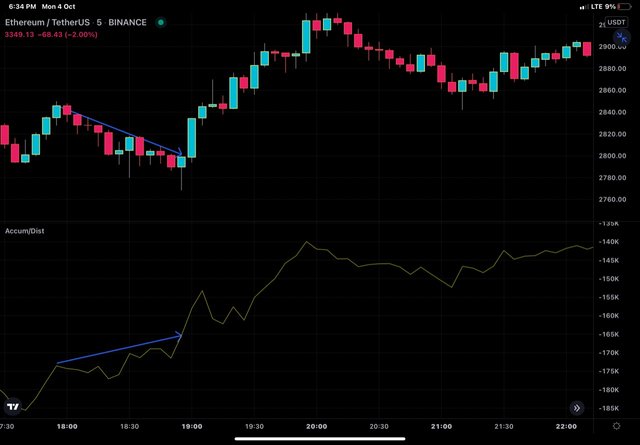
ETH/USDT chart showing bullish divergence
In the chart above, we can see that as price of ETH was falling, AD shows bullish divergence which is followed by bullish rally of price.
Through a DEMO account, perform one trading operation (BUY or SELL) using the A/D Indicator only. (Screenshots needed).
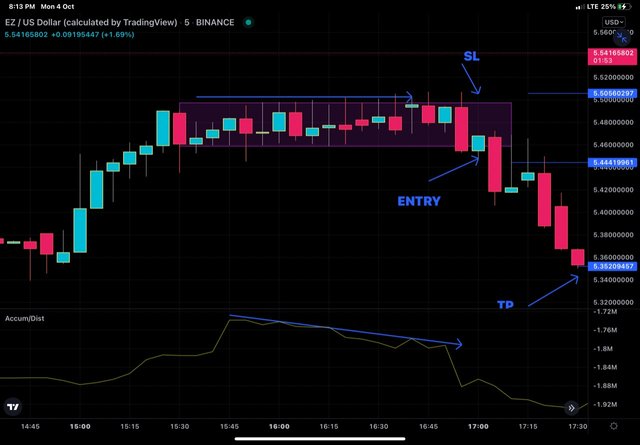
EZ/USD sell entry
I found a consolidating stock and divergence on the A/D Indicator is bearish.
Consolidating zone is marked by a rectangle. Once the lower line of rectangle is broken by a powerful bearish candle, i entered.
Stoploss is placed just below the upper line.
Entry was at $5.44 and SL was set at $5.50.
Take profit was set at $5.35 making it a SL/TP ratio is 1:1.5
What other indicator can be used in conjunction with the A/D Indicator. Justify, explain and test. (Screenshots needed).
We know that no indicator is absolute. Just like any other indicator, A/D has limitations too. AD only manifests change in closing price of an asset over a given period. The price changes in between are neglected and therefore with the use of A/D, we don't get any idea of change in market price in between periods of observation. So other volume based indicator like OBV (on balance volume) , ADX etc should be used to support it.
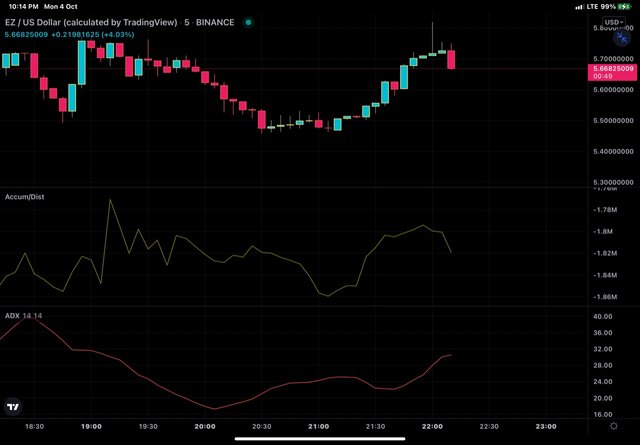
EZ/USD chart showing A/D and ADX together
In the screen shot above, we can see both A/D and ADX moving with the trend in same direction but shape of A/D is influenced by each candle and more so by closing price. We can see A/D shows sharp dips with each bearish candle during downtrend and spikes with each bullish candle during uptrend. On the other hand ADX also gives direction and strength of trend but is not affected much by individual candle closing. So it forms smooth down and up protecting curve. The perception of trend formed on the basis of A/D is rough than ADX. Therefore, use of both of them together would supplement each other.
Conclusion
A/D indicator is a simple tool to detect direction and strength of trend in the market. A/D divergence gives clue about future trend reversal and provides signals to enter or exit from the market. When used along with other indicators, it is a good and simple tool to benefit from.