Trading Crypto with Keltner Channels - Crypto Academy / S5W6 - Homework Post for @fredquantum.
Hope you are all doing well. We are gradually getting to learn new things. Ibowe all my crypto knowledge to Cryptoacademy. Today I am writing homework task for professor @fredquantum , which is about "Keltner Channels".
Creatively discuss Keltner Channels in your own words.
Keltner Channels was first introduced by Chester W. Keltner in the 1960s based on a simple moving average but the indicator was later reviewed by Linda Raschke in the 1980 and formulated Average True Range based formula for Keltner Channel, which we shall discuss.
Keltner Channel is a technical analysis tool that makes use of volatility indicator or average true range (ATR) to determine various trading signals like breakout, dynamic support and resistance, trend confirmation and reversal etc. As for the morphology of the indicator is concerned, it has 3 lines.
The middle line is an exponential moving average of price. When the indicator was initially launched in the 1960s, the middle line was based on a simple moving average but it was later modified and now the middle line is an exponential moving average set 20 periods by default. However, a trader can change the settings of the indicator to choose the period as per their convenience or trading style and experience. Keltner channel indicator makes use of the average true range to determine the orientation of the lines placed above and below the middle line. The upper line is set 2 times the ATR above the middle line and the lower line is set two times the ATR below the middle line.
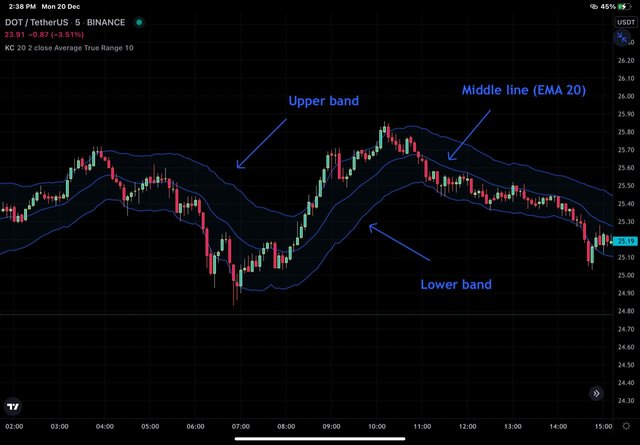
Keltner channel indicator applied on chart
The configuration of the indicator is such that the price mostly tends to remain localised within the lines and the upper and lower lines act like bands and are commonly known as upper and lower bands and the indicator acts as a channel.
The direction and angle of the Keltner Channel aid in detecting the trend and movement of price lines within or outside the channel help in identifying trend continuation or change. We shall discuss specifics in subsequent sections.
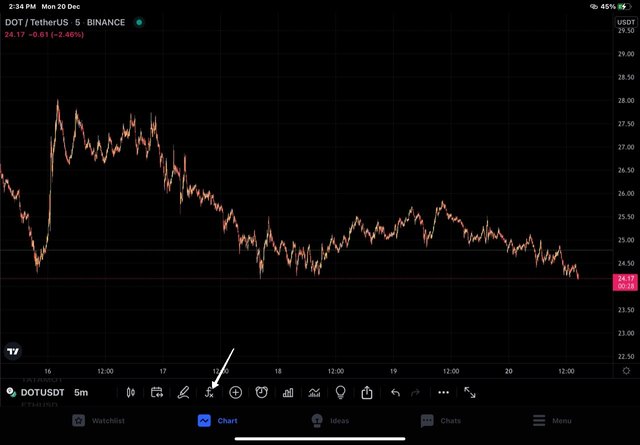
Setup Keltner Channels on a Crypto chart using any preferred charting platform. Explain its settings. (Screenshots required).
For this task, I'll be using the trading view app. You can do it from the official website of trading view too. I launched the trading view app.
Select any trading pair. Chart of the pair will load.
Click on indicators from the top menu. In my case, I have the Indicators option at bottom of the chart.
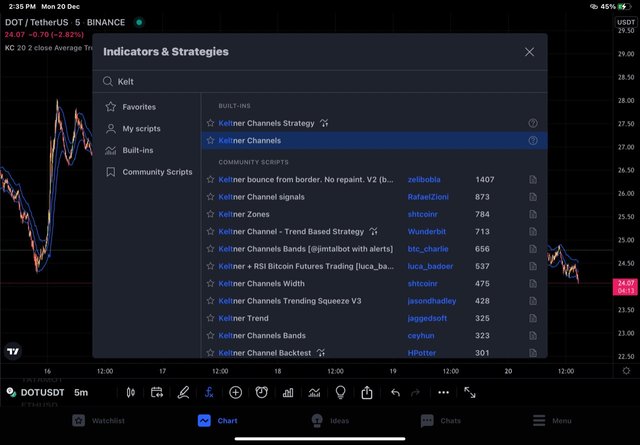
Next we type "Keltner Channel" in the search box provided and select the same Indicator from the suggestions.
Go back to your chart and you will find an indicator loaded to the chart.
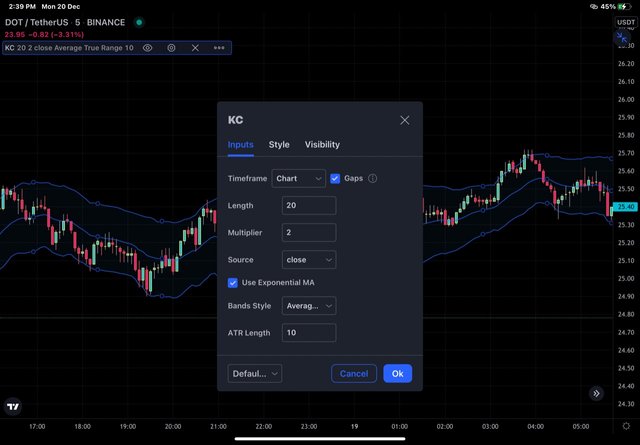
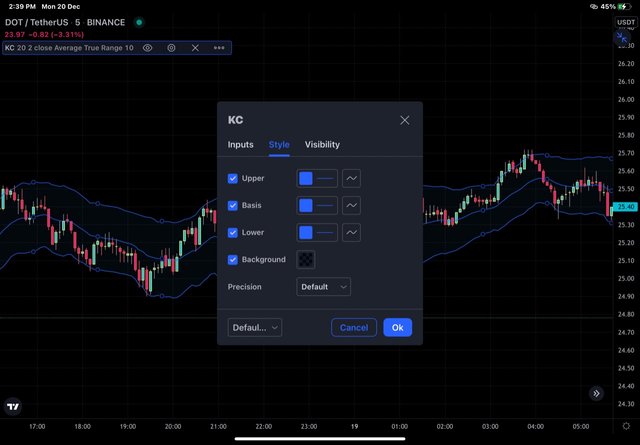
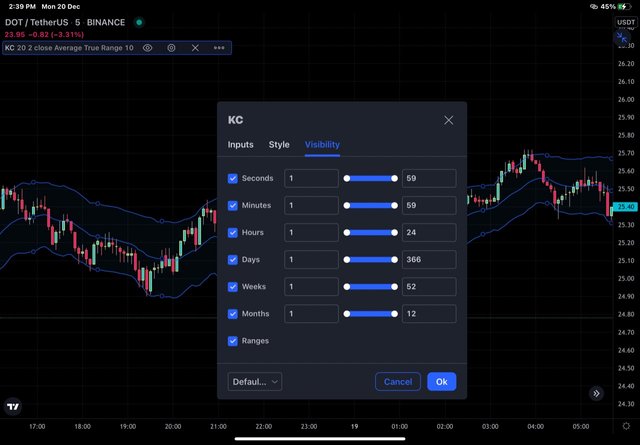
Configurations of the Keltner Channel Indicator.
Double click on Indicator and chart settings will load.
Style settings: Here we can choose the colour of upper band , lower band , basis, background and precision etc.
Inputs settings, we have indicator length, multiplier, ATR length, Bands style etc. ATR length is 10, length is 20 and multiplier is 2.
Visibility- we have seconds, minutes, hours, days, weeks, months. Let's keep default settings for visibility.
How are Keltner Channels calculated? Give an illustrative example.
As mentioned above, Keltner Channel makes use of ATR and EMA. The default setting for EMA is 20 and ATR length is 10 periods. Formullae for different lines of indicator are :
Upper Band= EMA + (2 * ATR).
Middle Line= The EMA over 20 periods.
Lower Band= EMA - (2 * ATR).
Example to illustrate the calculations.
I have applied the Keltner channel indicator and ATR over the DOT/USDT chart below. One thing to be careful about is the setting of the ATR indicator applied separately. The default setting of the ATR indicator applied seprately is 14. Change it to 10 periods as the same setting is applied with the Keltner Channel indicator. Let's proceed to calculations,
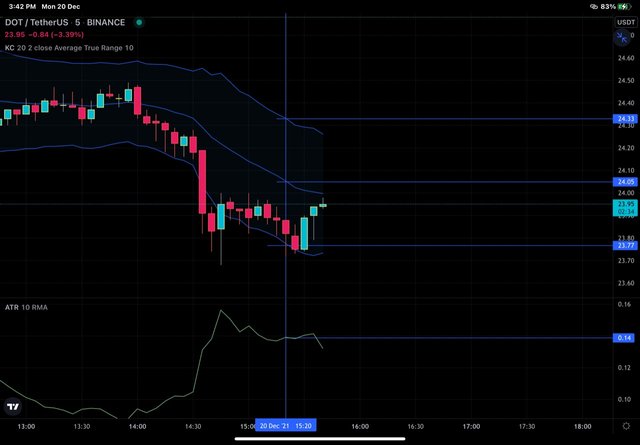
DOT/USDT chart
In the above chart, let's calculate the Keltner channel indicator for the period depicted by the vertical line. We can see that ATR for the mentioned period is equal to 0.14. And EMA(20) is equal to 23.05
Upper band = EMA + (2 x ATR)
Upper band = 24.05 + (2 x 0.14) = 24.05 + 0.28 = 24.33
Lower band = EMA - (2 x ATR)
Lower band = 24.05 - (2 x 0.14) = 24.05 - 0.28 = 23.77
We can see that the calculated values for the upper and lower bands are the same as that of the values shown on the chart.
What's your understanding of Trend confirmation with Keltner Channels in either trend? What does sideways market movement looks like on the Keltner Channels? What should one lookout for when combining 200MA with Keltner Channel? Combine a 200MA or any other indicator of choice to validate the trend. (Separate screenshots required)
We know that there are two types of trends in the market- uptrend and downtrend. During an uptrend, the price of an asset under consideration increases while as during a downtrend, the price of an asset under consideration decreases. When we apply the Keltner channel indicator to the chart, it means that we are equipped with one more tool to confirm the trends in the market. So we will have to look at price action as well as the orientation of the Keltner channel indicator during a trend.
During an uptrend, the price of an asset takes support from the middle line of the indicator and keeps on increasing towards the upper band. The Keltner channel indicator is oriented upwards in the direction of increasing price.
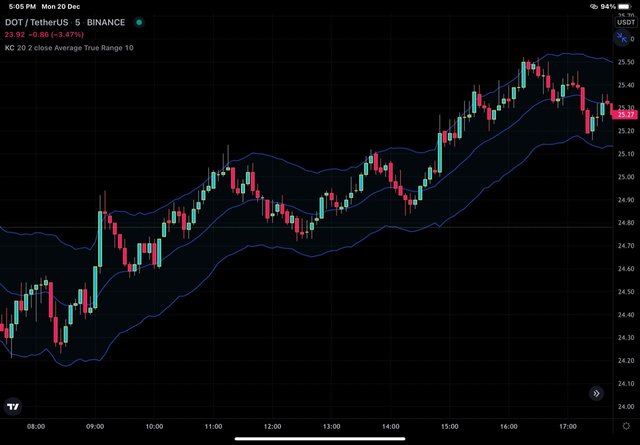
In the chart above, we can see that the price of DOT is taking support from EMA 20 line and keeps on moving upwards. At the same time when we look at the orientation of the Keltner indicator, we can see that the indicator is projected upwards.
During a downtrend, the price of an asset is going down and the Keltner channel indicator is oriented downwards that is in the direction of price. To put it simply, we can say that price is moving down and indicator is also angled downwards. when we look at the moment of price within the Keltner channel indicator, we can see that the price is taking resistance from the middle line and is moving down towards the lower band.
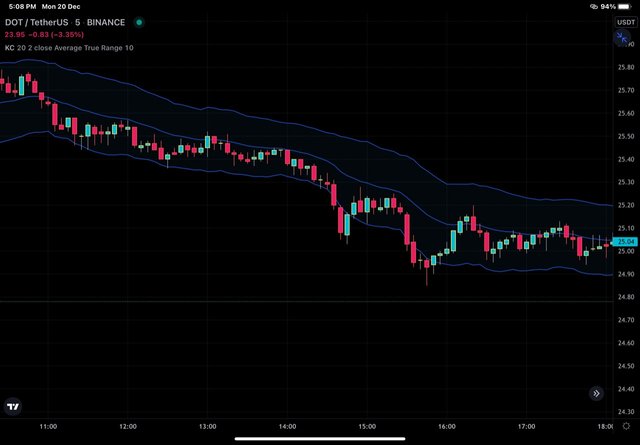
In the DOT/ USDT chart above, we can see that as the price of DOT decreases, the middle Band (EMA 20) is acting as a resistance and the price of DOT keeps on decreasing towards the lower band.
Sideways Market
Sideways market or choppy market represents the state of indecision within the market that is manifested as the movement of price within a more or less well-defined zone where the upper price level act as and lower price level access support
The ranging market on the Keltner channel indicator manifest as the movement of price between the lower band and upper band. To put it simply, we can say that the upper band act as a resistance and the lower band act as support.
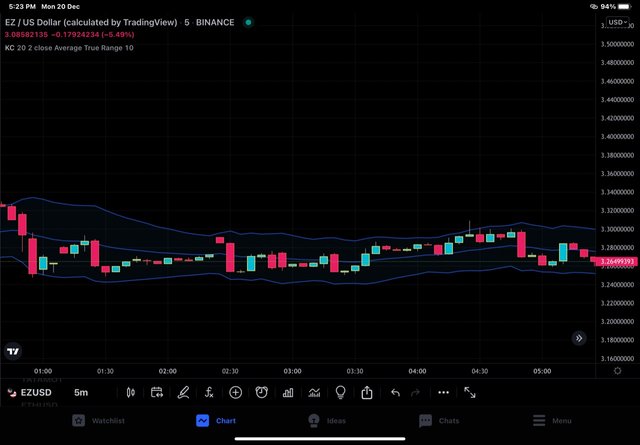
DOT/USDT showing ranging market
in the DOT/USDT Chart above, we can see that price is moving within a zone formed by upper and lower bands of the Keltner Channel indicator.
Use of 200 EMA with Keltner Channel Indicator
200 EMA can be used along with the Keltner channel indicator to confirm the signal generated based on the Keltner channel indicator. As the concept of trend is clear to us based on price action and Keltner channel indicator, now we look at the use of 200 EMA along with the Keltner channel indicator.
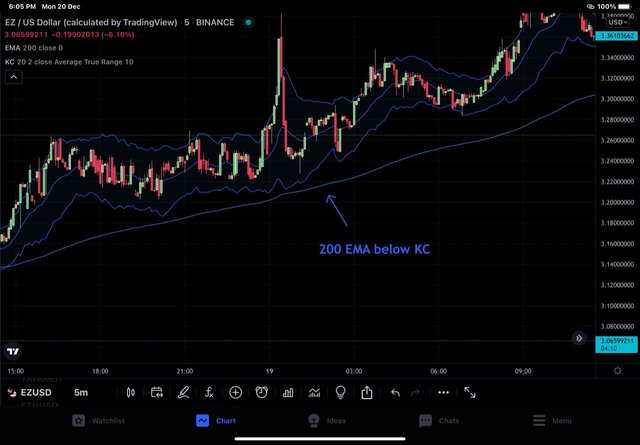
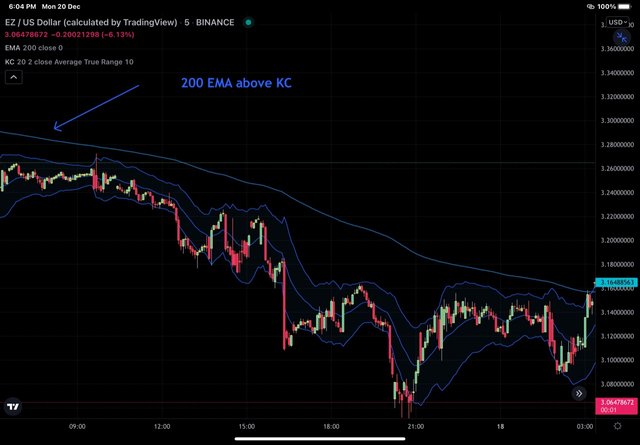
We will have to look at the following orientation of the Keltner channels indicator with respect to the 200 EMA
To confirm the uptrend, the Keltner channel indicator must be placed above the 200 exponential moving average.
To confirm the downtrend, the Keltner channel indicator must be located below that 200 exponential moving average.
For the ranging market, 200 exponential moving averages must be located within the Keltner channel indicator.
Uptrend - 200 EMA below Keltner channel indicator
Downtrend - 200 EMA above Keltner Channel indicator
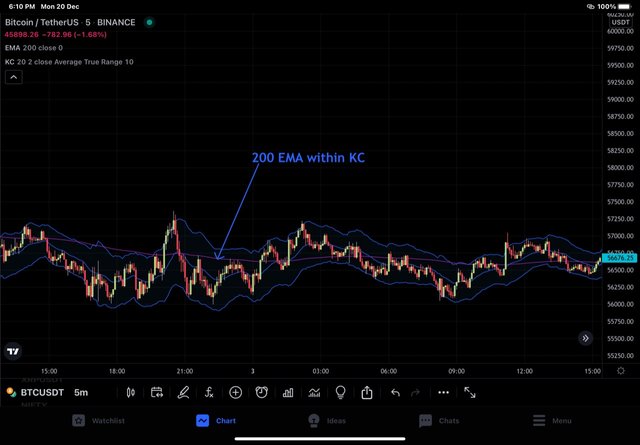
Ranging Market - 200 EMA within Upper and lower band
What is Dynamic support and resistance? Show clear dynamic support and resistance with Keltner Channels on separate charts. (Screenshots required).
By now, we are aware of rhe concept of support and resistance. We know that support and resistance are horizontal levels from where prices bounce back. Support is a level from where price is expected to move up and resistance is a level from where the price is expected to move down. we can call these levels static support and resistance levels because these are horizontal levels placed at a particular price point or level.
With the help of the Keltner channel indicator, we have seen that different lines of the indicator act as support and resistance in different markets. if you take the two extreme lines - upper and lower band, we have seen above that, in a ranging market the upper band acts as resistance and lower band acts support. As these lines are not present at the fixed or particular price levels, they keep on moving although slightly, so these are known as dynamic support (lower band) and resistance (upper band).
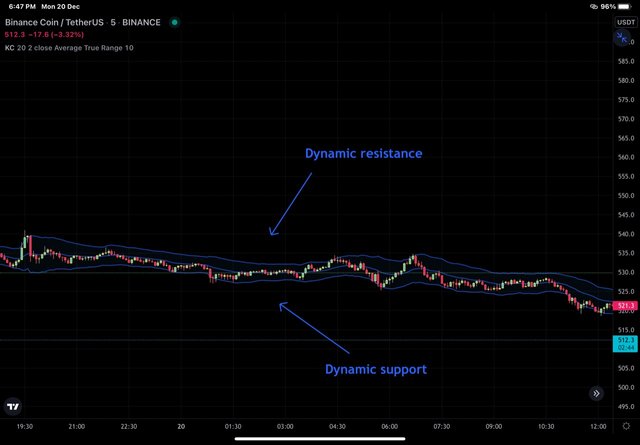
BNB/USDT chart showing dynamic support and resistance. The upper band acts as dynamic resistance and the lower band as dynamic support
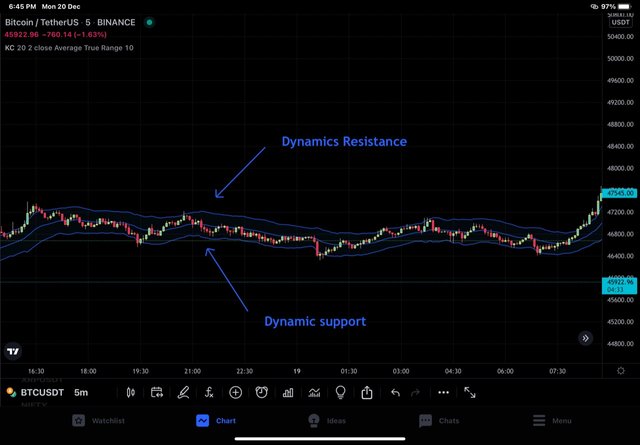
BTC/USDT chart showing dynamic support and resistance. The upper band acts as dynamic resistance and the lower band as dynamic support
What's your understanding of price breakouts in the Crypto ecosystem? Discuss breakouts with Keltner Channels towards different directions. (Screenshots required).
The market structure of crypto assets is such that the price keeps on moving between some important levels and those levels are technically known as support and resistance. As discussed above, support represents a level where the price is expected to bounce back towards the upper direction and resistance represents a level where the price is expected to bounce back towards the downward direction. so the movement of price between these levels is a normal phenomenon. When the price of an asset breaks these important levels, that is known as a breakout.
To put it simply, we can say that when the price of an asset breaks above the resistance or below the support level that is known as a breakout. we have seen that upper and lower bands of the Keltner channel indicator act as important resistance and support levels respectively. Applying the abov mentioned concept of a breakout to the Keltner channel indicator, we can say that, when the price of asset breaks above the upper band or breaks below the lower band, that validates the breakout on the basis of the Keltner channel indicator.
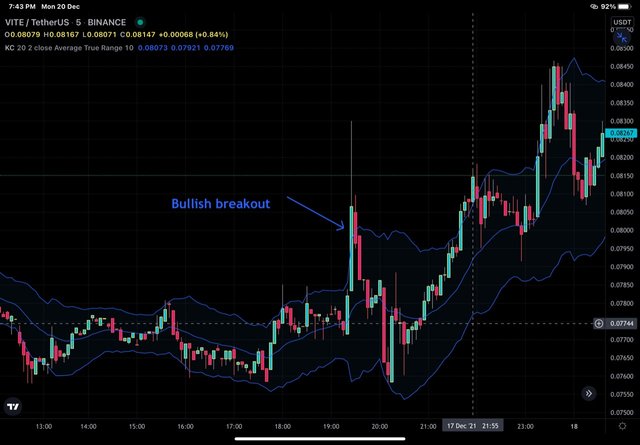
In the chart above we can see that price of VITE was consolidating in a well-defined zone bounded by the upper and lower band of the Keltner channel indicator for some time and then a strong bullish candle broke above the upper band, it validates that bullish breakout as can be seen by the bullish rally of price thereafter.
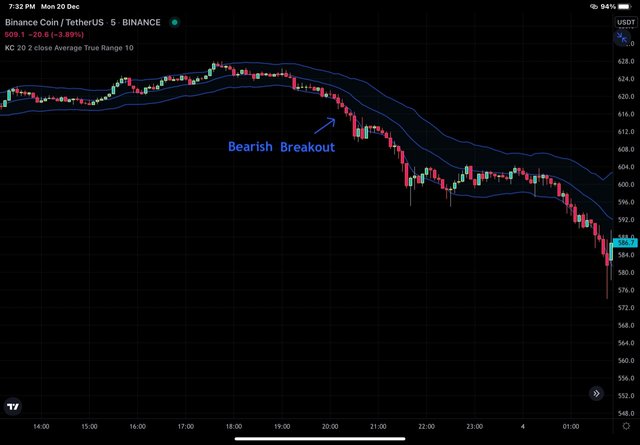
in the chart above we can again see that price or BNB consolidates between an upper and lower band of Keltner channel indicator and then a strong bearish candle broke below the lower band and then the bearish rally of price thereafter validate the breakout in a bearish direction.
What are the rules for trading breakouts with Keltner Channels? And show valid charts that work in line with the rules. (Screenshot required).
The concept of breakout has been discussed above. The idea of this section is to be able to trade the breakout by getting to know the rules of breakout. So let's test our understanding of rules.
Rules for trading bullish breakout with Keltner channel
Firstly, we will have to look for a consolidating market or a reversal of price movement after a downtrend. Look for a strong bullish candle that gives closing above the upper band of the indicator.
For swing traders, it is always a sane strategy to wait for a retest, however intraday traders can at times miss out the significant portion of the bullish move that follows steep upward movement covered by a strong bullish candle.
Once re-test has occurred, wait for the price to move above the middle line on the Keltner channel indicator then look for 2 to 3 bullish candles. Enter at the third or fourth bullish candle.
Place stop loss below the support line (middle line)and take profit level will be determined by a logical SL/TP ratio. Beginners can satisfy themselves with an SL / TP ratio of 1:1. Experienced traders can make use of trailing stop loss wherein the middle line of the Keltner channel indicator will act as a dynamic support level.
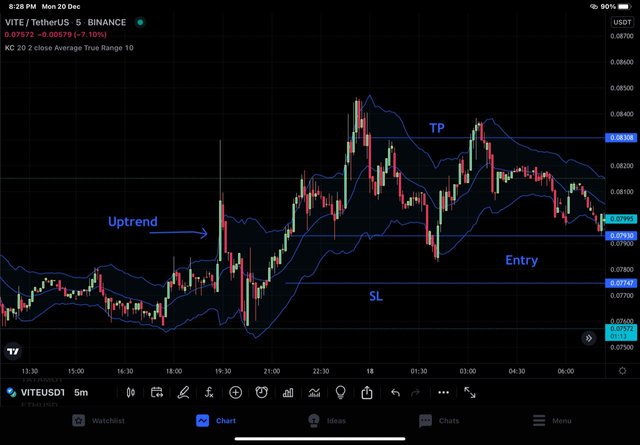
In the VITE/USDT chart above we can see that price broke the upper band of the Keltner channel indicator after consolidating for a while and then the price again entered the channel and again took support from the middle line. The price then started moving up. I entered the market at a VITE price of 0.0 79USDT and place stoploss below the middle line of the Keltner channel indicator (0.079 USDT). And TP at 0.083USDT (SL/TP > 1:1.5).
Rules for trading bearish breakout with Keltner channel
Firstly, we will have to look for a consolidating market or a reversal of price movement after an uptrend. Look for a strong bearish candle that gives closing below the lower band of the indicator.
For swing traders, it is always a sane strategy to wait for a retest, however intraday traders at times miss out a significant portion of the bearish move that follows steep downward movement covered by a strong bearish candle.
Once a re-test has occurred, wait for the price to move below the middle line on the Keltner channel indicator then look for 2 to 3 bearish candles. Enter at the third or fourth bearish candle.
Place stop loss above the support line (middle line)and take profit level will be determined by a logical SL/TP ratio. Beginners can satisfy themselves with an SL / TP ratio of 1:1. Experienced traders can make use of trailing stop loss wherein the middle line of the Keltner channel indicator will act as a dynamic support level.
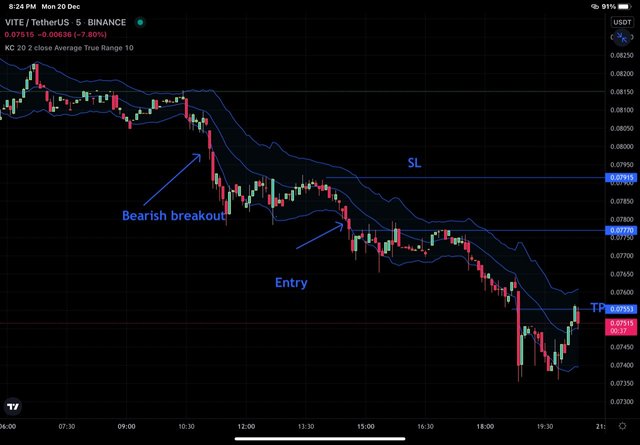
In the vite/usdt chart above, we can see that price broke the lower band of the Keltner channel indicator after consolidating for a while and then the price again entered the channel and again took support from the middle line. The price then started moving down. I entered the market at a VITE price of 0.0 77 USDT and place stop loss above the middle line of the Keltner channel indicator(0.079 USDT). And TP at 0.0 75 USDT (SL/TP= 1:1).
Compare and Contrast Keltner Channels with Bollinger Bands. State distinctive differences.
Keltner channels and Bollinger bands are are seemingly similar indicators that provide valuable information about identification of trend, buy and sell signals to be materialized, support and resistance identification etc.
Keltner channel indicator is based on ATR where as Bollinger bands is based on standard deviation.
Keltner channels indicator reacts quickly to the price changes where as Bollinger bands react slowly.
Place at least 4 trades (2 for sell position and 2 for buy position) using breakouts with Keltner Channels with proper trade management. Note: Use a Demo account for the purpose and it must be recent trade. (Screenshots required).
BUY Trade (BTC/USDT)
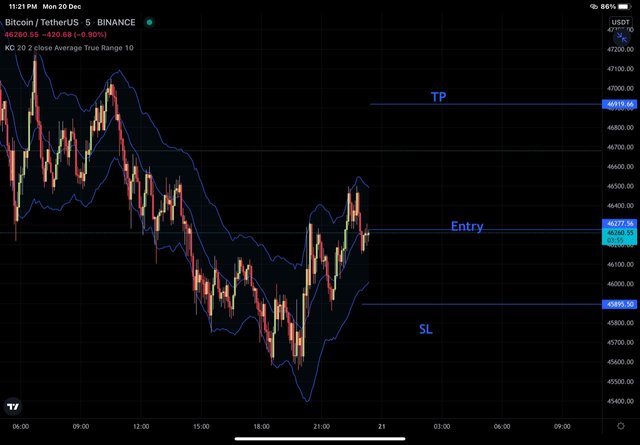
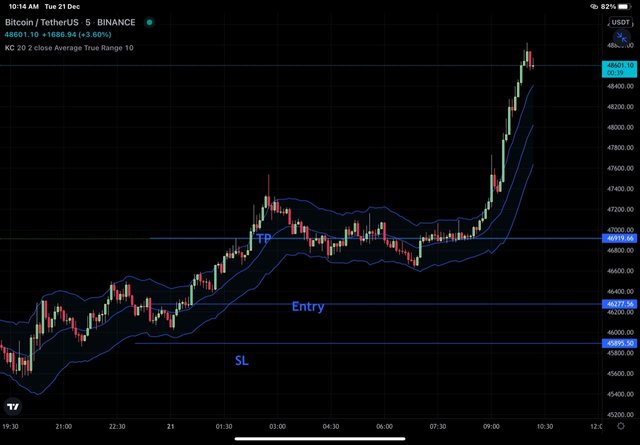
In the BTC/USDT Chart above, I am trading reversal. As seen in the chart above, BTC is showing reversal after a strong downtrend as seen by change in the orientation of the keltner channel indicator from downwards to upwards and price action changed its direction of movement from its confinement between middle and lower band to middle line and upper band.I entered into the market after retest of the middle line twice at BTC price of 46277$.I placed stoploss below the lower band(45896$)and tp at 46920$.we can see in the second chart above that the TP was hit .
Buy Trade (BNB/USDT)
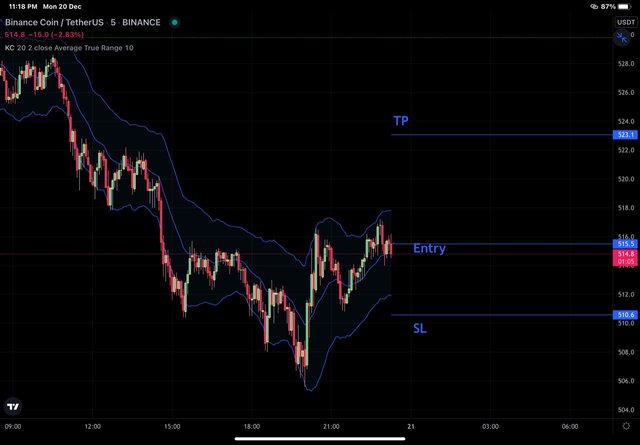
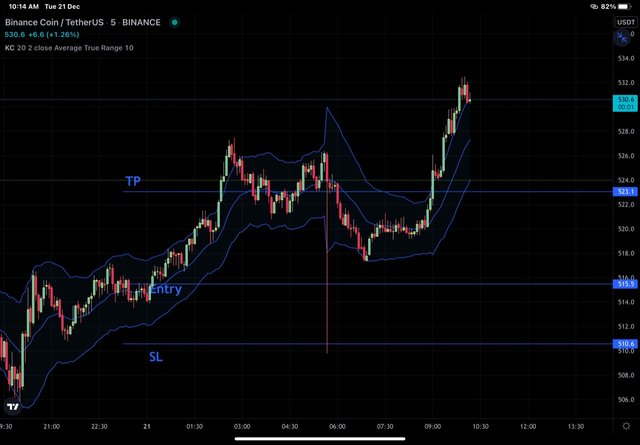
In the BNB/USDT Chart above, I am trading reversal. As seen in the chart above BNB is showing reversal after a strong downtrend as seen by change in the orientation of the keltner channel indicator from downwards to upwards and price action changed its direction of movement from its confinement between middle and lower band to middle line and upper band.I entered into the market after retest of the middle line twice at BNB price of 515.5$.I placed stoploss below the lower band(510.6$)and TP at 523.1$.we can see in the second chart above that the TP was hit .
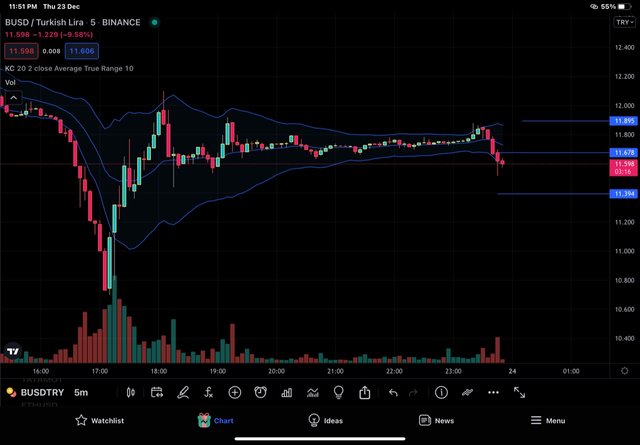
Sell - BUSD/TRY
Entered Market
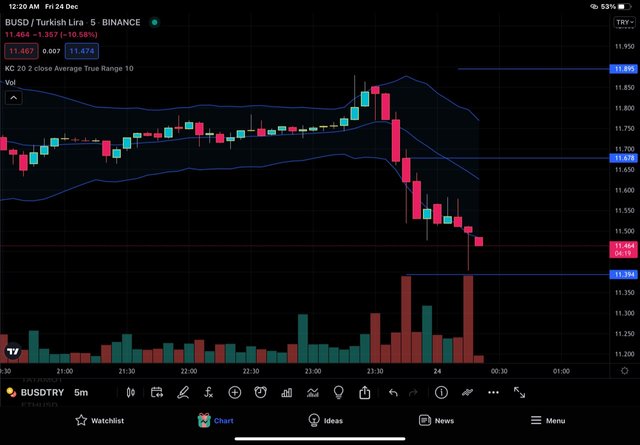
TP hit
In the BUSD/TRY chart above, BUSD is breaking down the lower band and than entered into Keltner channel indicator and took resistance from middle band. I entered at BUSD price of 0.00001309 TRY and set SL above the middle band and TP at 0.00001290 . We can see in the chart above that TP was hit by a long candle that later formed long lower wick.
Sell trade - BNB/USDT
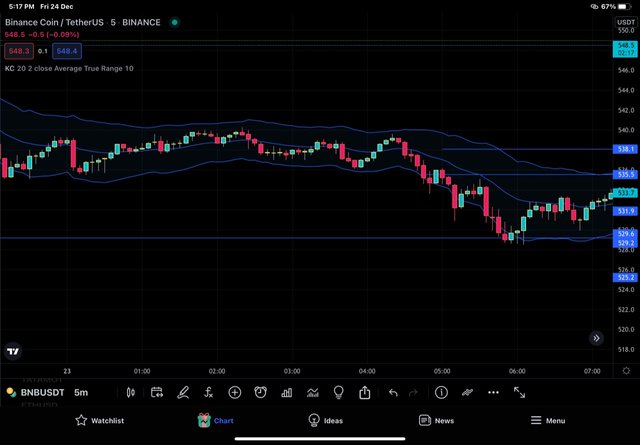
In the BNB/USDT chart above, BNb is breaking down the lower band and than entered into Keltner channel indicator and took resistance from middle band. I entered at BNB price of 535 USDT and set SL above the middle band and TP at 529 USDT . We can see that TP was hit.
What are the advantages and disadvantages of Keltner Channels?
,
Advantages of the Keltner channel indicator
Keltner channel indicator is simple to calculate and comprehend.
The signals generated by the indicator are easy to understand and materialise.
It is a comprehensive indicator as for generation of signals is concerned.
The indicator is itself a combination of multiple indicators like EMA and ATR and therefore the signals generated have an inbuilt mechanism to get validated.
Disadvantages of Keltner channel indicator
Keltner Channel indicator is sensitive to react and so it generate false signals. However, generation of false signals can be mitigated by use of other indicators or price action with it.
Signals generated by indicator are at times late and therefore reduce the profit generated.
Conclusion
Keltner channels indicator is an ATR based indicator that gives visual insight into the volatility of the market. Based on various signals generated by the indicator, we can identity dynamic support and resistance. We can also identify and trade breakout along with other valuable information as discussed above.
Thanks for your input. My pleasure 😃