Trading Crypto with Aroon Indicator- Crypto Academy / S5W2 - Homework Post for @fredquantum.
Hope you are all doing well. we are in week 2 season 5 of Cryptoaacademy. Today I am writing homework task for professor @fredquantum which is about AROON INDICATOR.
Aroon indicator is a part of Aroon trading system that was developed by Tushar Chande in 1995. Aroon trading system refers to Aroon up, Aroon Down and Aroon oscillator. The name Aroon is not related to creator of indicator but has its roots in sanskrit language. The word "Aroon" Is a sanskrit one word substitute for "dawn's early light". We know that dawn's early light marks begining of new opportunities to explore during the day. Indicator has been named in the same context.

What is Aroon Indicator in your own words? What are Aroon-Up and Aroon-Down? (Show them on Chart).

Aroon indicator is a technical analysis tool that is used by trend following traders to detect direction of trend , strength of trend by analysing extremes of price (highs and lows) made by an asset over a specified period of time. Aroon indicator is composed of two lines of variable colour named Aroon Up and Aroon Down line.
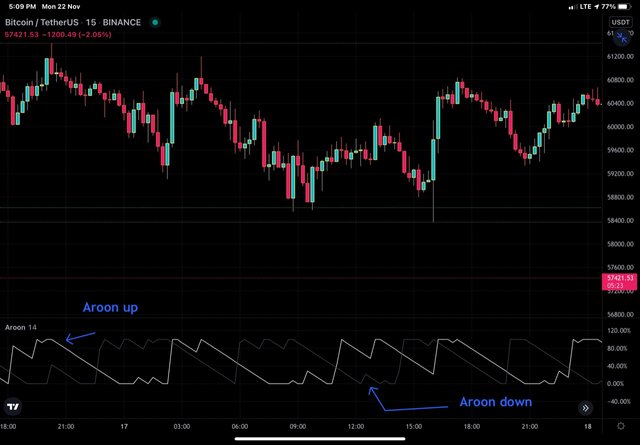
BTC/USDT chart from trading view app
In the chart above, Aroon indicator is applied to BTC/USDT chart . Aroon up and Aroon Down lines have been Labelled and differently colored.
Aroon UP line as the name implies quantifies the strength of uptrend and Aroon Down line quantify the strength of downtrend. An arbitrary range between 0 to 30 is considerd as weak trend and value between 70 to 100 is considerd as strong trend. The analogy that can be drawn from the price chart is that the strong trends are followed by continuous price patterns. Strong uptrend will form higher highs and strong down trend will form lower lows.
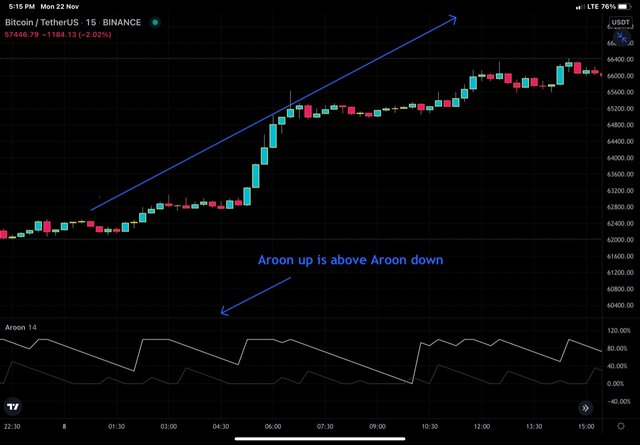
BTC/USDT chart from trading view app
In the chart above, Aroon up is above Aroon down line and we can see on price chart that trend is bullish.
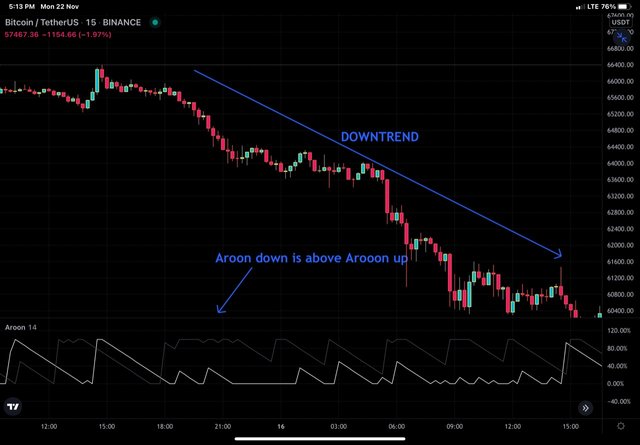
BTC/USDT chart from trading view app showing bearish trend
In the chart above, Aroon down is above Aroon UP line and we can see on price chart that trend is bearish.
Another aspect of Aroon indicator is that of crossover between Aroon Up and Aroon Down lines. Crossovers are significant as they provide signal about change in the trend and therefore generate buy and sell signal for the trend following traders. When Aroon Up line crosses Aroon Down line from below upwards. It signals forthcoming bullish trend and is therefore perceived as buy signal. On the other hand, when Aroon Down line crosses Aroon up line from below upwards, it indicates the forthcoming bearish trend and is therefore perceived as sell signal by the traders.
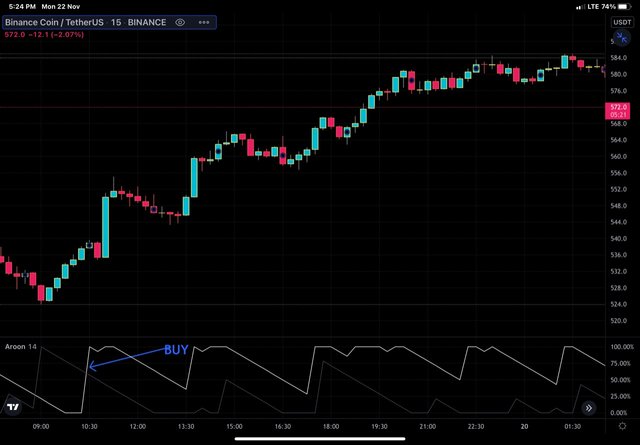
BNB/USDT chart from trading view app showing crossover
In the chart above, Aroon UP crosses Aroon DOWM line from below upwards and gives Buy signal. We can see a classic bullish trend thereafter
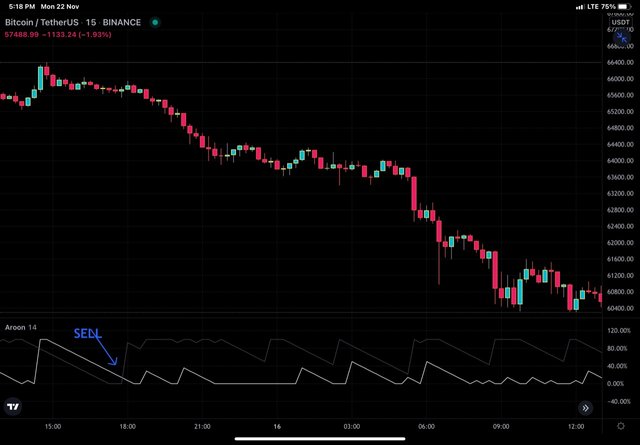
BTC/USDT chart from trading view app showing crossover
In the chart above, Aroon DOWN crosses Aroon UP line from below upwards and gives Sell signal. We can see a classic bearish trend thereafter

How is Aroon-Up/Aroon-Down calculated? (Give an illustrative example).

Let's begin with formula for Aroon UP and Aroon Down. Presuming period of Aroon indicator to be 25.
Aroon UP = 25 - Period since last 25 period high divided by 25 multipled by 100
Aroon DOWN = 25 - Period since last 25 period Low divided by 25 multipled by 100
Let me give an example to explain calculations.
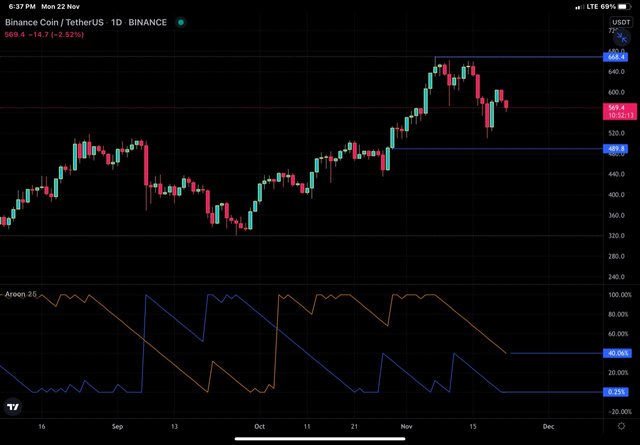
BNB/USDT chart from trading view set over 1 day timeframe
For calculating Aroon up, we have to calculate number of periods since last period high. In case above, we can see there are 15 periods since last high. Substitute the value in above formulla :
Aroon Up = 25 - 15 / 25 x 100
Aroon Up = 1000/25 = 40
We can see In the chart above, that Aroon up is 40 (ignoring decimals)
For calculating Aroon Down, we have to calculate number of periods since last period Low. In case above, we can see there are 25 periods since last low. Substitute the value in above formulla :
Aroon Up = 25 - 25 / 25 x 100
Aroon Up = 1000/25 = 0
We can see In the chart above, that Aroon up is at 0 (ignoring decimals)
Let's take other scenario to understand Aroon indicator.
- If current period is the highest of the 25 periods, than
Aroon up = 25 - 0 /25 x 100 = 100
- If current period is low of the last 25 periods, than Aroon Down = 25 -0/25 x 100 = 100

Show the Steps involved in the Setting Up Aroon indicator on the chart and show different settings. (Screenshots required).

I'll be using trading view app. You can do it from official website of trading view too. I launched trading view app.
Select any trading pair. Chart of the pair will load.
Click on indicators from the top menu. In my case, i have Indicators option at bottom of the chart.
Next we type Aroon in the search box provided and select same Indicator from the suggestions. Go back to your chart and you will find indicator loaded at bottom of your chart.
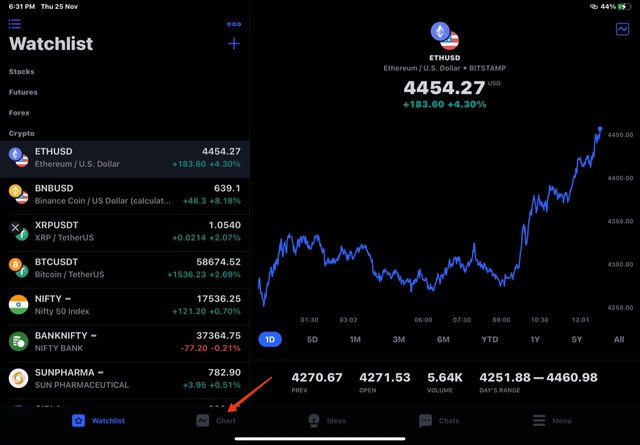
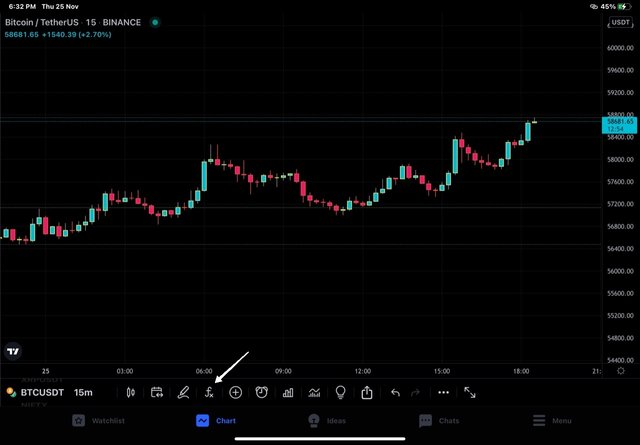
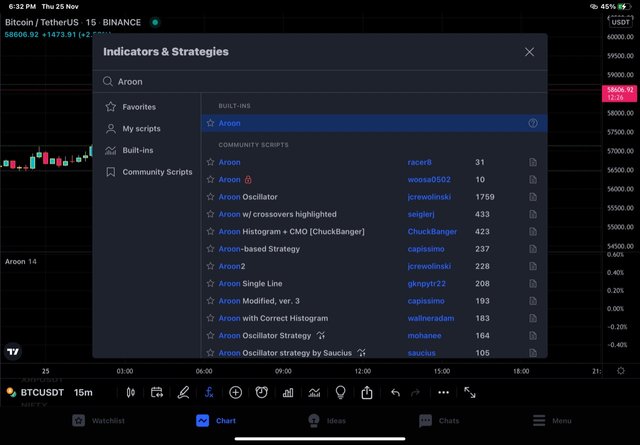
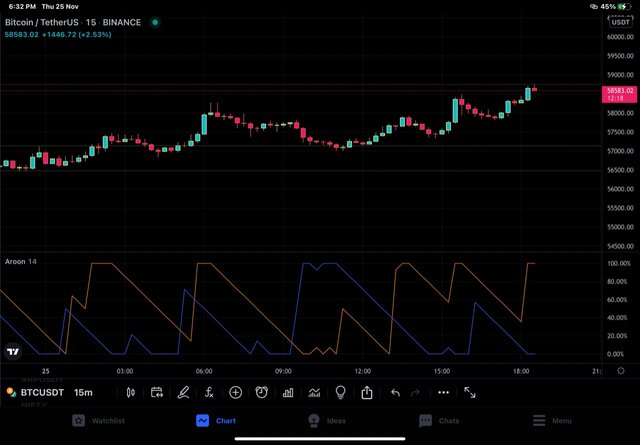
Configuration of the Aroon Indicator.
Double click on Indicator and chart settings will load.
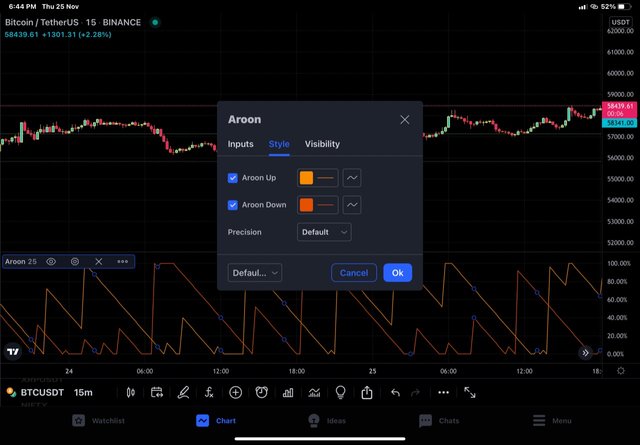
Style settings: Here we can choose color and precision of indicator, Let's choose 2 different colors for two indicator lines.
In the Inputs settings, we have indicator timeframe and length. Default lenge is 14 periods. I changed it to 25 periods.
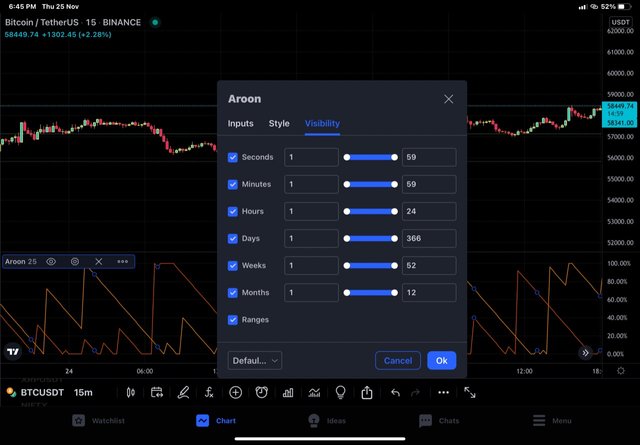
In the visibility, we have seconds , minutes, hours, days, weeks, months. Let's keep default settings for visibility.
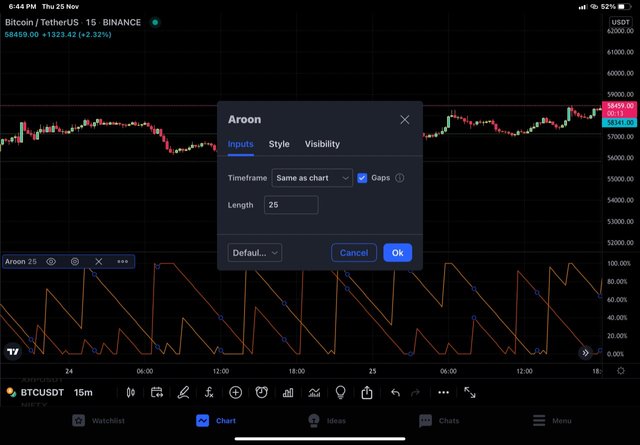

What is your understanding of the Aroon Oscillator? How does it work? (Show it on the chart, kindly skip the steps involved in adding it).

Aroon oscillator is a part of Aroon trading system. It is based on Aroon indicator and uses Aroon up and Aroon down line to generate an oscillating line that quantify the strength of trend and continuity of the trend. Being an oscillator, there has to be a mean and two extremes for it to oscillate. The mean value in case of Aroon oscillator is zero and two extremes are 100 and -100. So we can simply say that Aroon oscillator is a trend following indicator that oscillates between - 100 to 100. Aroon oscillator has following messages to convey:
Values above zero point towards bullish trend and values below zero, points towards bearish momentum.
Higher the positive value, stronger is the uptrend. Higher the negative value, stronger is the downtrend.
Crossing over of zero line by oscillator from above downwards, indicates forthcoming bearish trend and crossing over from below upwards, indicates forthcoming bullish trend.
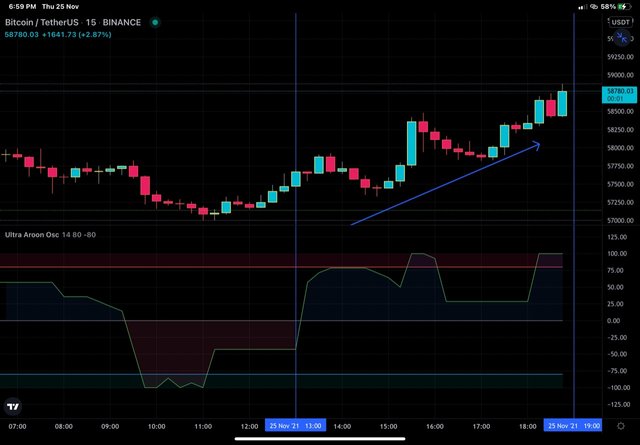
BTC/USDT chart from trading view, showing Aroon oscillator above zero line and subsequent bullish trend
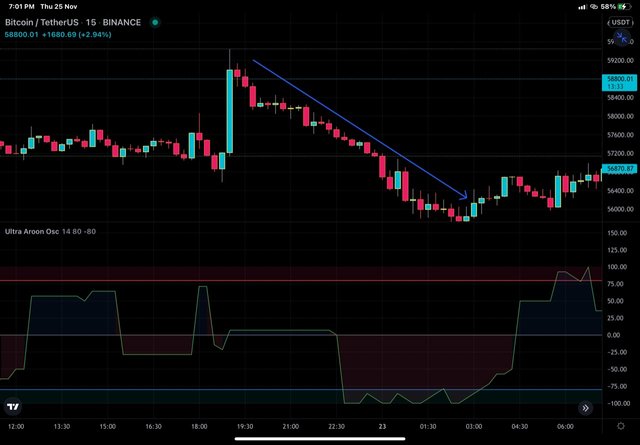
BTC/USDT chart showing Aroon oscillator below zero line and bearish moments on chart
Calculation of Aroon Oscillator.
Aroon Oscillator = Aroon Up - Aroon Down
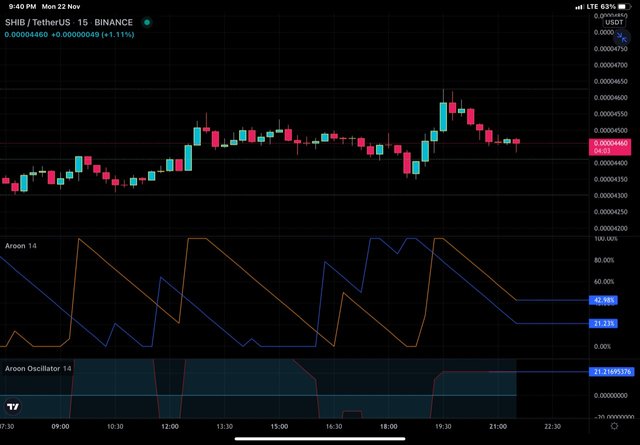
BNB/USDT chart with Aroon indicator and Aroon oscillator
In the chart above, I have applied both Aroon indicator and oscillator to the chart . We can see that Aroon up is 42.98 and Aroon Down is 21.23 . We know that, Aroon oscillator is obtained by subtracting Aroon up from Aroon Down. So Aroon oscillator is 42 - 21 = 21 (ignoring decimals) . So that's exactly there on chart.

Consider an Aroon Indicator with a single oscillating line, what does the measurement of the trend at +50 and -50 signify?

Aroom indicator with a single oscillating line is analogous to Aroon oscillator. For a single oscillating line, there is a mean position formed by zero line and above zero movement of oscillator would mean bullish trend and below zero line would indicate bearish zone.
+/- 50 value of oscillator would form a sort of golden zone because movement above +50 would indicate a strong bullish trend and is therefore a signal to bag huge bucks for traders in buy trade. Similarly, movement below -50 would indicate strong bearish momentum and is a good news for traders in short trade.
But we know that no trend continues forever in one direction , it has to reverse the direction at some point. Usually the strong trends are soon followed by reversal of price action and therefore traders have to be cautious about that too.
In the chart above, movement of oscillator above 50 shows a bullish momentum and is soon followed by reversal. In the chart above, movement of oscillator below 50 shows a bearish momentum and is soon followed by reversal. Ranging markets or choppy markets are those where there is no trend in the market. Range markets as the name implies refer to price of an asset within a range unlike trending market. We know that, during a trendimg market, price keeps on increasing (uptewnd) or decreasing (downtrend) but in ranging market, price moves within a zone. We can say that there is indecision in the market or market is consolidating. The Aroon indicator in addition to indicating trend, also makes a defnite pattern of movement during ranging markets. During range or consolidation, Aroon UP and Aroon DOWN line moves parallel to each without crossing over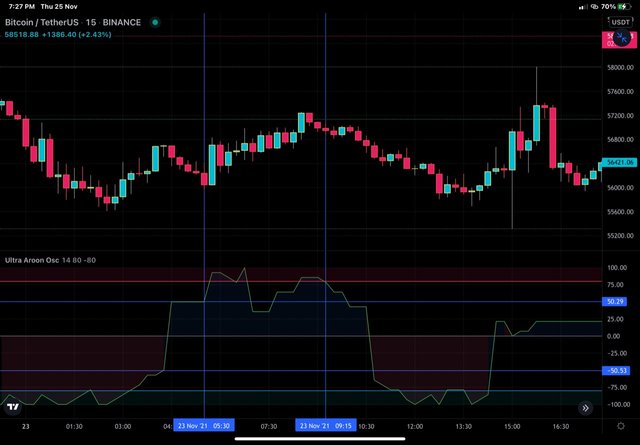
BTC/USDT chart
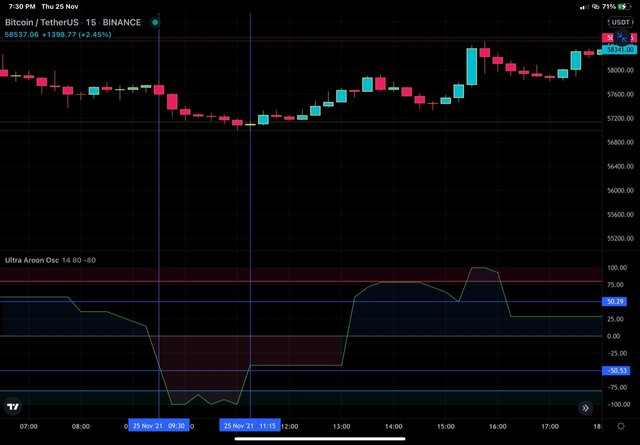
BTC/USDT chart

Explain Aroon Indicator movement in Range Markets. (Screenshot required).

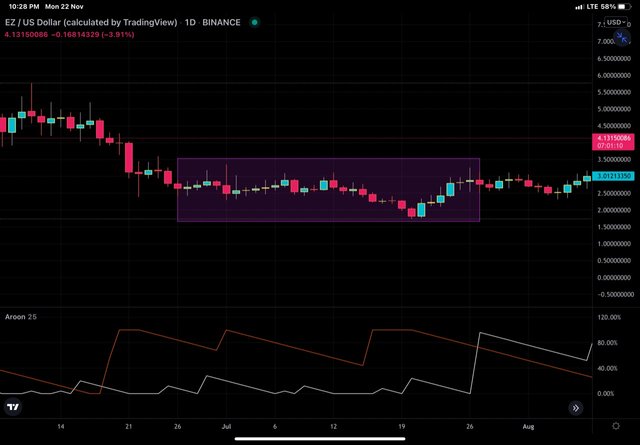
EZ/USD chart
In the chart above, we can see that.Ez price has consolidated in a zone after coming down. We can see that Aroon UP and Aroon Down lines are moving parallel to each other without crossover till the time bullish trend started and that is shown as crossover of Aroon up above the Aroon Down. During consolidation, Aroon Down is above Aroon up because market has consolidated after coming down. It is worth mentioning here that, ranging markets are always followed by trend. So it is always a potential zone for traders to keep track on as it culmimates always in a fruitful signal to long or short the market. That emphasises the significance of Aroon indicator in ranging market.

Does Aroon Indicator give False and Late signals? Explain. Show false and late signals of the Aroon Indicator on the chart. Combine an indicator (other than RSI) with the Aroon indicator to filter late and false signals. (Screenshots required).

No indicator is absolute and same holds true for Aroon indicator as well. It is true that Aroon indicator gives false and late signal sometimes and therefore it has to be combined with some other indicator as well as the price action to filter out these erroneous signal. As mentioned earlier, the indicator is based on previous high or low and so it is a lagging indicator. It is not uncommon to see that , the actual time at which action should have been taken for maximum benefit has elapsed when the indicator generates the signal. Let's take real examples :
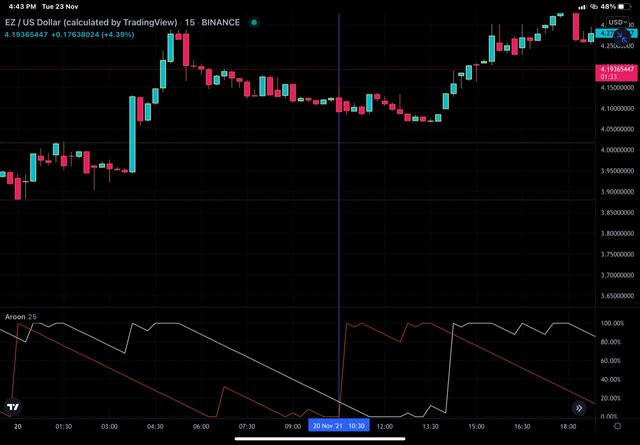
In the EZ/USDT chart above, we can see that crossover of Aroon DOWN from below upwards to generate SELL signal has taken place by the time price has already moved down significantly and that is the classic example of late signal.
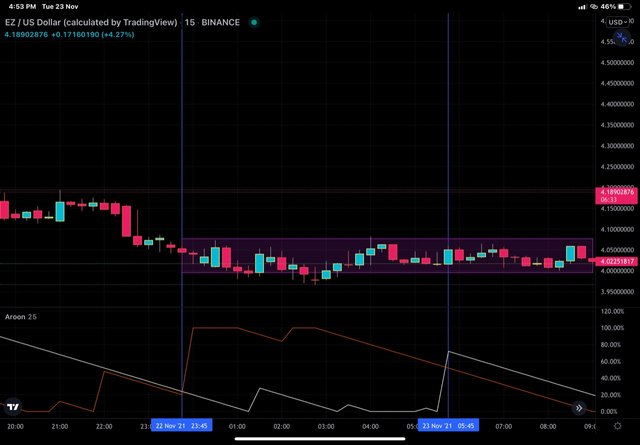
In the chart above, we can see that Aroon indicator generated buy signal by crossover but there was no bullish momentum in the market . And than it generated sell signal when there was no bearish momentum in the market. So those are false signals.
Use of ADX with Aroon Indicator.
Average directional index (ADx) is a non directional index used to measure strength of trend. It can be used with Aroon indicator to filter erroneous signals .
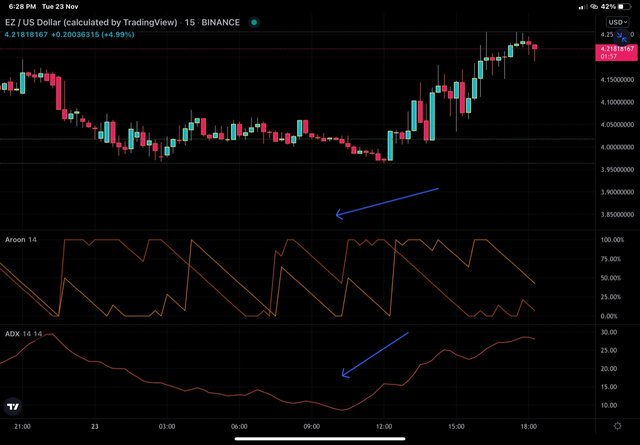
In the chart above, the Aroon down crossed Aroon up and is therefore a sell signal and the steep movement of Aroon Down gives perception of strong downtrend. However , as per ADX strength of trend is week and that is true . Therefore, simultaneous use of both would help in filtering late and false signals.

Place at least one buy and sell trade using the Aroon Indicator with the help of the indicator combined in (7) above. Use a demo account with proper trade management. (Screenshots required).

Sell trade on the basis of Aroon and ADX indicator .
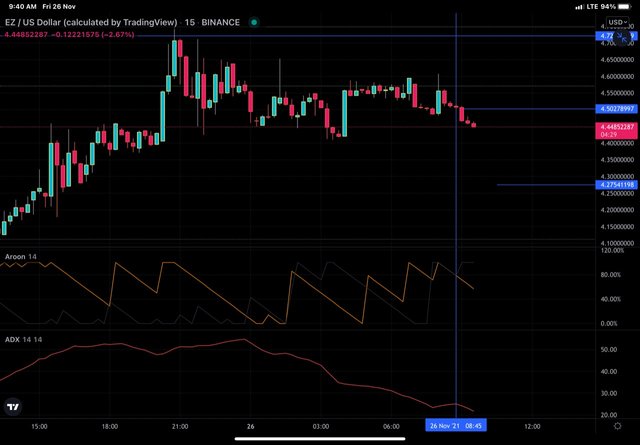
Entry
TP hit
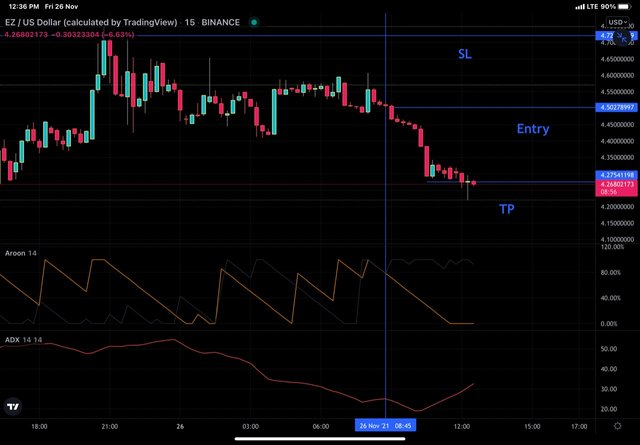
In EZ/USD Chart, Aroon UP crosses Aroon Down from above downwards and gives sell signal. At the same 5ime ADX indicator shows decreasing strength of uptrend and increasing downtrend . We have double confirmation for sell trade. We placed sell order ar EZ price of 4.50$ and set SL at 4. 72 $ and SL/TP ration of 1:1 . So TP was set at 4.27$. We can see that trade progressed as expected and hit TP.
Buy trade on the basis of Aroon and ADX.
Entry
TP hit
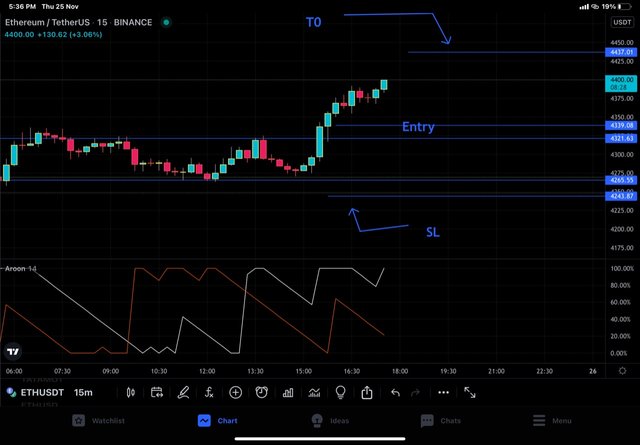
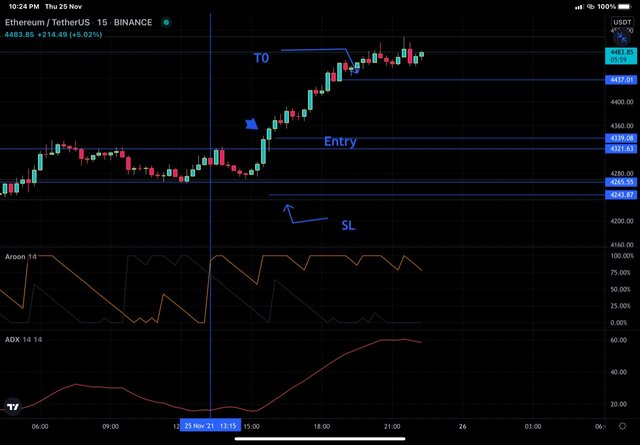
In ETHUSD Chart, Aroon UP crosses Aroon Down from below upwards and gives buy signal. At the same time, ADX indicator shows increasing strength of uptrend and decreasing downtrend . We have double confirmation for buy trade. But subsequent We saw slight dip in the price , so entry was not immediately activated. We wait for bullish momentum untill a green candle gave closing above important level. We took entry at next green candle where ADX also begin increasing and we placed buy order at ETH price of 4339.08 when second green candle is formed after closing above important level marked at $ 4121.63 . We set SL 4242.87 ( below important level) and SL/TP ration of 1:1 . So TP was set at $4437.01. We can see that trade progressed as expected and hit TP

State the Merits and Demerits of Aroon Indicator.

Merits of Aroon indicator
Aroon indicator is simple to understand and use.
Aroon indicator works well in trending market.
Aroon indicator doesn't obscure the view of price chart unlike overlay indicator.
Aroon indicator is configurable aa per trader experience and trading style.
Demerits of Aroon indicator.
It is a lagging indicator and generatea signals late.
Just like other indicator, it generates false signals as well.
It cannot be used solely. Support of other indicators and price action is needed.

Conclusion

Aroon indicator and Aroon oscillator form Aroon trading system. Either of these indicators are used in trending market to detect direction and strength of trend. These indicators are simple to use and when used with other indicatora or price action can serve as potential tools for tradovide valid signals to materialise.
Congratulations Dr. Your post is in the list of top three posts of the week.
Keep it up...
Thank you and same to you. You topped the top 😂.