Supertrend Indicator - Crypto Academy /S5W7-Homework Post for kouba01
Hope you are all doing well and so am I. We are gradually learning new concepts in the academy . Thanks to all the professors. Today I am writing homework task for professor @kouba01 which is about "Supertrend Indicator".
Show your understanding of the SuperTrend as a trading indicator and how it is calculated?
Trend refers to direction of price of an asset, whether increasing or decreasing. If price is increasing we say that asset is in uptrend and if the price of asset is decreasing, we say that an asset is in downtrend. The sole purpose of trading, that is to earn money, is attained during trending markets. So the sole purpose of trading is fulfilled, if we are able to ride a trend. As such the price action itself gives a clear cut understanding of trend but certain indicators have been developed to provide more detailed information about trend by combining various parameters and Supertrend indicator is one among them.
Supertrend indicator as the name implies is a trend finding indicator developed by Olivier Seban by making use of volatility indicator Average True range over specified period of time. Based on placement of the indicator on chart , its color change and price, the indicator generates signals to materialise the trends. So this trend trading indicator generates signals that help traders ride trends and maxmise profits.
When applied to chart, the supertrend indicator is like a continuous line of either green or red color. Green color is shown during uptrend and red color during downtrend. The indicator acts as support during uptrend and resistance during downtrend. Besides support and resistance, traders use it as trailing stoploss in trending markets as well. The details of these individual properties shall be discussed in seprare parts of this task.
Calculation of Supertrend Indicator
As mentioned above, the supertrend indicator is based on Average True Range indicator of variable period and a multiplier. To be specific, the formullae are :
Supertrend Upper line (Red Line) = (HIGH + LOW) / 2 + Multiplier * ATR
Supertrend Down Line (Green Line) = (HIGH + LOW) / 2 – Multiplier * ATR
Calculation of Supertrend UpLine (RedLine)
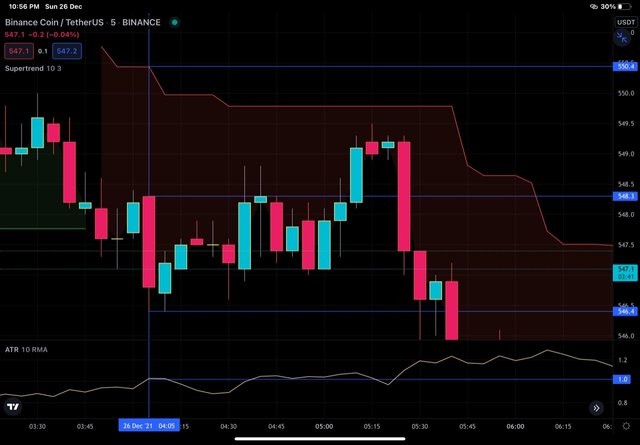
BNB/USDT chart from tradingview
In the chart above, I applied supertrend indicator and ATR indicator. One thing to be taken care of here is that the ATR indicator must have same setting within the supertrend and that applied Seprately. So the default period of ATR applied below the chart has to be changed from 14 to 10 period. Once done, than proceed to calculation. I'll calculate value of supertrend indicator for a candle marked with a vertical line. For that particular candle, we have following values :
High = 548.3
Low= 546.4
ATR = 1.0( for 10 periods)
Multiplier = 3
Applying above mentioned formula for red line :
Supertrend UpLine (Red Line) = (HIGH + LOW) / 2 + Multiplier * ATR
Red Line = (548.3 + 546.4) / 3 +3 x 1
Red Line = 1094.7/2 + 3 = 547.35 + 3 = 550.3
That is exactly there on the chart.
Calculation of supertrend DownLine (Green Line)
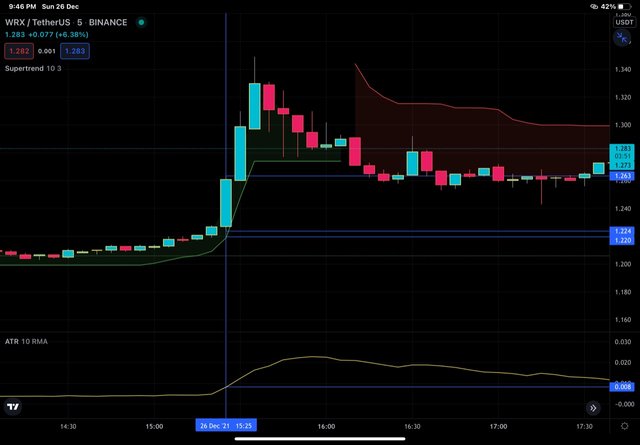
WRX/USDT chart from tradingview
In the chart above, I applied supertrend indicator and ATR indicator. One thing to be taken care of here is that the ATR indicator must have same setting within the supertrend and that applied Seprately. So the default period of ATR applied below the chart has to be changed from 14 to 10 period. Once done, than proceed to calculation. I'll calculate value of supertrend indicator for a candle marked with a vertical line. For that particular candle, we have following values :
High = 1.243
Low= 1.224
ATR = 0.008 ( for 10 periods)
Multiplier = 3
Applying above mentioned formula for green line :
Supertrend Down Line (Green Line) = (HIGH + LOW) / 2 – Multiplier * ATR
Green Line =( 1.243 + 1.224) /2 - 3x 0.008
= 2. 487/2 - 0.024 = 1.244 - 0.024 = 1.220
That is exactly there on the chart.
What are the main parameters of the Supertrend indicator and How to configure them and is it advisable to change its default settings? (Screenshot required)
As discussed above, the supertrend indicator is based on two main parameters - ATR and Multiplier.
Average True Range
ATR stands for average true range. So we can say that, it is average of True Range. Therefore, to calculate the ATR, we will first have to calculate the true range and then take the average of the true range values over a specified period of time and that will give ATR for that period.
True Range : For TR , we have to do some calculations and of those calculations, the one that is higher is the actual value of TR. The calculations are :
- Current high minus current low
- Current high minus previous close
- Current low minus previous close
From the above calculations, we would get different values and whichever value of theae three is higher, that will be the TR.
Suppose the period of observation is 14 days, we need to calculate TR for each period as per above formulae, than take average of those values and that would be ATR for that period. Once the above calculation is made, further calculations are simplified by using following formula.
Current ATR = ((Prior ATR x 13) + Current TR) / 14.
Multiplier
It is a numerical value to which ATR is multiplied to get the value of supertrend indicator. For green line, the multiplier times ATR is subtracted from mean of high and low while as for red line, multiplier times ATR is added to mean of high and low to obtain supertrend indicator value.
Configuration of settings
Supertrend indicator is although simple but is versatile indicator for multiple reasons and one such being its flexibility to work in all time frames. As a matter of common understanding, settings won't remain same for all time frames and there is nonhard and fast rule for its settings. it is advisable to change its settings as per trading style.
The default setting for ATR period is 10 and multiplier is 3 . However, a trader has to customise the settings as per their own trading strategy. For example, a scalper can customise the indicator to lower period and multiple and take or exit position at every signal but a swing trader cannot work with same settings.
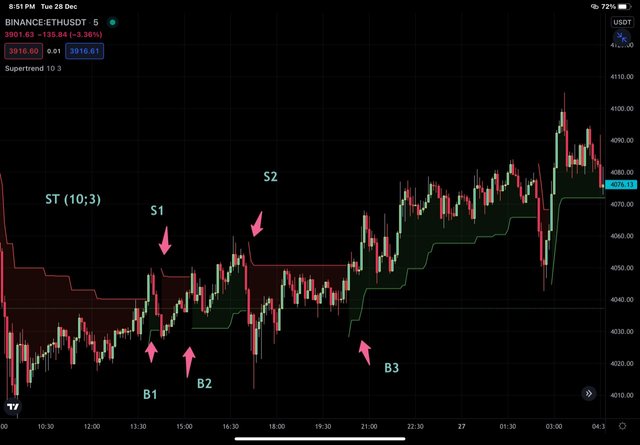
ST (10 , 3) , S1 and S2 represent two sell signals and B1, B2 and B3 are three buy signals. These signals are ideal for scalper as chart is set over 5 min frame and indicator is generating entry /exit within few candles
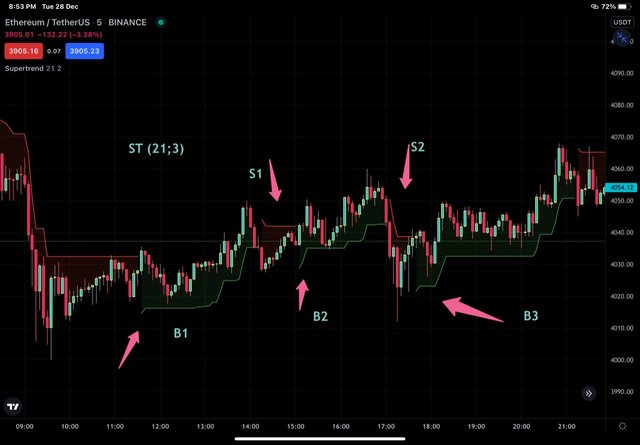
ST (21, 2) , as compared to ST (10 , 3) buy and sell signals are more appropriate as for time of signals is concerned.
Signals generated in both the settings above would matter more for scaalper than swing trader as later category hold trades long . So customisation of settings cannot be generalized but has to be individualized
Based on the use of the SuperTend indicator, how can one predict whether the trend will be bullish or bearish (screenshot required)
The supertrend indicator was introduced to guide the traders action through trending markets. Besides providing information about the current trend, the indicator help traders to maintain their position by continuing in particular direction and maintaining color. The exit or reversal signals are generated by change in directon and color of the indicator.
The general orientation of supertrend indicator is such that, during an uptrend it acts like a dynamic support line below the price and during downtrend the indicator acts like a dynamic resistance above the price. Whether the price of an asset is increasing or decreasing,that represents a state of volatility of the Asset under consideration and therefore the indicator is projected upwards during increase in price and downwards during decrease in price. As the volatility of the asset decreases or in other words we can say that if the asset is consolidating with in a particular zone, during that phase the indicator is oriented horizontally.
In majority of the cases, the market structure is such that an uptrending or downtrendimg market is followed by Consolidation before it undergoes reversal. Occasionally It is seen that an uptrending market is directly followed by reversal of the price action. Therefore, in majority of the cases, we can see that an upwards or downwards projecting indicator is followed by horizontal line before change in direction. Reversal is market by change of the colour and direction of the indicator.. A new trend is marked by jumping of the indicator to start position and change of color and than continuing in the direction of price.
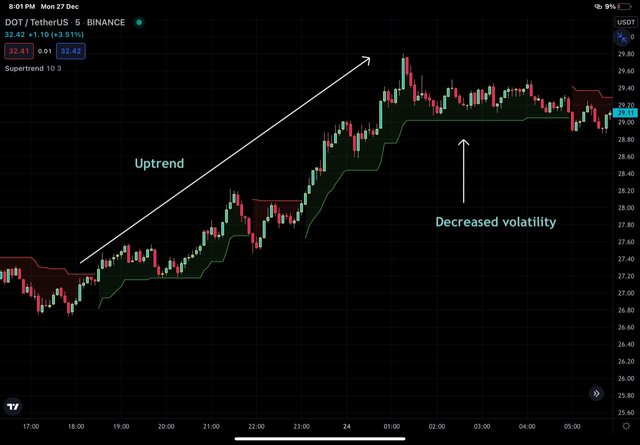
In the chart above , we can see that during uptrend , the supertrend indicator is green in color and is projected upwards in the direction of price.Towards the top , we see consolidating price action of a DOT is followed by a horizontal line below the price line. Now let me clarify it further with the help of another chart given below
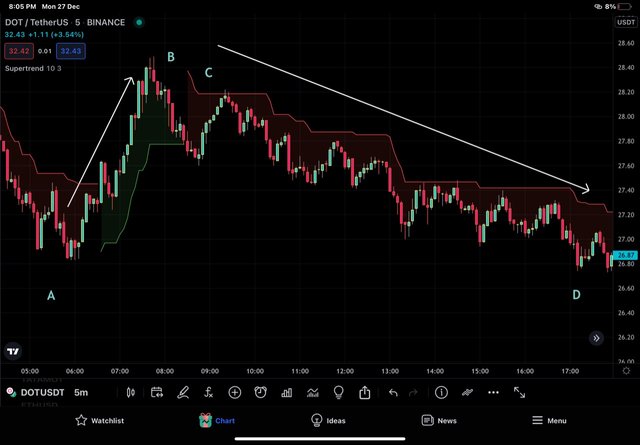
In the above chart, I have taken a specific portion of uptrend from A to B followed by a downtrend from C to D. During a short uptrending period from A to B, the indicator is located below the price line as a green line and then the indicator jumps to the position C and change its colour to Red and is then projected downwards in the direction of the price towards point D. From the above chart it is clear that supertrend acts as a support and is placed below the price line during uptrend and then change the colour and its direction and orientation during downtrend to a red coloured line placed above the price line and projected downwards
Explain how the Supertrend indicator is also used to understand sell / buy signals, by analyzing its different movements.(screenshot required)
The ideal time to materialse a trend is to be able to ride a trend from the beginning. However, it is not possible to catch a top or bottom. But with experience we should learn to enter at the beginning of the trend. Same can be achieved with the help of supertrend indicator by looking at the orientation of the indicator with respect to the price . IF we find the indicator and the price showing opposite directions, it indicates that the trend is anticipated to be reversed and one must wait for the confirmation of the signal to enter at proper position.
if the indicator is showing uptrend (green line) and is projecting up but the price of an asset is going down, we should wait for the the reversal to happen and enter into buy position when price and Indicator synchronise.
The buy signal is generated by the indicator when the green line crosses below opening of of bullish candle and sell signal is generated when the red line crosses above the closing of bearish candle.
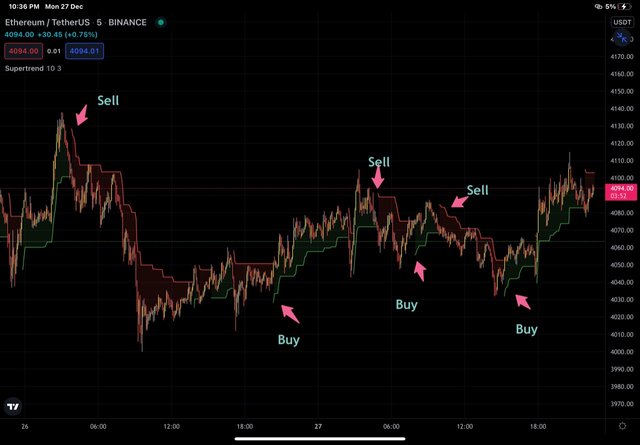
In the DOT/USDT chart above, I have marked multiple levels with buy/sell signals based on the above mentioned principle of buy at green indicator and sell at red indicator. From the above chart, it is clear that, we are able to take advantage of most of the market movements.
How can we determine breakout points using Supertrend and Donchian Channel indicators? Explain this based on a clear examples. (Screenshot required))
Combination of Supertrend and Donchain channel indicator is useful in breakout trading. Donchain channel was introduced by Richard Donchain by taking into account high and low price of an asset for a particular period. The channel is formed by area between the two prices mentioned. A trader choose number of periods as per their own experience and strategy. Here I'll combine a 20 period Donchain channel with supertrend indicator to help in trading breakouts. The basic rules for taking any position are as below ;
For buy position, supertrend indicator must be in green and placed below the price line. To trade the bullish breakout, price line must breech the upper line of Donchain channel. To confirm breakout, a trader must wait for at least 2 candles to pierce the upper line and than take buy position.
For Sell position, supertrend indicator must be like a red line placed above the price line. To trade the bearish breakout, price line must breech the lower line of Donchain channel. To confirm breakout, a trader must wait for at least 2 candles to pierce the lower line and than take sell position.
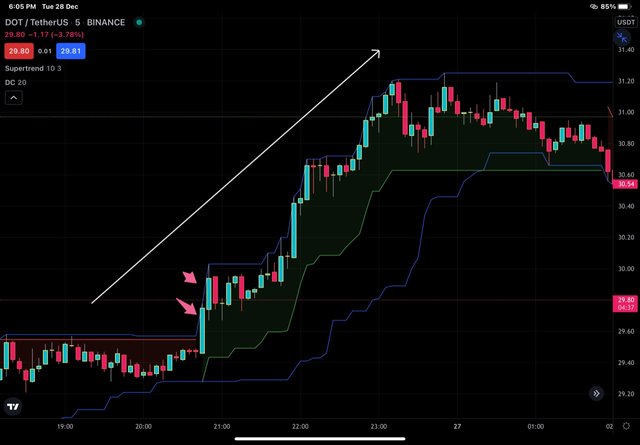
In DOT/USDT Chart above, upper line of Donchain channel is pierced by two bullish candles marked with two arrows predicting bullish breakout and hence buy signal. The bullish rally of price that follows validates the authenticity of breakout.
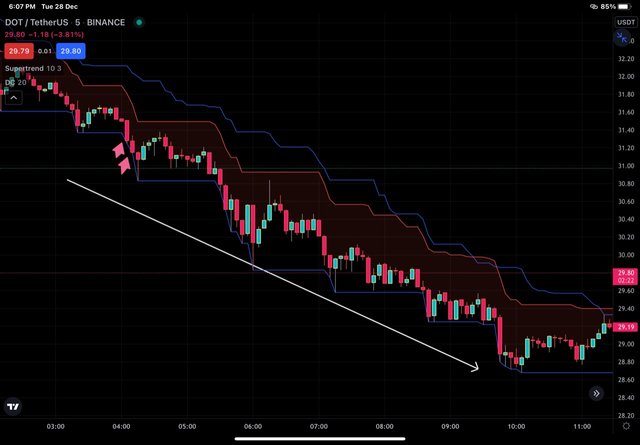
In DOT/USDT Chart above, lower line of Donchain channel is pierced by two bearish candles marked with two arrows predicting bearish breakout and hence sell signal. The bearish rally of price that follows validates the authenticity of breakout.
Do you see the effectiveness of combining two SuperTrend indicators (fast and slow) in crypto trading? Explain this based on a clear example. (Screenshot required))
Combining two supertrend indicators is analogous to use of two different moving averages. We are aware of the advantage of combining a slow moving average with a fast moving average. The ST indicator combination follows the same principle. We use a slow moving and fast moving ST combination to be double sure about the generated signal. Let's suppose, we make use of ST (21, 2 ) and ST(10, 3)
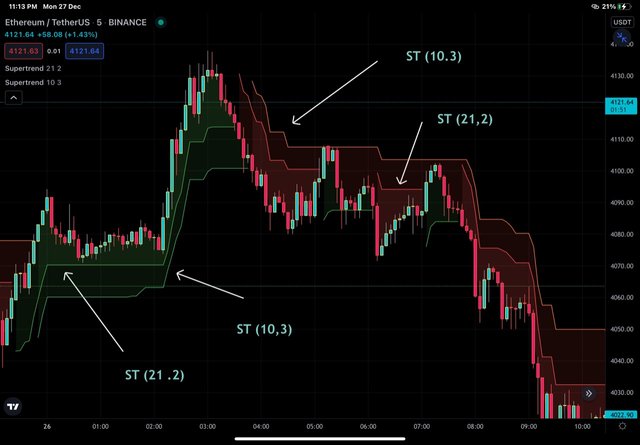
ST (21, 2) and ST(10, 3) applied to the chart
The general principle of signal generation is that, when the fast curve crosses the slow curve from below upwards and both are projected upwards, a buy signal is confirmed. Similarly, we exit the position when the fast curve returns under the slow curve, exit signal is confirmed.
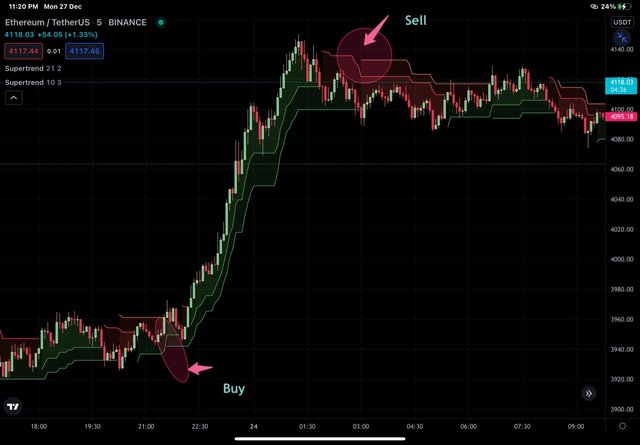
ETH/USDT chart with double ST
In the chart above, I have labelled buy and sell at the crossover of two STs as per above mentioned principle.
Is there a need to pair another indicator to make this indicator work better as a filter and help get rid of false signals? Use a graphic to support your answer. (screenshot required)
No indicator is 100% accurate as for signal generation is concerned. So combination of indicator is always fruitful to authenticate the signals generated and filter out false signals generated. Supertrend indicator can be used with other indicators like parabolic SAR, MACD, RSI, MAs etc to filter out false signals.
I'll be using RSI (Relative Strength Index) in combination with supertrend indicator to filter out false signals. RSI is used to measure whether an asset is overbought or oversold and thereby help traders in spotting buy/sell signals. Its value ranges between 0 and 100 and a mean by default is 50. If the RSI is above 50 , it is considered as bullish or upward trend. If RSI is below 50, it is considerd as bearish or downward trend. For spotting overbought and oversold signals, values have been changed to 30 and 70 (Mean +/- 20) . If RSI is above 70 , it indicates that an asset is overbought and if it is below 30 , it signifies that an asset is oversold. Syncing of signal by supertrend and RSI can be used as a double check for opening any position and filter erroneous signals generated.
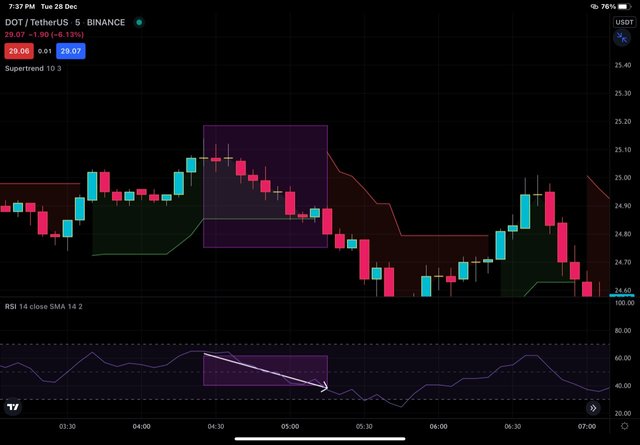
in the chart above, for rectangular part of price line the supertrend indicator continues to be green while RSI is showing bearish trend . Price is actually decreasing for the same period. So false signal generated by supertrend is filtered with the help of RSI.
List the advantages and disadvantages of the Supertrend indicator:
Advantages of Supertrend Indicator.
The indicator is simple to understand. As it involves only a single line like moving average, there is nothing complex in it.
The indicator can be used on any timeframe subjected to customisation and user experience.
With the help of ST, traders can take advantage of trends in the market and bag good amount of bucks.
Disadvantages of Supertrend Indicator.
Supertrend indicator generates signals a bit late and therefore lesser profits.
It generates many false signals especially on smaller periods.
ST is not useful in ranging markets. It is versatile in trending markets.
Conclusion
Supertrend indicator is a trend finding indicator based on ATR that gives fair understanding of market direction and anticipates future movement. When used in combination with other indicators and price action, it gives fair understanding of market and generates valid signals to materialise.
All the charts used in app represent my original work and have been taken from tradingview app.