Steemit Crypto Academy Season 5 [Advanced Course] Week 4 - Trading Crypto with On-Balance Volume Indicator
Hello dear friends, hope you are all fine and doing well. Today I am writing homework task for professor @fredquantum which is about On Balance Volume Indicator

In your own words, explain your understanding of On-Balance Volume (OBV) Indicator.

On-Balance Volume indicator is a volume based leading technical indicator developed by Joseph Granville in 1963. The indicator predicts the direction of price of an asset based on the volume of asset traded over a specificied period of time. We can say, OBV measures buying and selling pressure on the basis or volume. If buying volume is more, price of an asset will go up. On the other hand, if selling volume is more, it would push the price of an asser up.
We can say that as per OBV , price is a function of volume. Based on this statement, it is easier to understand the cumulative nature of OBV with respect to volume. If price of an asset for the day is higher 5han previous day, OBV gives an impression that volume should have been higher during the day that has resulted in giving closing price higher than previous close and so the volume is added to previous OBV. However, the reverse is seen during a day that gives closure lower than previous close and so the volume is subtracted from previous OBV.
For further clarification, I'll put forth some generalised facts about volume - price correlation.
If price is increasing and volume is also increasing. It means that there is good buying pressure or trader interest in particular asset. Traders are willing to pay even higher prices and that results in uptrend.
Price is decreasing and volume is increasing, it means that there is a good selling pressire in the market. it means that traders are selling even if they get lower price and that pushes price further down and results in downtrend.
Price is increasing but volume is not increasing - Early sign of reversal. As volume determines price. Since volume doesn't increase, price cannot sustain itself and so will fall.
Price is increasing but volume is decreasing - indicates that there is decreasing buying pressure or traders are not interested in buying.
Price is decreasing and volume is also decreasing - indicates that traders are not interested to sell the assets or selling pressure is low despite failing price.
So the above points will help us understand the reason of volume price correlation as per OBV to predict trends, confirm trends, confirm breakouts and advanced breakoits, predict trend changes on the basis of divergence. We shall see each of these features separately during subsequent sections.

Using any charting platform of choice, add On-Balance Volume on the crypto chart. (Screenshots required).

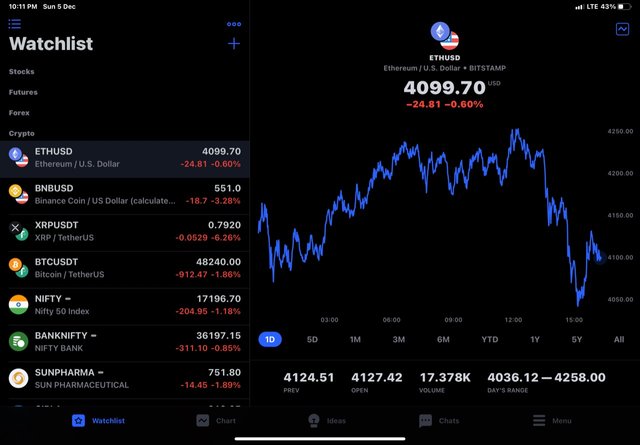
Fo4 this task, I'll be using trading view app. You can do it from official website of trading view too. I launched trading view app.
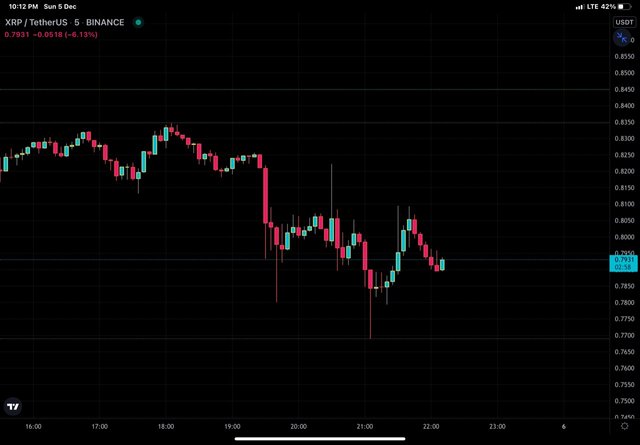
Select any trading pair. Chart of the pair will load.
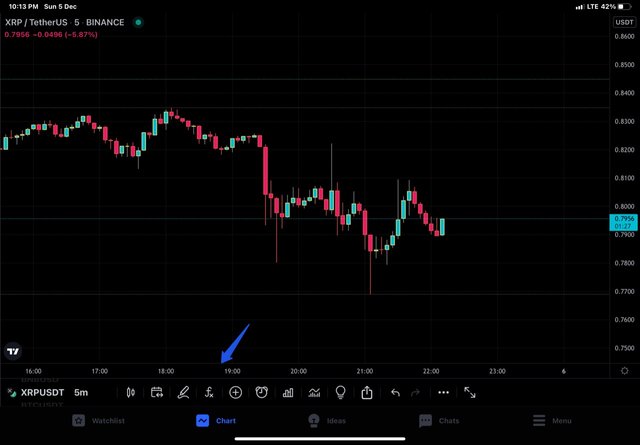
Click on indicators from the top menu. In my case, i have Indicators option at bottom of the chart.
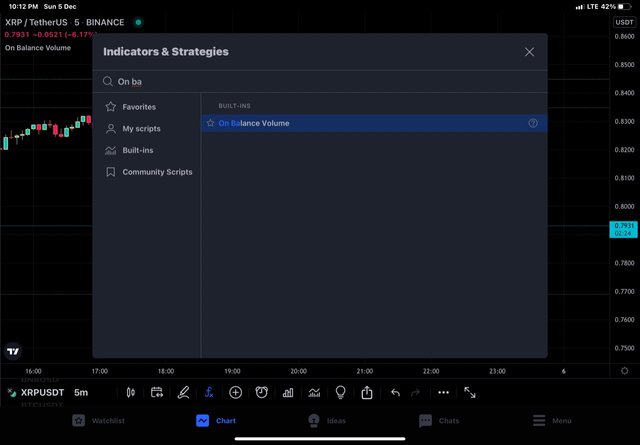
Next we type "On balance Volume" in the search box provided and select same Indicator from the suggestions.
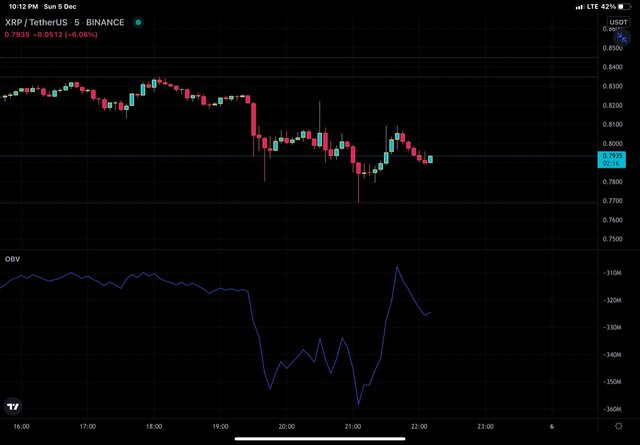
Go back to your chart and you will find indicator loaded to the chart.
center>

What are the Formulas and Rules for calculating On-Balance Indicator? Give an illustrative example.

Calculation of OBV.
OBV determines whether the volume is favouring the trend or not. Formulae are given below.
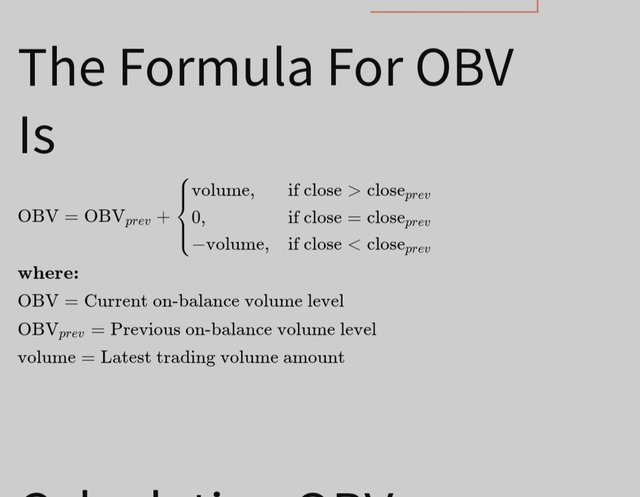
Let's take an example of one day time frame. Three possibilities for price exists as :
The asset that we have choosen for analysis has closed at Price higher than yesterday's closing price . In this case , OBV is calculated by summation of today's volume and yesterday's OBV.
if today's closing price is lower than yesterday's closing Price, than OBV is calculated by subtracting today's volume from yesterday's oBV
- If today's closing price is same as that of yesterday, than OBV will remain same .
Example, let's take any asset A and take different parameters for 4 days .
Day 1 : OBV = 10B and CP = $50k anand volume = 4B
Day2 : OBV = ? And CP = 51k and volume = 5B
Day 3 : OBV =? And CP = 50k and volume = 4B
Day 4 : OBV = ? And CP = 50K
Let's calculate OBV for different days.
Day 2 ; OBV= ?
As closing price of day 2 is higher than day 1. Therefore, OBV = Prev OBV + current volume.
Day 2 OBV= 10 + 5 = 15B.
Day 3 OBV =?
Day 3 closing price is lesser than day 2 , Therefore, OBV= Previous OBV - current volume
Day 3 OBV = 15 - 4 = 11B
Day 4 OBV = ?
As day 4 Closing price is same as that of day 3 , therefore OBV is previous OBV plus zero.
Day 4 OBV = 11 + 0 = 11B

What is Trend Confirmation using On-Balance Volume Indicator? Show it on the crypto charts in both bullish and bearish directions. (Screenshots required).

The versatility of the indicator lies in its simplicity. As mentioned above, OBV is a volume dependent momentum indicator and is used to confirm trends. The principle of trend confirmation is very simple. We know that, a strong trend in either direction results in formation of a continuation pattern on price action that manifests as formation of higher lows and higher highs on uptrend and lower lows and lower highs on downtrend.
To confirm the trend with the help of OBV, synchronization of OBV and price action is required. By synchronisation we mean that , an uptrend is confirmed when the higher highs and higher lows formed on price of an asset is followed by formation of higher highs and higher lows on OBV ndicator too. Similarly, the downtrend is confirmed when formation of lower lows and lower highs on price chart of an asset is followed by formation of lower highs and lower lows on OBV indicator too.
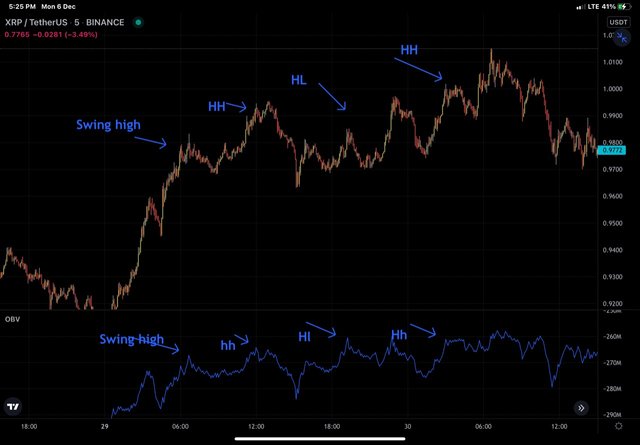
Uptrend confirmation by OBV. Please note HH= higher hugh, HL= higher low
In the XRP/USDT Chart above, we can see that uptrend manifested as formation ohighf higher highs and higher lows on price chart and consecutive moves on OBV are exactly manifested by formation of higer highs and higher lows too. So it confirms the uptrend and a buy opportunity can be spotted.
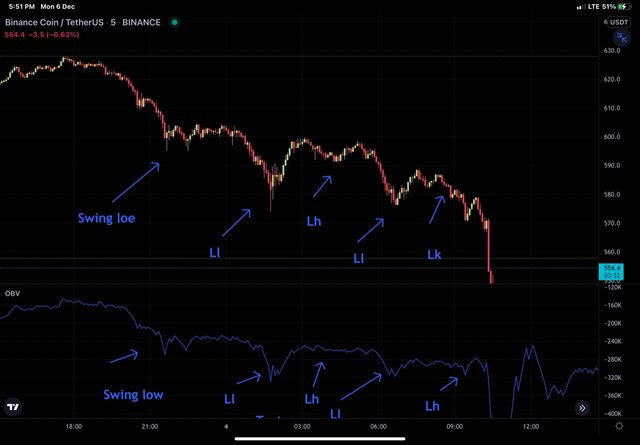
Downtrend confirmation by OBV. Please note LL= Lower low, LH= lower high
In the BNB/USDT Chart above, we can see that downtrend manifested as formation of lower lows and lpweer highs on price chart and consecutive moves on OBV are exactly manifested by formation of lower lows and lower highs too. So it confirms the downtrend and a sell opportunity can be spotted.

What's your understanding of Breakout Confirmation with On-Balance Volume Indicator? Show it on crypto charts, both bullish and bearish breakouts (Screenshots required).

Breakout as the name implies refers to moving out of a zone and the zone is formed by boundaries known as support and resistance and the confinement of price within a zone is known as consolidation. In a ranging market, price is confined within a zone formed by two more or less well defined price levels and a breakout is said to occur, when price breaks out of either support or resistance levels and continues in the direction of breakout. The morphology of OBV during consolidation mimics that of price action and breakout is confirmed by moving of OBV lines out of consolidating boundaries in the direction of movement of price.
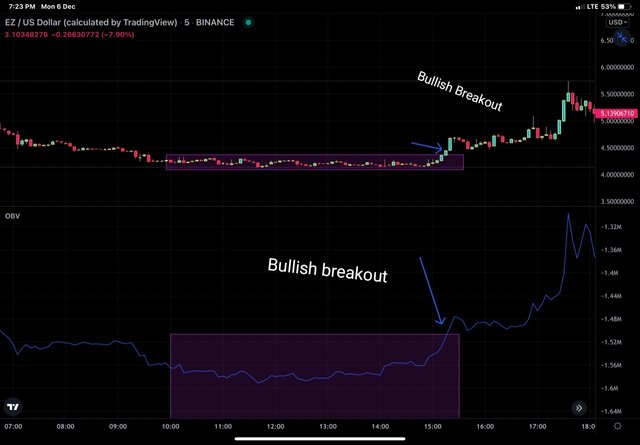
Bullish breakout confirmation by OBV
In the chart, we can see that price of EZ was consolidating in a definite zone and price broke out of the resistance and continued in uptrend. We can see that similar pattern is formed on OBV indicator as well and the break out of resistance by price action is manifested on OBV as break out of upper level of consolidating zone and movement of OBV line in the direction of price.
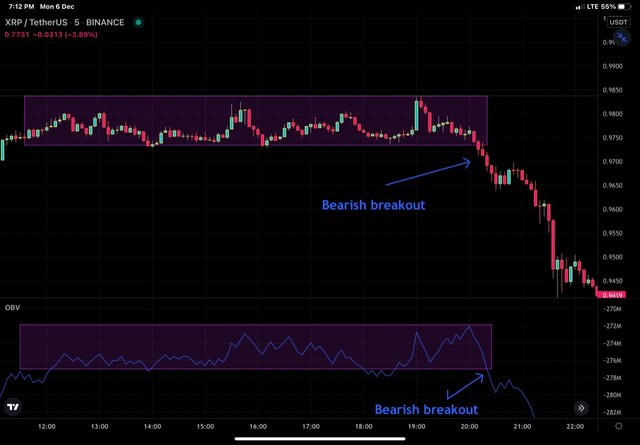
Bearish breakout confirmation by OBV
In the chart, we can see that price of XRP was consolidating in a definite zone and price broke out of the support and continued in downtrend. We can see that similar pattern is formed on OBV indicator as well and the break out of support by price action is manifested on OBV as break out of lower level of consolidatinon and movement of OBV line in the direction of price.

Explain Advanced Breakout with On-Balance Volume Indicator. Show it on crypto charts for both bullish and bearish. (Screenshots required).

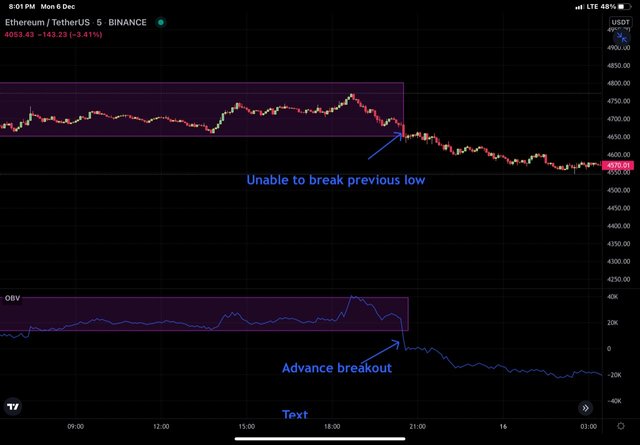
Advanced Breakout is a peculiar feature of on-balance volume indicator. It is the capability of the indicator to predict in advance the stronger movement of price in the direction of breakout. To confirm advance breakout, we look at price action and find that the price at Breakout is not able to break the previous high or low in bullish and bearish advance breakout respectively but OBV indicator breaks above high or low. It is indicative of stronger move of price in the direction of breakout.
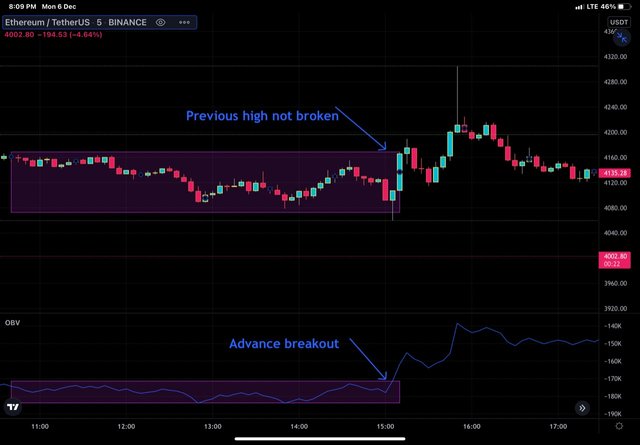
Advanced breakout in bullish direction
In the chart above, we can see that price is not able to break above the previous high but OBV has broken above previous high and the move is validated by bullish movement of price thereafter.
Advanced breakout in bearish direction
In the chart above, we can see that price is not able to break above the previous low but OBV has broken below previous low and the move is validated by bearish movement of price thereafter.

Explain Bullish Divergence and Bearish Divergence with On-Balance Volume Indicator. Show both on charts. (Screenshots required).

When price of an asset makes lower lows but OBV indicator doesn't follow price action. Instead of making lower lows, if OBV makes higher low , it is referred to as bullish divergence. We can simply put it as, price action is showing bearish moves but OBV is bullish. It indicates that the selling pressure is about to fade and buying volume is being injected to raise the price in near future. So it is a good sign for a trader to take buy position and benefit from forthcoming bullish price rally.
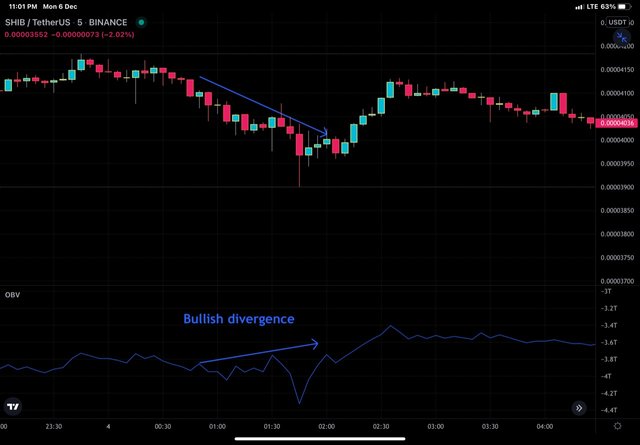
In the chart above, we can see that price of SHIB going down where as OBV show upward movement and that is than followed by bullish movement of price as well.
On othe other hand, When price of an asset makes higher high but OBV indicator doesn't follow price action. Instead of making hugher high , if OBV makes lower highs , it is referred to as bearish divergence. We can simply put it as, price action is showing bullish moves but OBV is bearish. It indicates that the buying pressure is about to fade and selling volume is being injected to lower the price in near future. So it is a good sign for a trader to take sell position and benefit from forthcoming bearish price rally.
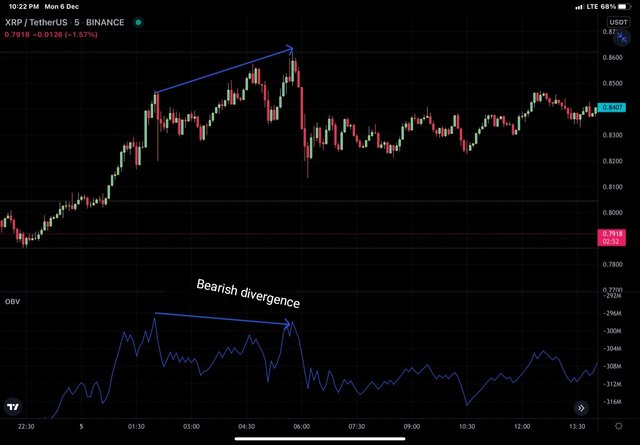
In the chart above, we can see that price of XRP is moving up but the OBV indicator is projectting down. It indicates bearish divergence and forthcoming price dip and the same has been seen thereafter by fall in price.

Confirm a clear trend using the OBV indicator and combine another indicator of choice with it. Use the market structure to place at least two trades (one buy and one sell) through a demo account with proper trade management. (Screenshots required).

OBV is a leading indicator based on volume, so it is better to combine it with some lagging indicator like EMA. For this task, I'll combined OBV with EMA .
Sell trade - WAXP/USDT
OBV is making lower highs and lower lows and EMA used is above price line. So it is a double confirmation for downtrend. I placed sell trade at WAXP price of $0.6283 and set SL just above EMA at $0.6408 and TP at $0.6009. sL is set above EMA and TP is set such that SL:TP is 1:1 .
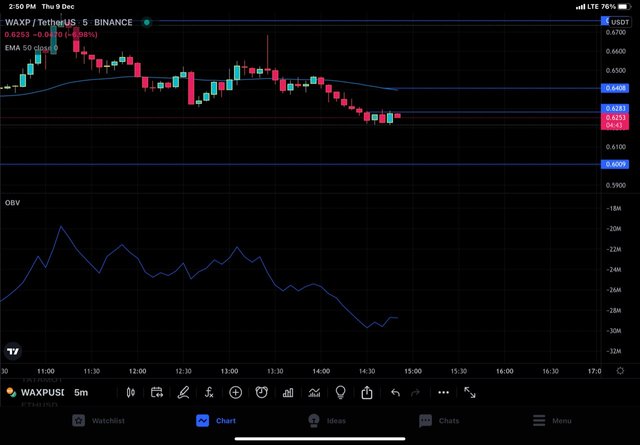
Sell trade placed
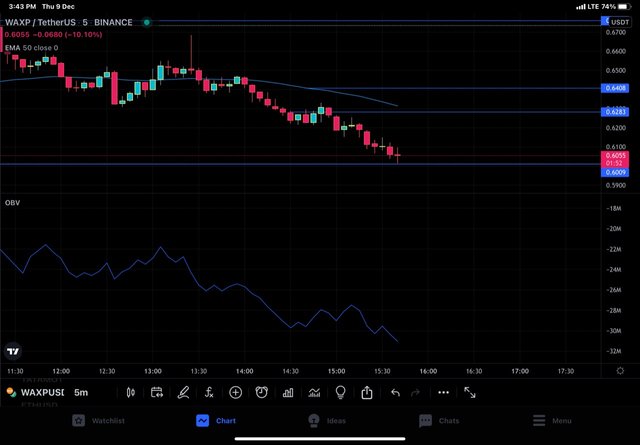
Trade executed
Buy Trade - BTC/USDT
OBV indicator is making higher highs and EMA is placed just below price line. So both the factors favour buy position. I placed buy trade at BTC price of $48424 and set SL at 48099 and TP at 48728 . SL is placed below EMA and TP is so placed such that SL:TP is 1:1 .
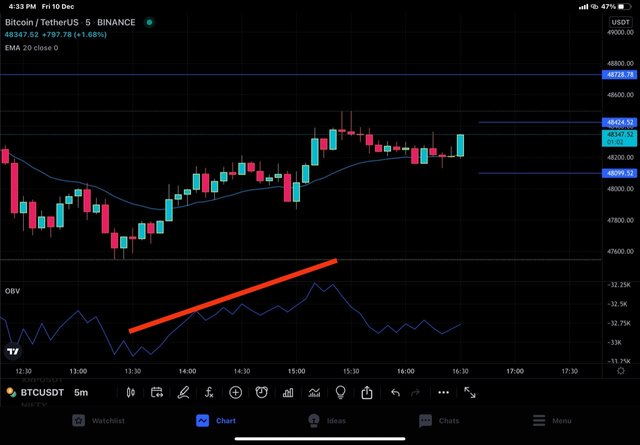
Before execution
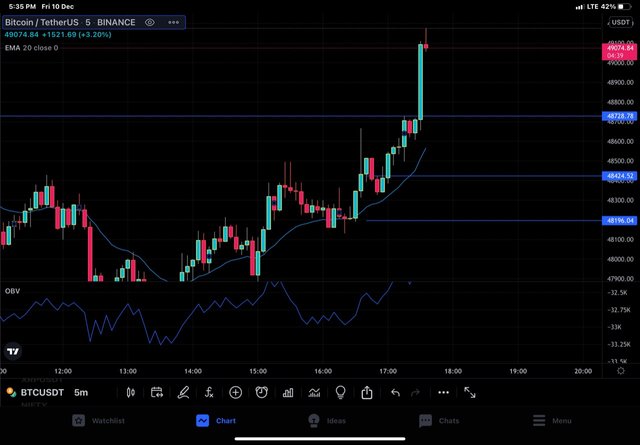
Executed -TP hit

What are the advantages and disadvantages of On-Balance Volume Indicator?

Advantages of OBV indicator.
OBV indicator is simple to understand and comprehend. As it is a single oscillating line below the chart, there is nothing difficult to understand.
OBV gives information on diverse trading parameters like breakouts, trends, divergences and also helps to materialise by generating buy and sell signals.
OBV can be used in all time frames and markets.
Disadvantages of OBV indicator .
Just like other indicators, OBV generates false signals. Therefore, support from other indicators is needed. It is preferably combined with lagging indicators.
Sudden influx or eflux of voluminous trades can result in larger spikes in OBV but that is not the representative of real trend in the market.

Conclusion

Of the many volume based indicators, on-balance volume indicator is one of the versatile indicator for multiple reasons like simplicity, ease of understanding multitude of signals generated and tendency to help materialise the signals with higher degree of accuracy. When used with other indicators, OBV serves as a potential tool in the hands of traders with the help of which they can accrue profit out of different markets by following different trading styles.