Steemit Crypto Academy Season 4 Beginners' course - Homework Post for Task 10: [Candlestick Patterns ]
Explain the Japanese candlestick chart? (Original screenshot required).
b) In your own words, explain why the Japanese Candlestick chart is the most used in the financial market.
c) Describe a bullish and a bearish candle. Also, explain its anatomy. (Original screenshot required)
Explain the Japanese candlestick chart? (Original screenshot required).
Japanese candlesticks were discovered in Japan in 18th century. Candlesticks are potential tools in the hands of traders with the help of which trades are performed. Candlesticks are used not only in the Crypto market but they are used in stock market, Forex , commodity trading etc.
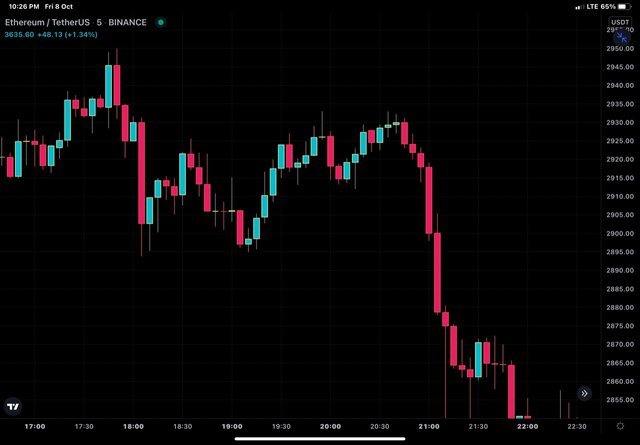
Japanese candlesticks chart
Candlesticks represent the price movement of an asset for a particular timeframe and candlesticks combine together to form different chart patterns. If we analyse each candle for a particular time frame then we will be able to notice the price changes taking place in a particular asset every second. Shape of the candle is determined by four parameters of an asset and they are opening price, closing price, high price and low price.
The beauty of candlesticks lie in their ease of understanding despite the variety of information provided. The visual appearance of candles help us understand emotions linked to the market. A rally of green candles represents positive sentiments and vice versa with red candles. So candlestick charts represnt technical as well as psychological aspect of trade and traders.
Different candles and candlesticks patrerns have psychology behind them and they help in predicting future market movement and therefore gauge trading decisions. For example, morning star pattern is indicative of bullish future movement while as shooting star and evening star indicates forthcoming bearish market movement.
In your own words, explain why the Japanese Candlestick chart is the most used in the financial market.
There are many type of charts that can be used for analysis like bar chart , line chart, heikin Ashi chart , candlestick charts, point and figure charts etc. The Japanese candlestick charts are most widely used type of charts for following reason:
Candlesticks are much easy to comprehend. Even without analysing individual parameters of candle some information like trends can be understood.
Candlessticks provide very important information regarding various trading parameters like open price, close price, high and low price of an asset under consideration over a particular time frame.
Candlesticks charts provide more information than most of the other type of charts. Line charts are based on closing price only etc.
Candlestick patterns are very effective in carrying out trades as various patterns have been identified in markets and they point to different signals.
Candlesticks have been thoroughly studied alone as well as with other indicators and are therefore very good trading tools.
Japanese Candleeticks can be used on various time frames and are equally effective in all frames of reference. In contrast, heikin-ashi charts are reliable only on long-term time frames.
Describe a bullish and a bearish candle. Also, explain its anatomy. (Original screenshot required)
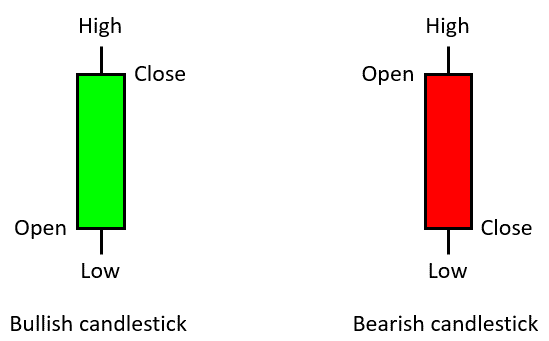
Anatomy of candle
Each candle represents an asset's information over a particular time period. Each candle shows opening price, closing price, high price and low price of an asset over a particular time frame . The area of the candle between the opening and closing price is known as real body of the candle. The price points above the opening price and below the closing price are known as the wicks or shoulders of the candle. Wicks are shown as thin lines above or below the body. The difference between top of an upper shadow to the bottom of lower Shadow represents the price range of an asset . The opening of bullish candle is towards lower side and closing is towards upper side and reverse is true for bearish
candle.
Bullish Candle
Bullish candles are either represented by green colour or white colour on different trading softwares. In bullish candle, closing price is higher than opening price. In a bullish candle, lower side of body of candle represnt the opening price and upper side of body represent closing price. if the price of an asset during a particular time frame goes above the closing price but closes below that high price than there will be a wick above the candle representing high price. Similarly, if assets dips down below opening price but closes higher than opening price, the lower wick will be formed. The lowest point of lower wick will represent the low of the candle. Difference in price between high and low is known as price range.
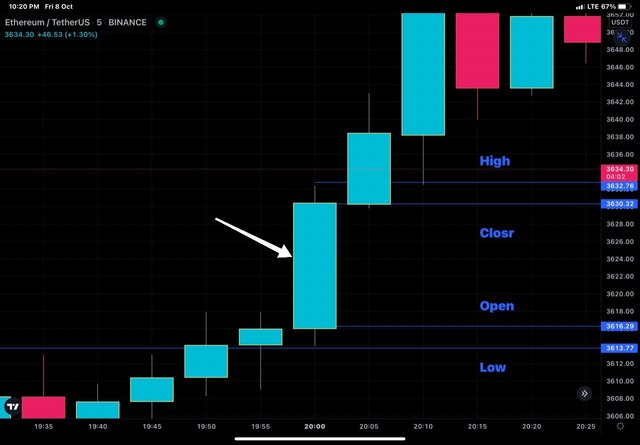
ETH/USDT showing OHLC of bullish candle marked with arrow
If the overall price of an asset goes up over a particular timeframe, than that is known as bullish trend. It is not necessary that all the candle in a bullish trend will be green.
There may be red candles in between but the overall the market is dominated by bulls and they push the price up.
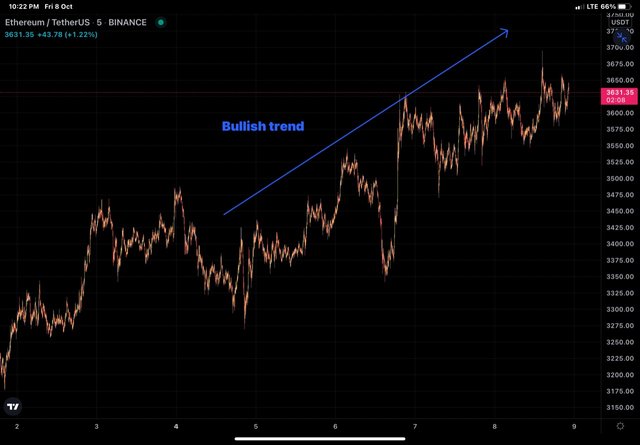
ETH/USDT chart showing bullish trend
Bearish Candle
Bearish candle represented by red candle Is a type of candle where closing price is lower than opening price. In a bearish candle, upper side of body of candle represnt the opening price and lower side of body represent closing price. if the price of an asset during a particular time frame goes up above the opening price but closes below the opening price than that would be high price and is represented by a wick above the opening price . Similarly, if assets dips down but closes at slightly higher price than closing price than lower wick will be formed. The lowest point of lower wick will represent the low of the candle. Difference in price between high and low is known as price range.
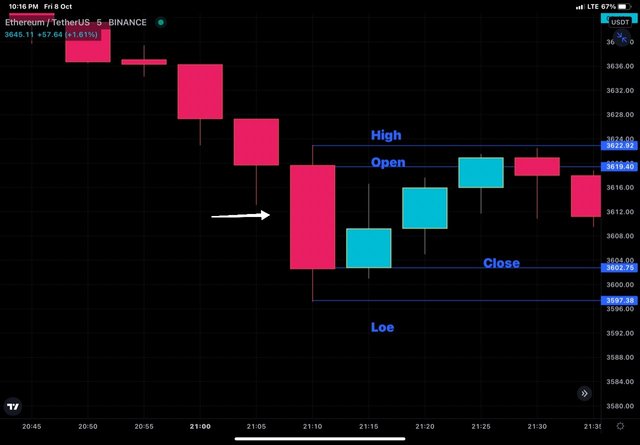
ETH/USDT showing OHLC of bearish candle marked with arrow
If the overall price of an asset goes down over a particular time frame, than that is known as bearish trend. It is not necessary that all the candles in a bearish trend will be red. There may be green candals in between but the overall market is dominated by bears and they push the price down.
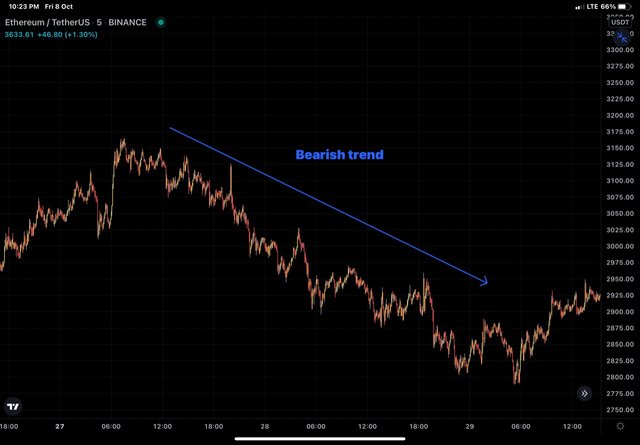
ETH/USDT
chart showing downtrend
Conclusion
Because of various benefits and details provided by Japanese candlestick charts, they are widely used. They have been thoroughly studied by analysts and provide technical as well as psychological state of market with much ease and at a glance.
Hi @drqamu, you recently delegated your SP to nutbox.mine. However, using purchasing or proxy voting services by delegating SP without systematic curation will decrease your eligibility in the context of reputation.
Cc-:
@steemcurator01
@steemcurator02
@sapwood