Steemit Crypto Academy Season 3-Week 7| Homework post for professor @kouba01 | Trading Crypto With Average Directional Index (ADX) Indicator
Discuss your understanding of the ADX indicator and how it is calculated? Give an example of a calculation. (Screenshot required)
ADX ( Average directional Index) is a trend strength indicator which means that ADX gives an idea of strength of an trend and the trend may be either bullish or bearish.
As the saying goes "Trend is your friend" And don't go against the trend. So a trend strength indicator is a potential tool in the hands of traders in such circumstances. ADX is non directional, that is, ADX will go up or down irrespective of the nature of trend. To further simplify whether there is strong bullish or strong bearish trend, ADX will go up. On the contrary, when trend ( bearish or bullish) weakens, ADX goes down .
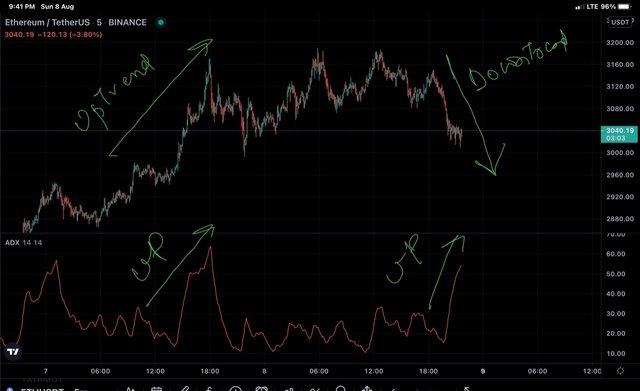
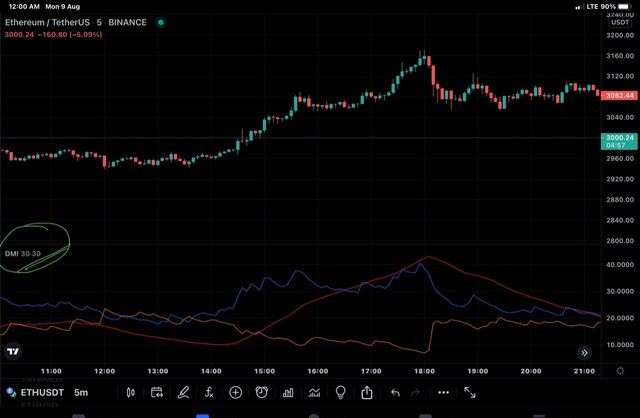
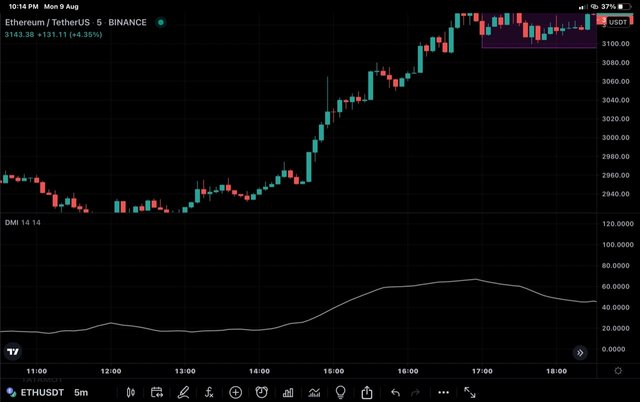
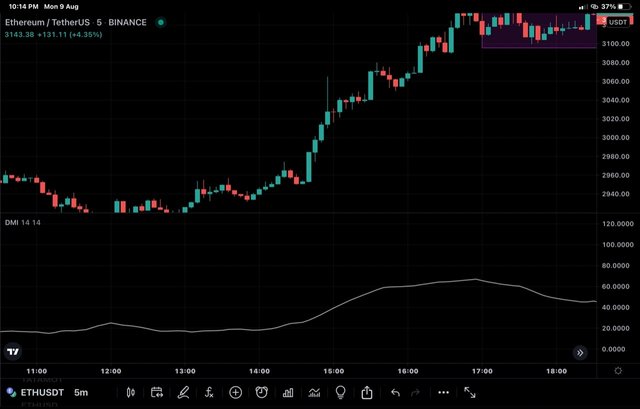
ETH/USDT CHART
In the ETH/USDT , an oscillating line below the chart is ADX. With the help of arrow, i have highlighted two regions on price chart as well as ADX. We can see ADX moving up when the ETH price moved up and down. So we should understand from the chart, ADX is non directional, it just indicates strength of trend whether bullish or bearish.
For better understanding and simplification, ADX has been quantified from 0 to 100. The quantification has subdivisions based on varying degree of strength of trend, as given below.
| ADX VALUE | STRENGTH OF TREND |
|---|---|
| 0 - 25 | No trend |
| 25 - 50 | Strong |
| 50 - 75 | very strong |
| 75 - 100 | Extremely strong |
From above table , we inferred that a value of 25 represents a borderline below which market is non trending and above which market is trending and trend of varying strengths are represented by different numbers. As strength of trend increases, value of ADX also increases above 25. It is important to mention that falling ADX does not represent the reversal of trend but it represents there is decreasing strength of the trend. As seen above, ADX does make peaks like price line. We can understand momentum of trend from these peaks. When the peaks keeps on increasing, it would mean increasing momentum and vice versa. Trend momentum is useful for a trader in deciding whether to continue holding position or exit from market.
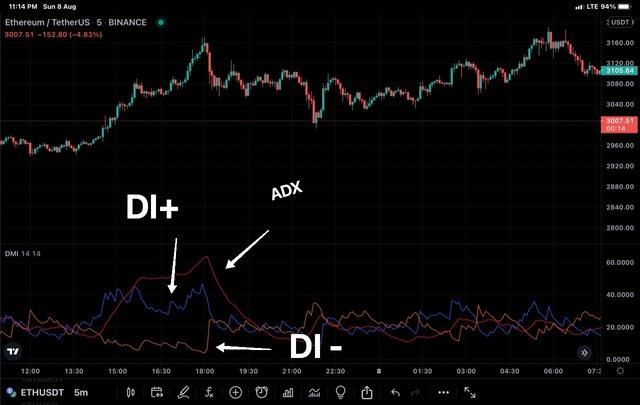
When we add ADX to chart, along with above line, we see two more curves evolving and they DI + and DI - . Although ADX can be used alone as it is in itself an indicator that provides some information about market . But reading it with DMI, gives clarification about direction of market movement which is not given by ADX. Details of ADX with DMI will be given later, let's focus on calculations now :
- True Range : For TR , we have to do some calculations and of those calculations, the one that is higher is the actual value of TR. The calculations are :
Current high minus current low
Current high minus previous close
Current low minus previous close
From the above calculations, we would get different values and whichever value of theae three is higher, that will be the TR
- DMI+ and DMI - : DMI + calculations involves Exponential moving average (EMA) of uptrend ( let's say Xup) amd EMA of true ramge ( X Tr) , similarly DMI - involves EMA of down trend ( X down) and EMA of true range ( X Tr).
DMI + = Xup / X Tr ( if it comes out to be negative, than DMI + would be taken as zero)
DMI - = Xdown/XTr ( if it comes out to be negative, take it as zero)
Another simple way to calculate DMI + and DMI - is
DMI + = high of the day - previous high.
DMI- = precious low - low of the day
If any one of these is negative, than final value by default will be zeeo.
DI+ = DMI + / TR
DI - = DMI - /TR
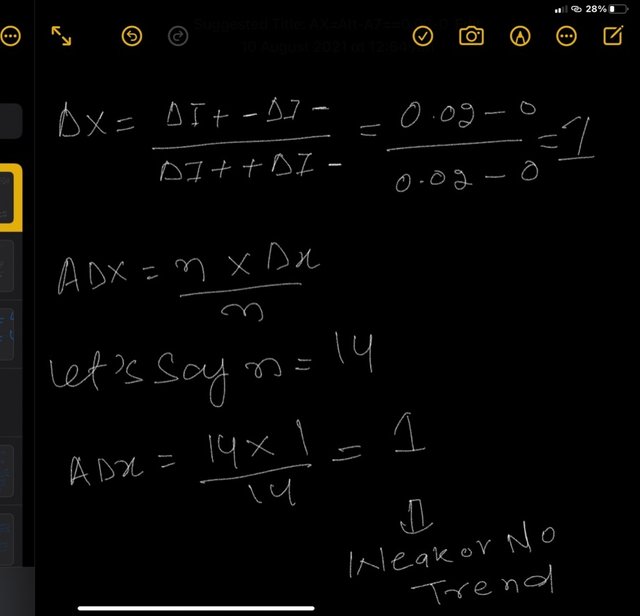
- DX = | +DI - DI - | / | +DI + DI +|
Where DX is directional index
ADX formula is given below
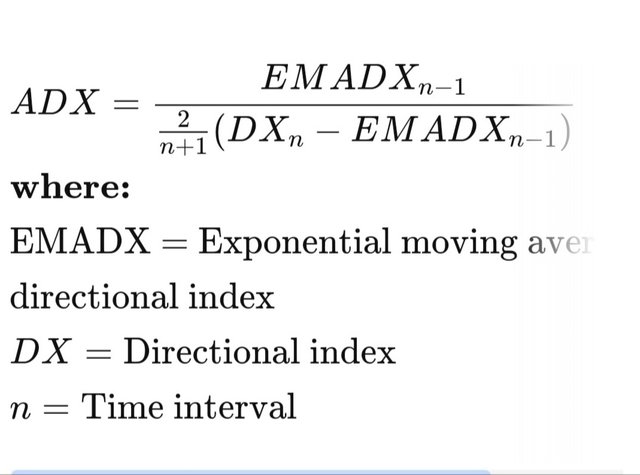
Source
As it seems complex, splified ADX is given below
ADX = Number of period (n)× (DX) / number of period (n)
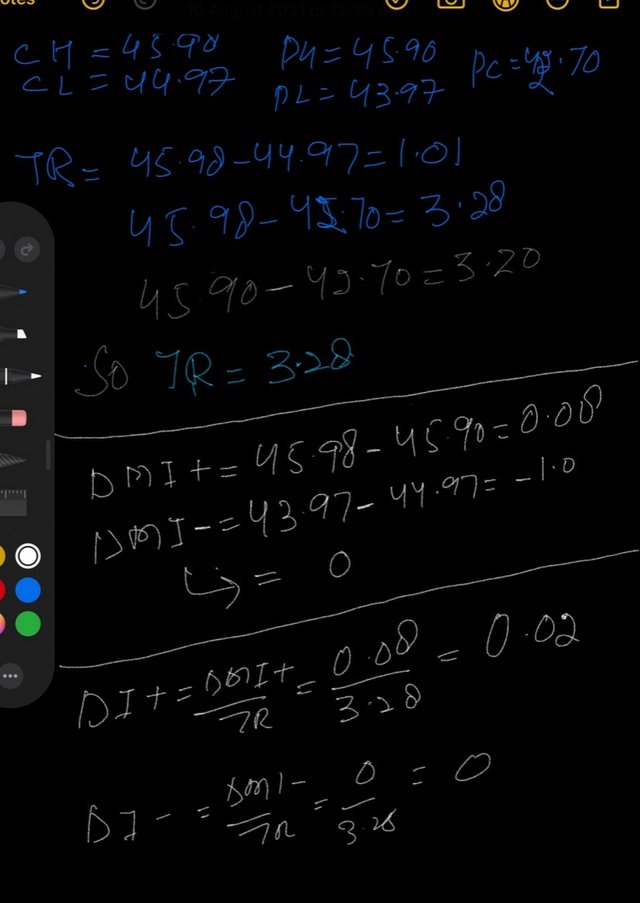
Hypothetical example
Assuming given values to be ( in any currency)
Current high = 45.98
Current low = 44.97
Prev. High = 45.90
Prev. Low = 43.97
Prev. Close = 42.70
How to add ADX, DI+ and DI- indicators to the chart, what are its best settings? And why? (Screenshot required)
Adding ADX and DI + and DI - to chart.
I'll be using trading view app. You can do it from official website of trading view too. I launched trading view app.
Select any trading pair. Chart of the pair will load.
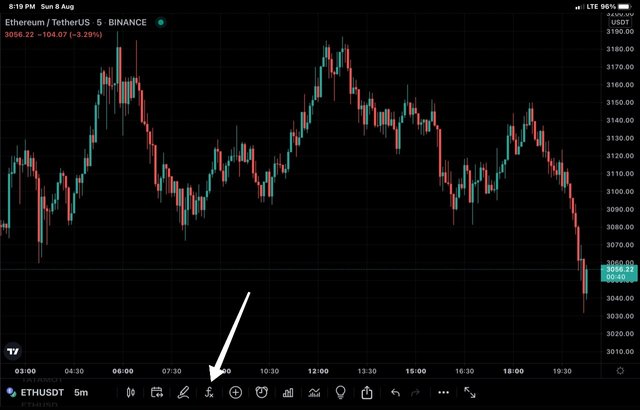
Click on indicators from the top menu. In my case, i have Indicators option at bottom of the chart.
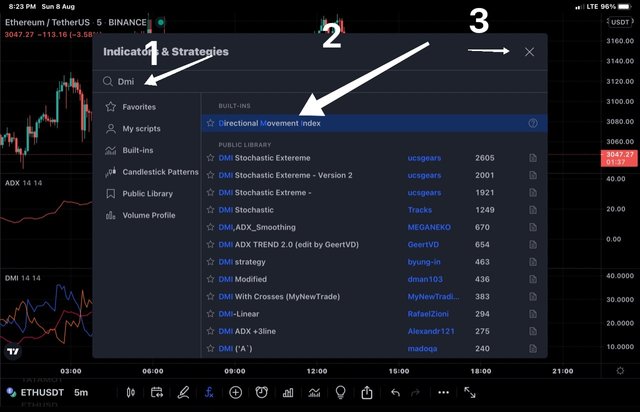
Next we type Directional movement index in the search box provided and select same Indicator from the suggestions. Go back to your chart and you will find indicator loaded at bottom of your chart.

Configuration of the Directional movement indicator.
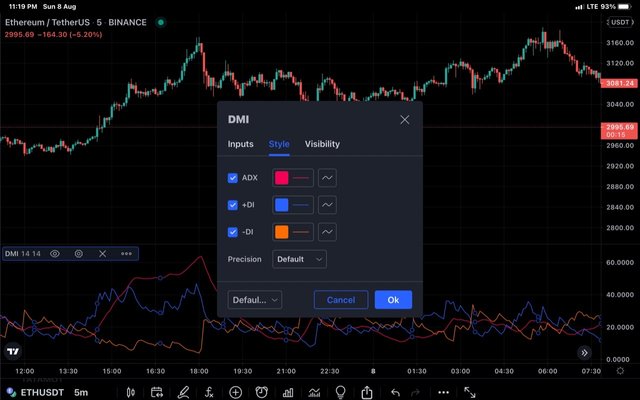
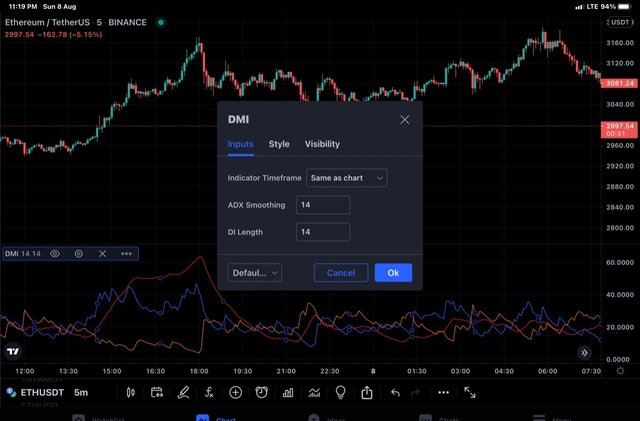
Double click on Indicator and chart settings will load.
Style settings -
Here we can choose color and precision of indicator, let's keep colors as it is. We can change these settings too.In the Inputs settings, we have indicator timeframe and length. We have to make timeframe sync with that of chart and DI length by default is 14 and ADX smoothing is 14 also. We can change them too.
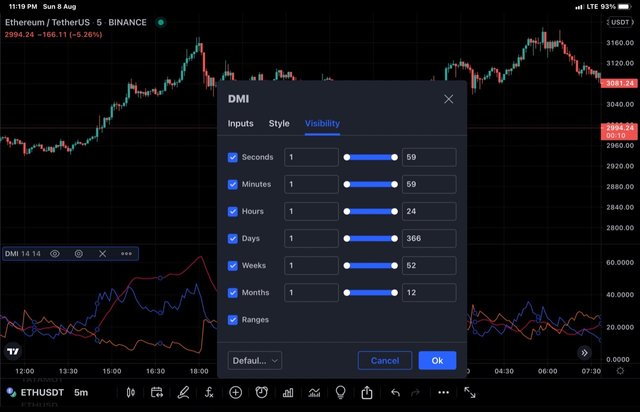
In the visibility, we have seconds , minutes, hours, days, weeks, months. Let's keep default settings for visibility.
**
Best Settings .
Default settings of ADX as mentioned above, uses 14 periods. It means on 1 day chart, it would take 14 days into consideration, on an 1 hours chart, it would consider 14 hours and on 1 min it would take 14 min in consideration etc.
To understand which timeframe setting is best, I'll be showing three different period settings with the same chart over a fixed time period. Let's begin:
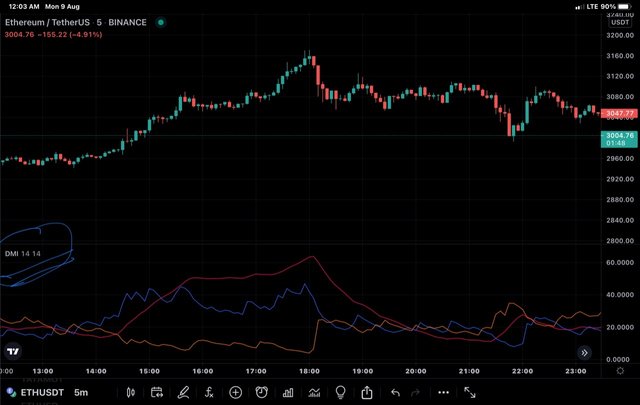
ETH/USDT on 14 period time frame
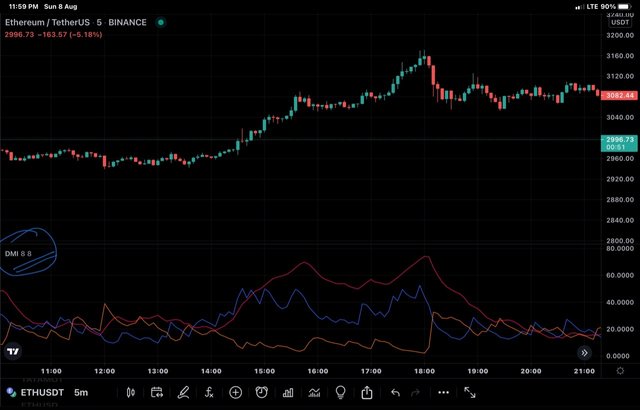
ETH/USDT on 8 period time frame
ETH/USDT on 30 period timeframe
From the above charts, we have to take 14 period as standard and let's compare other two with it. The 8 period chart is more wavy and difficult to follow as it gives frequent change in signal and also gives some erroneous signals too. While as 30 period chart, gives more flat indicators than 14 period. It absorbs most of the signals within it but some signals are totally missed as 30 periods ADX doesn't reflect trend untill, it is very strong. So larger time frame setting is better but support from other indicators is needed to avoid missing some positive signals.However, i would prefer using it on default mode.
Do you need to add DI+ and DI- indicators to be able to trade with ADX? How can we take advantage of this indicator? (Screenshot required)
We cannot trade alone on the basis of any indicator be it ADX or DMI. Adding DMI doesn't provide any major support to ADX but it undoubtedly does add value to it as DMI curves respond quicker than ADX . DMI gives direction of trend whether bullish or bearish where as ADX gives strength of trend. Need of DI +/- is eliminated by looking at price action as direction of trend is evident by price action itself. However adding DMI to ADX makes it more informative and easier to comprehend.
Advantages of indicator
Strength of trend.
Based on the values of ADX, quantification of trend strength is carried out. Trend strength is also visualised from the ADX peaks even before being reflected on price line . When higher high peaks are formed, trend is strong and vice versa. Different types of trends are classified on the basis of ADX value. We shall discuss the trends later.
Bullish or bearish trend.
The two more curves that are seen along with ADX line are DI + and DI - , they represent the direction of bullish and bearish trend respectively. If DI+ is above DI - , it indicates bullish trend where as if DI - is above DI + , it indicates bearish trend.
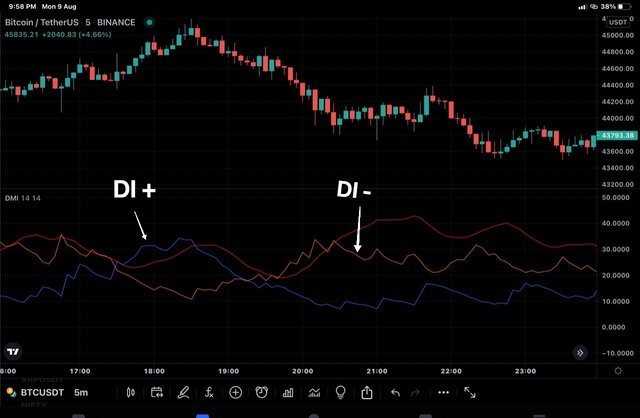
In the chart above, we see when trend is bullish DI + is above DI - and when trend is bearish DI - is below DI + .
Crossover of DI + and DI -
Some traders use crossover of DI + amd DI - as buy/ sell signal. When DI + crosses DI - from below-up words it is buy signal whereas when DI + crosses DI - from above downwards, it is sell signal. Some traders have gone one step further by looking at ADX line along with crossover. In case of any crossover, if ADX line is below 25 , the crossover is not considerd valid and buy or sell signal is only heeded when ADX crosses 25. Buy and sell signals reflected by crossovers are not very much reliable .
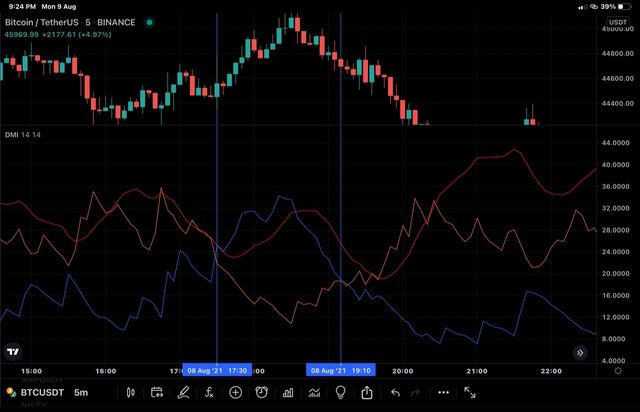
In the BTC/USDT chart above , let's analyse the reliability of crossover. I have marked two crossovers with two vertical lines. Bullish crossover happened when trend had already started and bearish crossover occured when the price rally has dipped down significantly. If we compare entry and exit points as per crossovers, we see that profit earned during bullish trend has almost nullified by the time exit signal was shown. So crossocers are not reliable signals.
What are the different trends detected using the ADX? And how do you filter out the false signals? (Screenshot required)
Trends detected bt ADX
Weak or no trend.
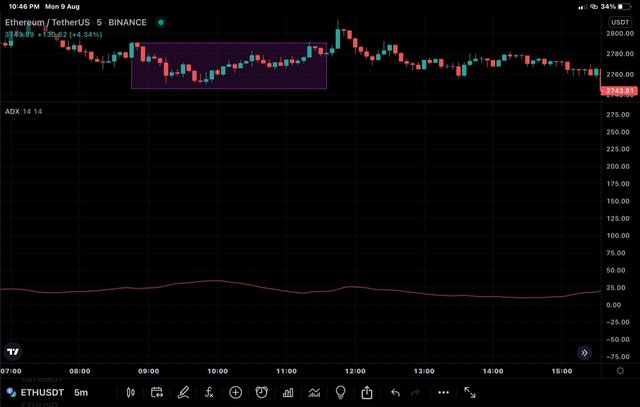
If the value of ADX is less than 25, it means there is no trend or week trend in the market . At that time the market is not good for trend following traders. It means that buyers and sellers are not showing interest in the market at that time. Price tend to fluctuate between support and resistance level as there is no trend in the market. So we can say that market is consolidating during this phase. We know that consolidation is a sort of preparatory phase for trend formation and the trend can be bearish or bullish depending upon whether the price action breaks support or resistance. When consolidated market breaks resistance, bullish trend is formed and when it breaks support, bearish trend is formed.
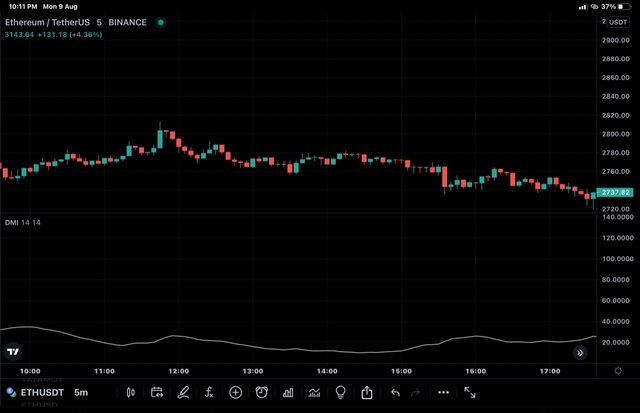
In ETH/USDT chart above, we can see that price of ETH ranging between defnite support and resistance and ADX below 20.
Strong trend
When the ADX value is between 25 to 50, it indicates that there is a strong trend in the market . Thisn forms ideal zone for traders to trade.
This chart is continuation of the chart given above , we can see that as the ETH enters bullish trend , value of ADX also increases.
** Very strong trend**
ADX value between 50 to 75 indicates that there is a very strong trend in the market and usually this trend doesn't last long. in this zone, we see price action usually breaks through established support and resistance.
For part of price which shows very strong bullish momentum, ADX value is above 50 .
Extremely strong trend
ADX value of above 75 indicatea extremely strong trend and is rare. So this period represent hugh volatility of the asset and is very short lasting. Such periods usually follow some very good or very bad news in the market.
Filtering of false signals.
There is simple mechanism to filter out false signals and that is by taking into account long periods. We know the default setting of a ADX takes into account 14 periods time frame which can be increased or decreased . As shown above, if the ADX timeframe is decreased, it becomes more sensitive to the change in the market but the number of false signals generated is increased. On the contrary, when the timeframe is increased,it become less sensitive and absorbs most of the market signles and thereby decreasing the chances of false signals.
Charts for different periods have been given above.
Explain what a breakout is. And How do you use the ADX filter to determine a valid breakout? (Screenshot required)
Breakout as the name implies refers to breaking out of any level . In the market those levels refer to support or resistance. So when the price of an asset under consideration moves above or below the established support or resistance level, a breakout is said to have occurred. To further simplify , price breakout can occur above the resistance level or below the support level.
A breakout can be true breakout or false breakout. A true Breakout continues to drive the price rally in the direction of breakout whereas a fake or false Breakout fails to drive the price rally in the direction of the breakout . In case of fake breakout, price retraces its path back to the zone from which it broke out and may even reverse and therefore breakout traders are caught.
ADX filter
We know that ADX gives the good idea of strength of trend. So from the ADX value breakouts can be filtered. The breakout that happen above ADX value of 25 are valid as they occur above weak zone, so they have Hugher chances to continue and qualify as true breakouts. On the other hand, breakouts happening below ADX value must not be traded bybreakout traders.
In the above ERH/USDT chart, we can see that market was choppy , represented by a rectangle. Than a bullish candle broke the resistance level. When we look at ADX for the corresponding region, we saw that ADX was below 25. So it could have been easily avoided. We further saw that price again dipped to the same choppy ramge as before.
What is the difference between using the ADX indicator for scalping and for swing trading? What do you prefer between them? And why?
ADX for scalping .
Scalping involves taking multiple trades within a day and earning small profits from multiple trades. So smaller time frames like 1 min, 5 min and 15 min are ideal to use.
ADX indicator can be used on the same time frame as that of price chart to find the strength of trend. Based on price action, we can find support and resistamce zomes. To filter out any erroneous signal, other indicators like RSI, ichimoku cloud etc can be used along with ADX.
ADX for swing trading.
Swing trading refers to style of trading in which trader holds his position for several days to benefit from swing in price. So medium term time frames are used like 30 min, 1 hour, 4 hour. So ADX indicator can be used with other indicators like ichimoku, RSI , MACD . ADX would give strength of trend and DMI would give direction.. Other indicators help in determining entry and exit points when ADX helps in deciding whether to continue or exit the trade.
I would prefer ADX use in swing because for swing trade ADX has to be used on larger timeframe and we know that larger time frames filter out most of the false signals.
Conclusion
ADX is a Simple trend strength finding non directional indicator usually read along with two DMI curves that give direction of trend. Based on different values of ADX, quantification of trend is carried out that help traders understand the interaction between buyers and sellers. When used along with other indicator, it gives valuable signals to the traders about various trading parameters. Just like amy other indicator, ADX too has pros and cons. So ADX must be used along with other indicators for different trading strategies and different periods must be tested.
Hello @drqamu,
Thank you for participating in the 7th Week Crypto Course in its third season and for your efforts to complete the suggested tasks, you deserve an 8/10 rating, according to the following scale:
My review :
Good content, through which you were able to cover all aspects of the topic clearly, based on a set of accurate information. However, I have some notes:
For the first question, you explained well all the required elements in it, with thanks for the efforts made in providing a practical example of how to calculate the indicator.
The second and third questions are well explained.
Your answer to the fourth question is good. It was possible to explain more than one way to extract the false signals.
The last question lacks depth in the analysis, especially in the topic of your choice in which type of trading you prefer to use the ADX indicator.
Thanks again for your effort, and we look forward to reading your next work.
Sincerely,@kouba01
Thank you very much . Will try to improve next time.