Steemit Crypto Academy Season 3-Week 5 , Homework post for professor [ @kouba01 ] , Trading Crypto With Ichimoku-kinko-hyo Indicator - Part 2
Having developed some basic understanding of the ichimoku indicator in the part first of the talsk by professor @kouba01, we are now diving deep into the remaining parameters of the task. With the brief brush up of the previous lecture, we will move on to the specifics of this task.
Ichimoku kinko hyo was introduced by Goichi Hosoda in 1960s. It is a comprehensive trading indicator which provides information about various trading parameters and the basic framework of the indicator is tabulated below
| Japanese name | English name |
|---|---|
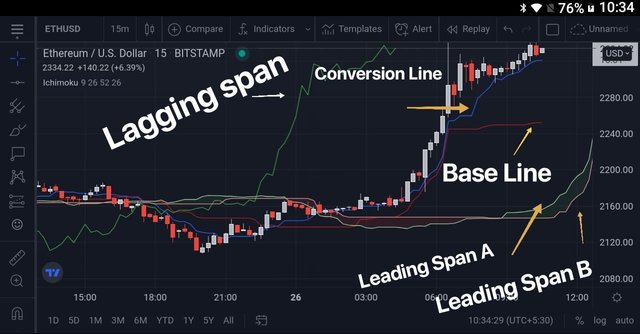
| Tenkan-sen | Conversion line or fast line |
| Kijun-sen | Baseline or slow line |
| Senkou span A | Leading Span A |
| Senkou span B | Leading Span B |
| Chikou Span | Lagging Span |
Discuss your understanding of Kumo, as well as its two lines. (Screenshot required)
Kumo refers to the gap between senkou span A (leading span A) and senkou span B ( leading span B). Kumo is colored green or red to represent bullish or beraish market. The versatility of the cloud is reflected by its ability to give a clear cut information at a glance without even going into the details. In a bullish market, cloud is projecting upward and in bearish market, it is projecting downwards. At times , horizontal movement of cloud can be seen and that signals neutral or sideways or ranging market.
Senkou span A ( leading span A) forms the edge of cloud. It is calculated as (Tenkan-sen + kijun-sen)/2 plotted 26 periods ahead. Where as Senkou span B known as leading line B or leading line 2 which forms other edge is calculated as (highest high + lowest low)/2 calculated over the previous 52 periods and plotted 26 periods ahead.
A and B with the name of these lines doesn't mean above or below. Which line will be above and which will be below , that is an important point to mention. In bullish market senkou span A will be above senkou span B and vice versa in bearish market.
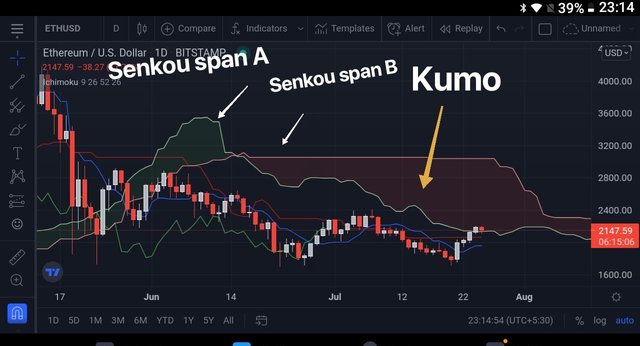
SSA AND SSB Labelled along with kumo. Other lines have been hidden to focus on topic.
The lines along with the kumo have much more to convey which we will be discussing in concerned sections below.
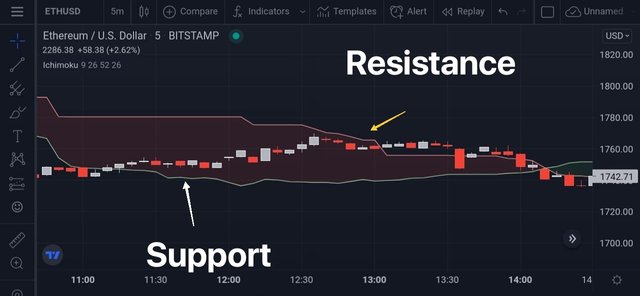
What is the relationship between this cloud and the price movement? And how do you determine resistance and support levels using Kumo? (Screenshot required)
Relationship berween price and cloud movement.
It is very simple to understand that , in a bullish market as the price is going up , cloud will be seen below the price or we can say price is above the cloud. On the contrary, in a bearish market as the price is going down , cloud will be seen above the price or we can say price is below the cloud. We can also correlate the cloud with the strength of trend. If the cloud is projecting upwards in a bullish market, it means that the trend is strongly bullish and vice versa holds true for bearish markets.
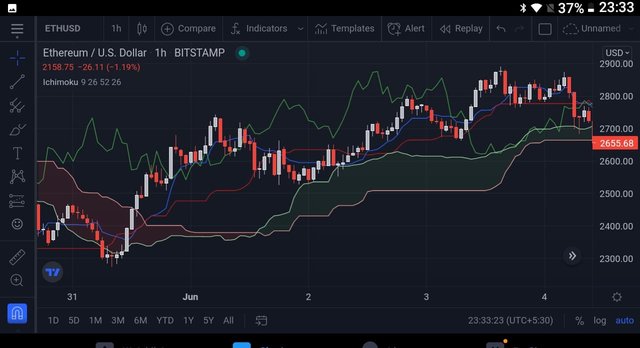
In the chart above, we seen cloud below price line in bullish market.
We can see cloud below price line in a bullish market.
The third possibility that arises is that of a sideways going market. In such case cloud will also moving sideways or horizontally amd price may enter within the cloud. So there is no definite pattern of cloud with respect to price line.
Ranging market. No trend seen.
As for width or cloud is concerned, it is itself an indicator of volatility. In a highly volatile market, the two lines forming the cloud will be widely spaced where as in a relatively less volatile market, lines will be comparatively closer to each other.
In the chart above, I have marked three points A, B and C . Look at the corresponding width of the cloud at these three points. You can clearly see that , at point A, cloud is wider than point B, wider than pointC. So volatility of the market as indicated by the cloud is more at point A then point B than point C.
Resistance and support using Kumo.
For a kumo to act as support or resistance, we will have to understand three scenarios. First one is an uptrennding market , second is downtrending market and third is sideways market. Let's take these scenario one by one;
We know that in a bullish rmarket the cloud will be formed below the price line, so the cloud will act as as "zone of support" for the price. Cloud in such case will be formed by Senkou line A above and Senkou line B below. I mentioned above that cloud will act as a zone of support not as a" line of support*. By saying that , cloud will act as a zone of support, we should understand that a price can take support from either Senkou line A or Senkou line B in an uptrending market. So we cannot take one of these lines as a support line but either of these can act as support line at various points of time.
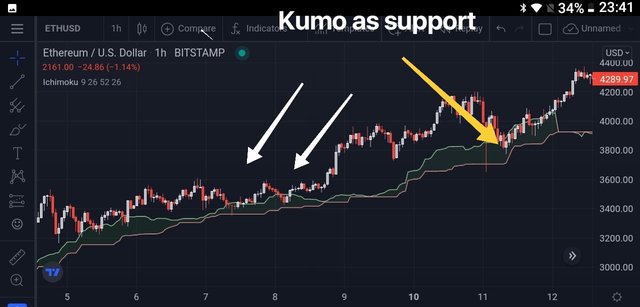 we can see that kumo acts as support zone.
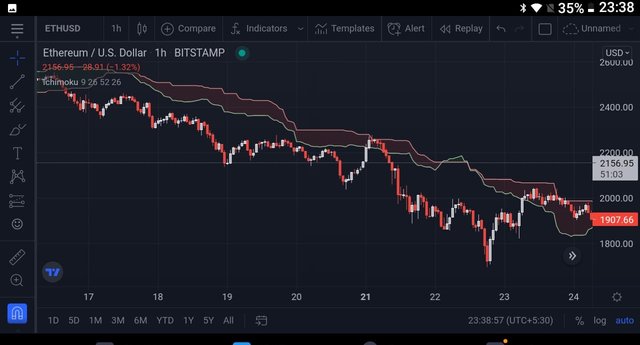
In a bearish rmarket , the cloud will be formed above the price line, so the cloud will act as as "zone of resistance" for the price. Cloud in such case will be formed by Senkou line A below and Senkou line B above. I mentioned above that cloud will act as a zone of resistance not as a" line of resistance*. By saying that , cloud will act as a zone of resistance, we should understand that a price can take resistance from either Senkou line A or Senkou line B . So we cannot take one of these lines as a resistance line but either of these can act as resistance ine at various points of time.
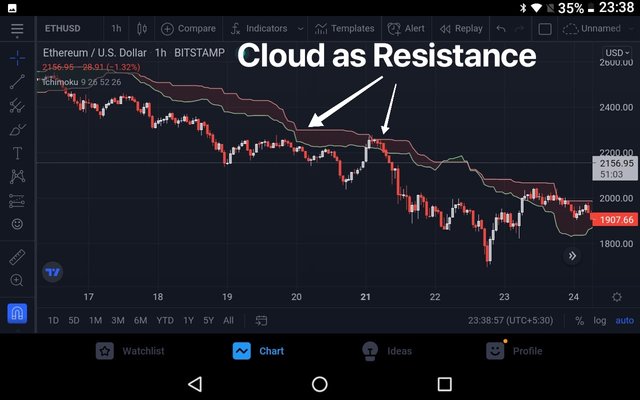
In the chart above, we see cloud acting as a zone of resistamce, with price goong down after touching either of these lines.
In a sideway market , when price enters the cloud, the two lines forming the cloud will axt as support and resistance below and above respectively.
Look at support amd resistance taken by price within the cloud.
How and why is the twist formed? And once we've "seen" the twist, how do we use it in our trading? (Screenshot required)
Let's recall the orientation of SSA and SSB. Normal orientation in uptrending market is SSA above SSB with the formation of green cloud in between while as in case of a down trending market , the normal orientation is SSB above SSA.
Twist refers to cross over of these lines and indicated forthcoming change in trend. To put it simply, when SSA crosses SSB from above downwards, it indicates change in trend from bullish to bearish. Similarly, in a downtrending market, when SSB crosses over SSA from below upwards, it indicates forthcoming bullish trend. However, it is important to mention here that, mostly the trend may not be immediately reversed but usually market enters into range and than the actual trend reversal may take place.
The basic principle behind this twist is dominance of buyers over sellers or sellers over buyers. Let me tell you how. When SSA crosses SSB from above downwards, it indicates forth coming bearish trend which is due to bears or sellers trying to dominate over bulls or buyers. On the otherhand, SSB crosses SSA from below upwards, it indicates forthcoming bullish market which is due to bulls or buyers trying to dominate over bears or sellers.
When one group dominates over other, change in trend takes place.
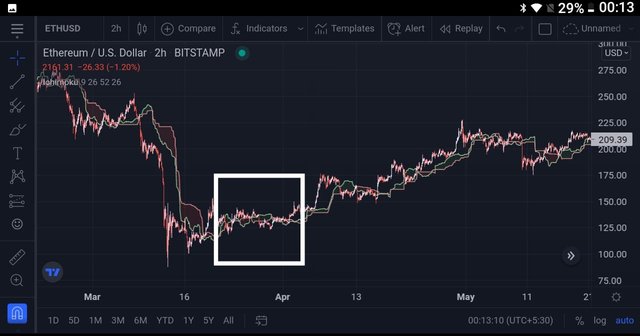
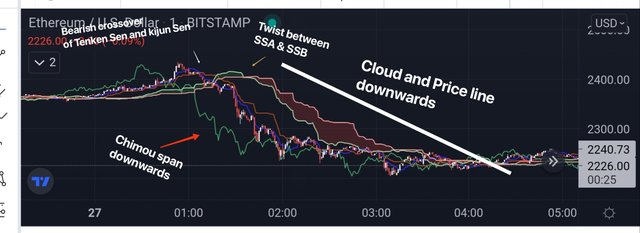
In the chart above, we can see trend reversal happening, i have highlighted area where twist has occurred. But in this chart, twist is not clearly visible. So I'll zoom out the highlighted area and show it in next chart below.
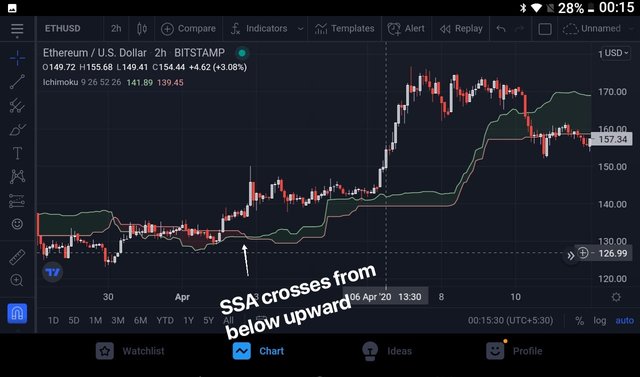
Twist - SSB crosses from below upwards with forthcoming bullish trend.
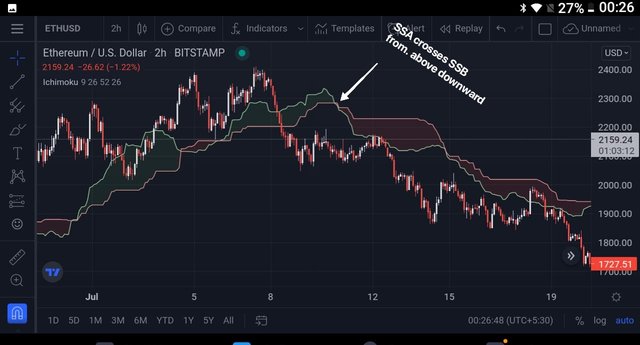
Twist - SSA crosses SSB from above downwards and forms lower border of cloud for subsequent part of the cloud during bearish pnase.
What is the Ichimoku trend confirmation strategy with the cloud (Kumo)? And what are the signals that detect a trend reversal? (Screenshot required)
Ww know that price moveent in a market can be either upwords , downwards or sideways. As for trend is concerned, it is very simple to look for trend with the help of komu. For bullish trend, kumo or cloud must be directed upwards where as for bearish trend, cloud must be projecting downwards. The direction of cloud is mandatory to look for because color of the cloud is not confirmatory. The color is green in case of clear bullish market and red in case of clear bearish market. One may be caught in a trap in ranging market by looking at color.
Trend reversal signals.
Twist in SSA and SSB : Twist is the first signal to indicate trend reversal. Details of twist as a signal indicator is given above.
Break of cloud : As mentioned above the price line will be above the cloud in bullish market and below the cloud in a bearish market, so for a trend reversal price has to cross through the cloud. First the price will enter into the cloud where SSA and SSB will act as a support and resistance as mentioned above. For trend reversal, price must break through the cloud because at times , market can go sideways within the cloud. So break of cloud is confirmatory.
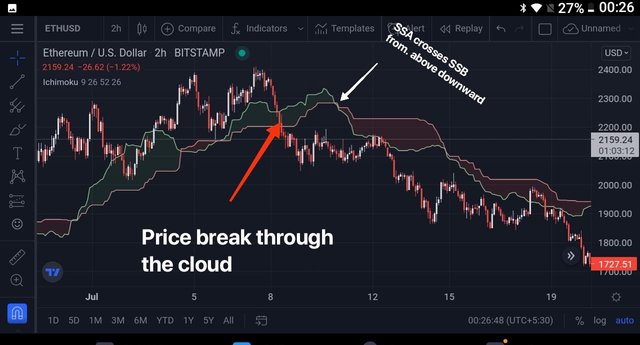
Twist and cloud break seen
- Chikou span break through cloud : Break of chikou span through the cloud is another confirmatory signal.
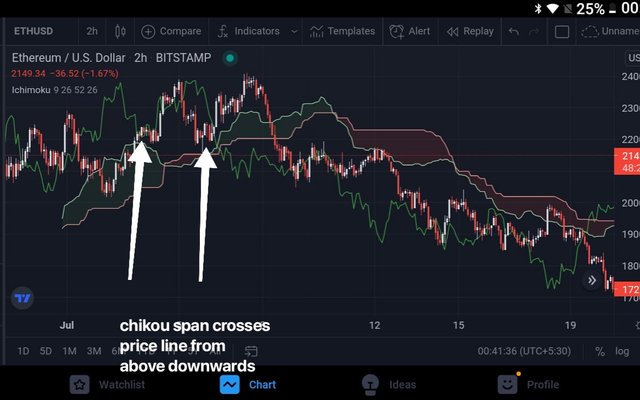
Chikou span crosses price line from above downwards
- Direction of cloud ( SSB more precisely) : As mentioned above, direction of cloud, more precisely SSB in the direction of trend is a good signal of trend confirmation.
Explain the trading strategy using the cloud and the chikou span together. (Screenshot required)
As question demands trading strategy as per cloud and Chikou span , so let's focus on these two parameters. However it's worth mentioning that price action lies at the heart of trading irrespective of the strategy. So along with Chikou span and cloud , price action must be considered. Let's look at different use cases:
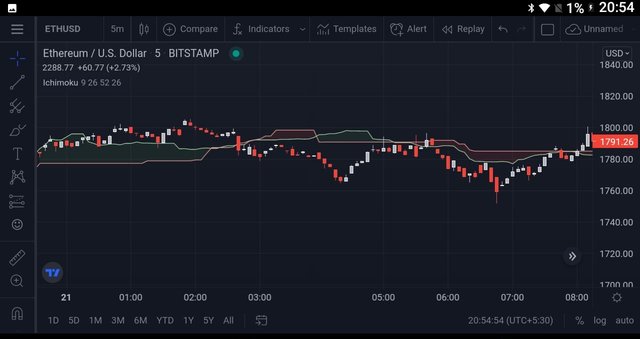
- For a valid bullish trend , price action must be going up. Chikou span and cloud must be projecting upwards. If all these conditions are met, we can place buy order. Set our stoploss and take profit levels.
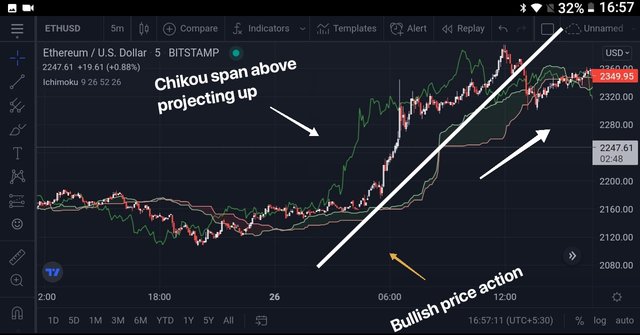
Look at ETH/USD chart on 5 min time frame, i have labelled it and we can see, all the conditions are met. So it is a valid bullish trend.
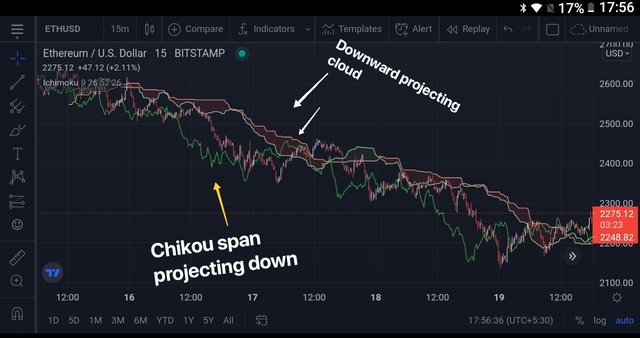
- For a valid bearish trend, price action must be projecting downwards . Chikou span and cloud must also be projecting down also. If all these conditions are met we can place sell order. Set stop loss and take profit level as well.
Look at above ETah/USD chart on 15 min time frame, we can see all the conditions are rmet, so it is a valid downtrend and we can place sell order.
As mentioned above, price action lies at the heart of any trading strategy irrespective of the indicator . Third scenari may arise in which, Chikou Span and Cloud are projecting upwards or downwards but price action is not syncing with the indicator signals. In that case, I would suggest to abstain from trading and wait for price action to orient in any particular direction and synchronise with the indicator for a a signal to become valid.
Explain the use of the Ichimoku indicator for the scalping trading strategy. (Screenshot required)
Scalp trading refers to a type of trading where a trader does numerous trades in a day and each trade lasts for seconds to minutes. So lower time frames like, 1min, 5 mins, 15 mins are used.As a matter of common understanding, a trade that lasts seconds to minutes will obviously have lesser profit per trade. Cumulative profit may be satisfactory for scalp traders.
Bullish Market - Buy trade.
Whatever be trading style, rules of trading won't change. So signals to enter or exit as per ichimoku would remain same. Let's say, we want to buy a scalp trade. So we will have to look for following points :
Bullish price action or market structure, because only than we will gain profit from buy trade.
Price line has to be above the cloud.
SSA must be above SSB or twist showing so
Chikou span must be directed upwards or crossed cloud from below upwards.
Tenken sen line above kijun sen or crossover showing so indicatea bullish trend.
- Time frame must be small.
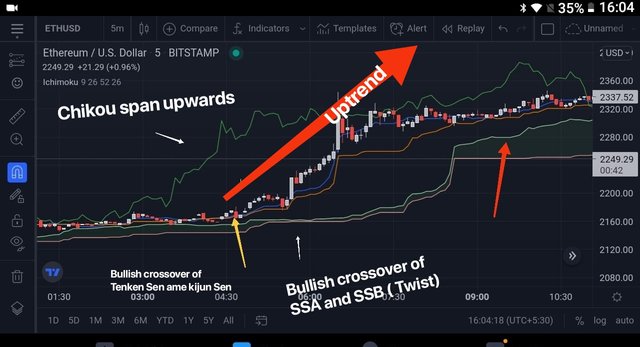
Look at ETH/USD cbart above, all the above mentioned parameters are full filled. So it is a valid option to place buy scalping orders and set stoploss and take profit. Multiple scalping orders can be placed during the whole trend.
Bearish market - sell strategy
Let's say, we want to sell a trade. So we will have to look for following points :
Bearish price action or market structure, because only than we will gain profit from sell trade.
Price line has to be below the cloud.
SSA must be below SSB or twist showing so
Chikou span must be directed downwards or crossed cloud from above downwards.
Tenken sen line below kijun sen or crossover showing so indicatea bearish trend.
Time frame must be small.
Look at ETH/USD cbart above, all the above mentioned parameters are full filled. So it is a valid option to place sell scalping order and set stoploss and take profit. Multiple scalping orders can be placed during the whole trend.
Conclusion:
Ichimoku kinko hyo is a comprehensive indicator, sometimes called trading system. It provides information about trend, support, resistance, buy/sell signals, magnitude of volatility, trend reversal and future price forecast. It also allows price comparison with previous price. When used along with other indicators like RSI to overcome its limitations , it acts as a trustworthy indicator. .
Hello @drqamu,
Thank you for participating in the 5th Week Crypto Course in its third season and for your efforts to complete the suggested tasks, you deserve a 9/10 rating, according to the following scale:
My review :
An article with excellent content in which you have provided a set of useful information to answer the questions posed, and I took some notes :
A clear explanation of the Ichimoku cloud and its lines, but it lacks depth in an analysis of some aspects.
Very often when the cloud twists after a period of trend, prices enter a range (in 75% of cases). The twist indicates a weakening of the trend and in no way a change in trend to come.
For your information the preferred strategy of Scalping with the Ichimoku indicator is called "Scalping Ichimoku in one minute M1", but we all know that the supports and resistances identified in the higher time frames will have a greater impact on the price trends. This is why the analysis of Ichimoku M15 and M5 is essential.
Thanks again for your effort, and we look forward to reading your next work.
Sincerely,@kouba01
Thanks for review and valuable suggestions.
You have been upvoted by @sapwood, a Country Representative from INDIA. We are voting with the Steemit Community Curator @steemcurator07 account to support the newcomers coming into Steemit.
Engagement is essential to foster a sense of community. Therefore we would request our members to visit each other's post and make insightful comments.
Thank you