Steemit Crypto Academy Season 3 , homework task for [ @lenonmc21 ] - Curso Dinámico para Principiantes – Semana 3 | Todo sobre las Tendencias, soportes y resistencias y patrones de gráficos simples.
Define in your own words what is a "Trend" and trend lines and what is their role in charts?
Trend and Role of trend.
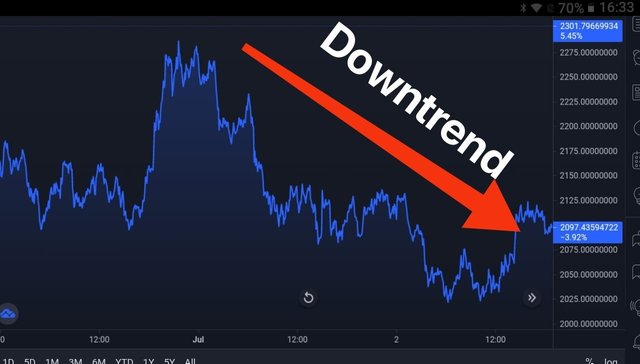
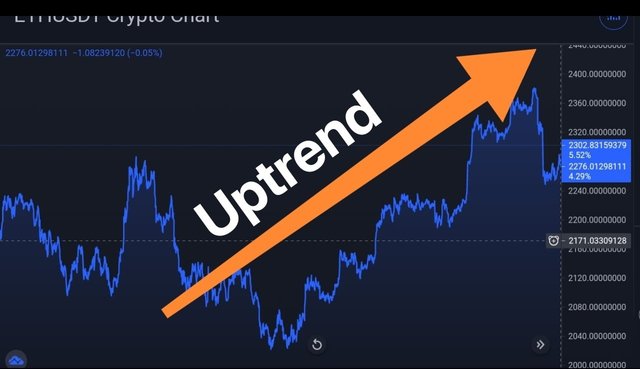
Trend refers to direction or momentum of an asset's price. So two possibilities arise for a price to move, either the price of an asset can go up or can go down, so the trend formed by the price movement in upward direction is known as a uptend and the trend formed by the price movement in downward direction is known as downtrend.
As price doesn't move up or down in a straight line, instead it does so in a zig zag manner. In an uptrend, the price movement results in formation of higher highs and higher lows whereas in case of downtrend the price movement results in formation of lower highs and lower lows.
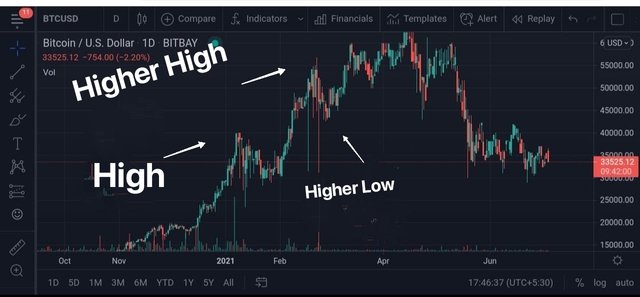
In the chart above, we can see that the price of BTC going up in a continuous pattern forming higher highs and higher lows .
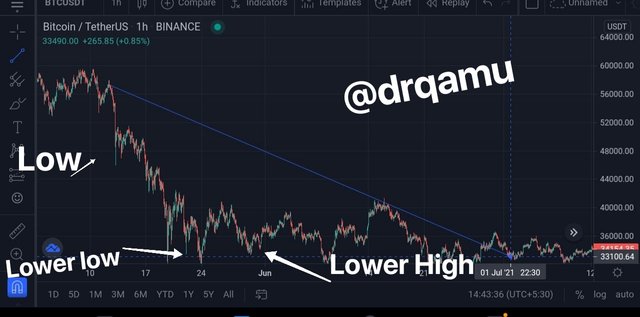
in the chart above, we can see the price of BTC going down, so forming lower lows and lower highs
As for role of uptrend and downtrend are concerned, they are used by traders to enter or exit from market. With the help of technical analysis indicators like support, resistance, RSI, MACD etc , traders spot their entry points in uptrending market and also set their target take profit level (Risk : Reward ratio) and book profit in uptrend. In downtrend market, traders sell their assets to prevent loss or can go for short selling and book profit in downtrending market also.
Trendlines and their role in a chart.
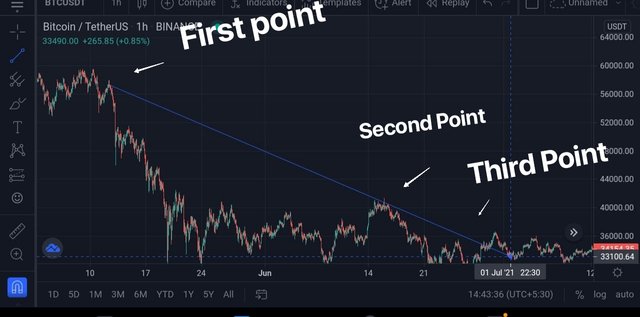
Trendlines as the name implies are straightlines drawn in the direction of trend between any three points. Although from mathematical definition of straight line, we know only two points are required to draw a line but for a line to qualify as trend line there must be test of the price towards the line and that counts as a third point of trendline, therefore the three points.
There are two types of trendline , Uptrend line and downtrend line . An uptrend line has an upward slope and is formed by joining two or more low points in and uptrending market whereas a downturn line has a downward slope and is formed by joining two or more high points in a downward movement of price. Technically speaking , we can say that , a trend line is formed by joining higher lows in an uptrend where as it is formed by joining lower highs in a downtrend.
As for role of trend lines on a chart is concerned, in an uptrend they act as a support whereas in a downtrend they act as a resistance. So these lions can be used by traders to buy or sell the assets. In addition we can see that trend lines can be used as stop loss and target for a trade.
Explain how to draw an uptrend line and a downtrend line (Show a screenshot of each).
Drawing uptrend line .
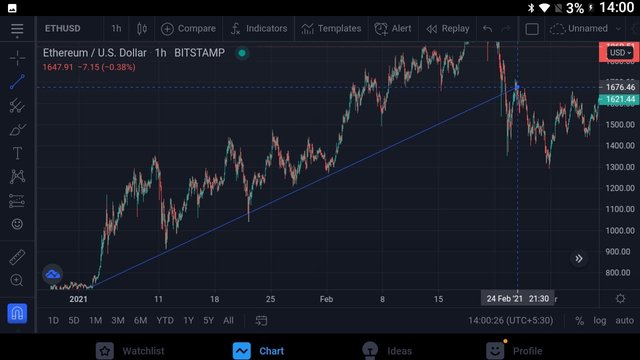
As mentioned above an uptrend line can be drawn in a market where price movement is upwards. It can be drawn by joining the higher lows. So to draw an uptrend line, we need to find two higher low points with at least one test point so as to qualify as trend line . So this line would act as a support line. As for time frames are concerned, higher time frames produce more reliable trend lines because to find a trend in market higher time frames are required. To gain entry or exit from the market, lower time frames are needed.
To draw downtrend line we need to find two lower high points with at least one test point in between . Care must be taken that trendline should not pass through the bodies of candle because that would then represent the break of the trendline.
Let me show you, how to draw trendines on trading view.
Go to Trading view and open the chart of any desired trading pair. For uptrend line, we need to find a bullish market.
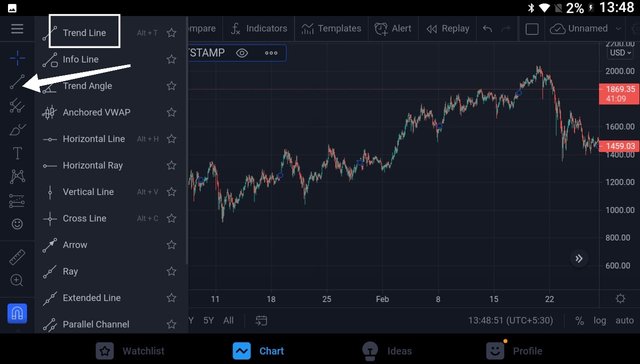
From left panel of option provided, click on icon as shown by arrow.
From the list of options loaded, click on trend line.
- A pointer wil load, move it to the first point and drop there.
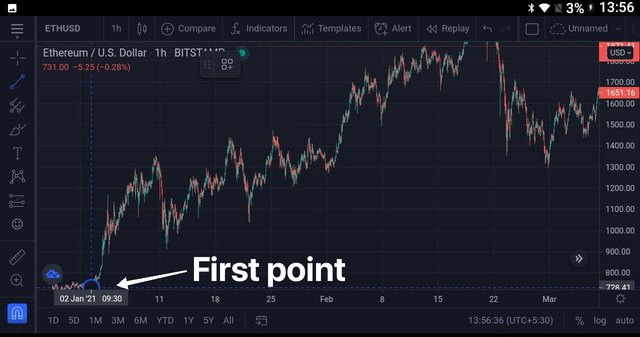
- Next move the pointer wherever you want.
- Similar holds true for downtrend line.
Define in your own words what "Supports and Resistances are and how we can identify both zones (Show a screenshot of each one).
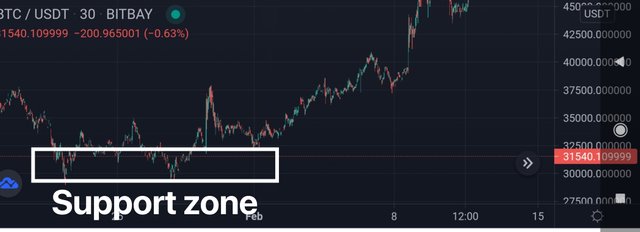
Support represents price level where downtrend is expected to pause due to concentration of demand and therefore we expect price to go up. So it can be used by traders to gain entry into the market.
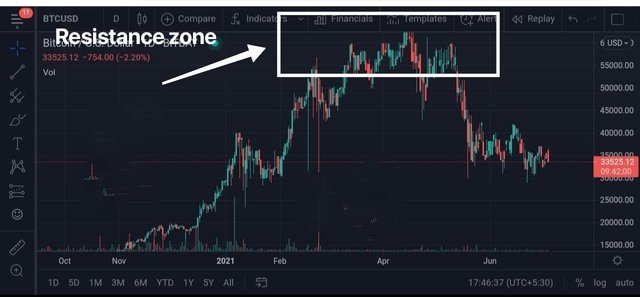
Resistance represents a level where an uptrend is expected to pause due to concentration of the supply or selling pressure and therefore prices are expected to come down. So it can be used by traders to exit from the market or book profit at this level
It is not mandatory that a price level continues between support and resistance but these points may be broken in continuation pattern. So in an uptrending market higher highs and higher lows are formed , so a support may become a resistance for next price peak , similarly in a downtrending market lower lows and lower highs are formed, therefore support may became a resistance for next price dip.
Explain in your own words at least 2 simple chart patterns with screenshots.
I'll be explaining chart patterns with the help of candlesticks. As candlestick chart are most commonly and widely used charts in the crypto market and scores of chart pattern exist. But I'll be mentioning two basic patrerns for this task.
Double Top pattern.
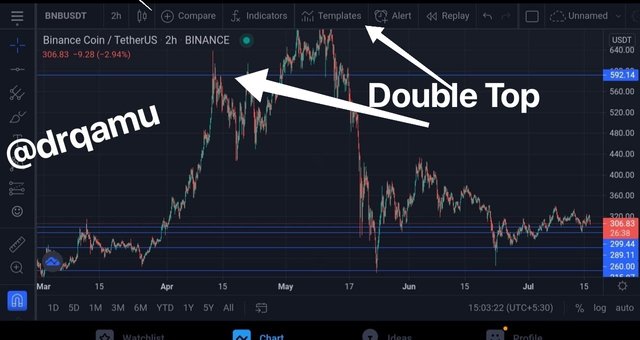
Double top pattern as the name implies is a chart pattern in which two price peaks of roughly same price are seen on a chart and are usually seen at the top of a bullish market. Double top can be understood as, buyers are dominating till first peak and than sellers dominate causing pullback and than again taken up by buyers and than the patrern reverses. Double top pattern suggests reversal of trend , so those who invested in the asset can exit to avoid loss.
Double Bottom pattern
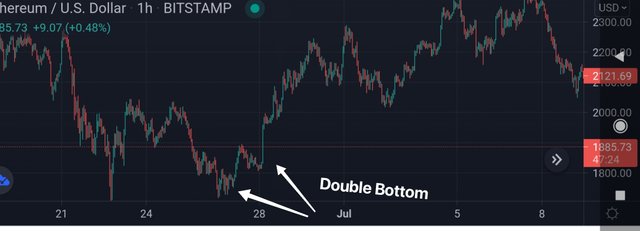
Double Bottom pattern is similar to double top but in reverse direction. It is formed at bottom of downtrend. In this pattern two minima are seperated by a small peak. It means bulls are preapring to overcome bears and is signal for an upcoming price hike. So on sighting this pattern buyers take it as opportunity to enter the market.