Steemit Crypto Academy | Season 3: Week 7| Homework post for @yousafharoonkhan || How to create an account on TradingView, how to use indicators,tools, features of tradingview
Defining the TradingView site and how to register an account in tradingview? what are the different registration plan?(screenshot necessary)
Tradingview is an online charting platform used to analyse charts of stocks of all the sectors , commodities, cryptos and forex etc of the global markets. The platform is so comprehensive that it allows adding multiple indicators , marking of charts with trendlines, horizontal lines, info lines, traingles, rectangles etc. As of now, it is the best available platform for traders , investors, youtubers, tutors . It is available in web version as well as apps for Android and ios users. Along with its usage for trading purposes, it is used for educational purposes by youtubers and tutors. I am taking online stock market coarse on zoom app where we are taught through trading view. We shall discuss about its features in subsequent sections for better understanding.
How to register?
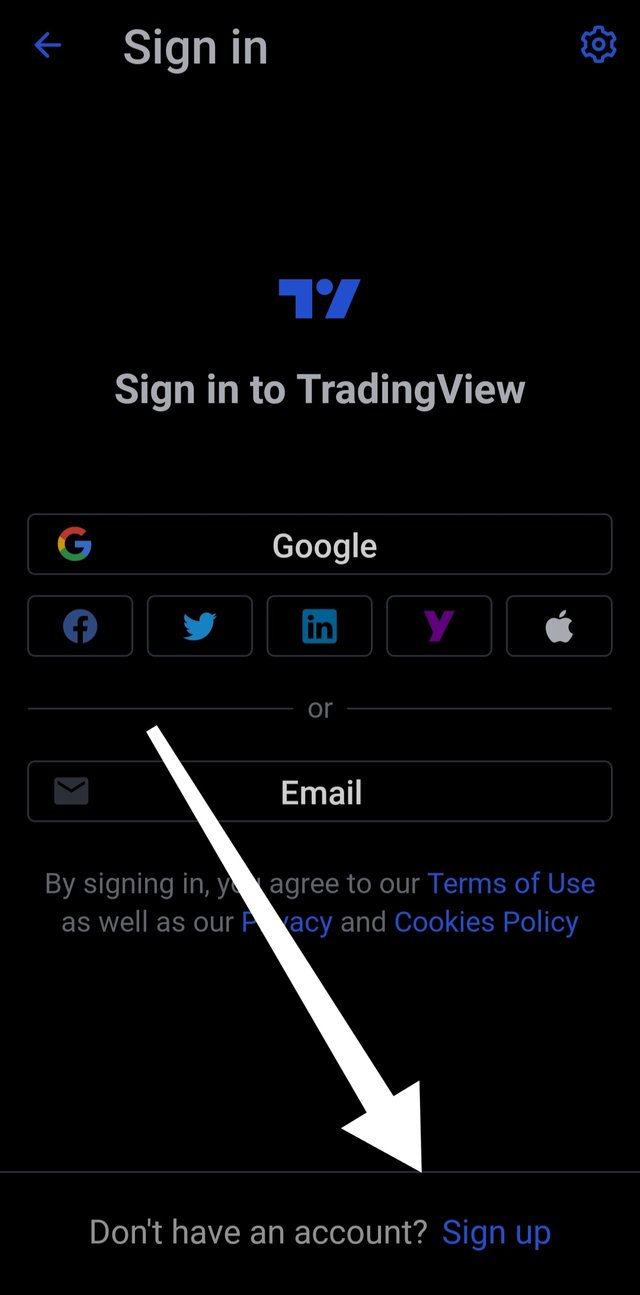
Let me demonstrate it with the help of trading view app. Launch trading view app and click on,, create new account.
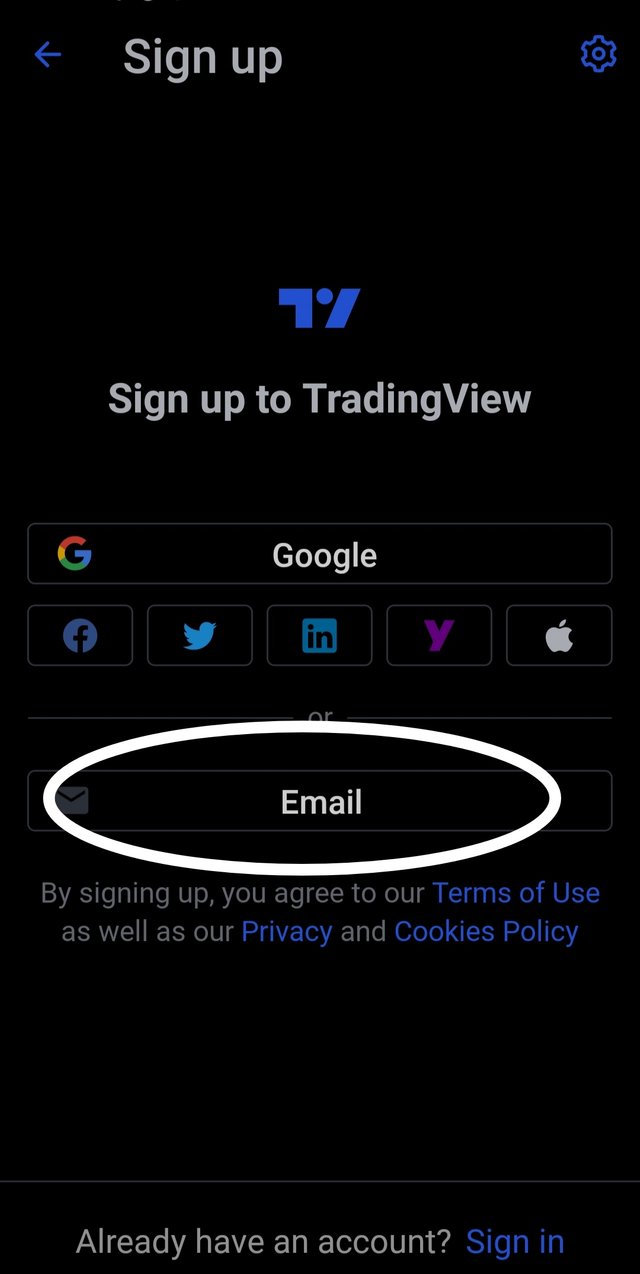
Next we choose mode of log in, i choose via email. We can enter via social media platforms like Facebook Twitter etc.
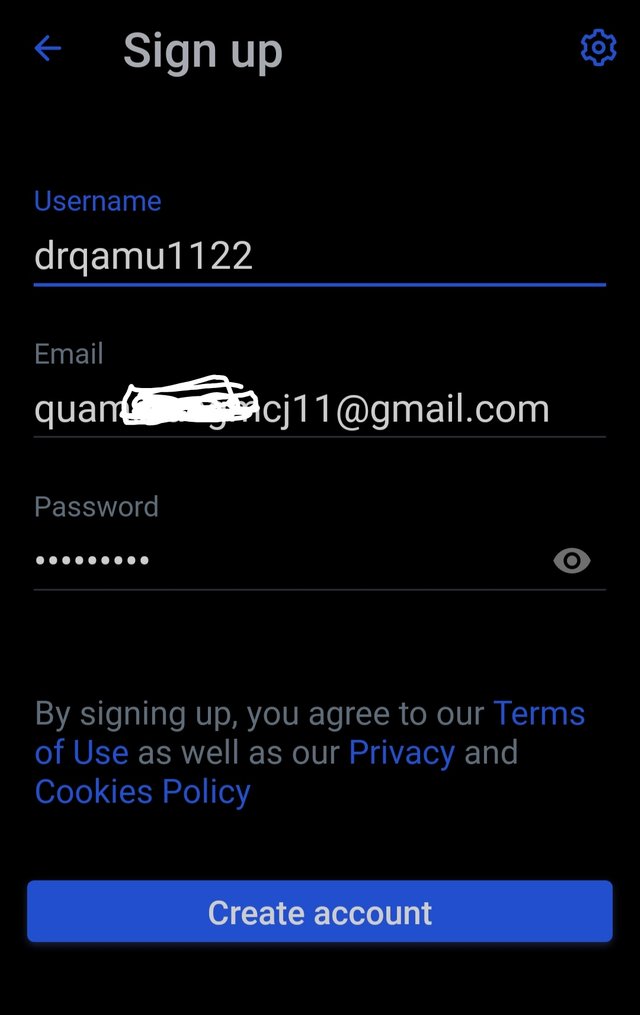
Enter details like email, password
and agree on terms of service and click continue.Verify captcha
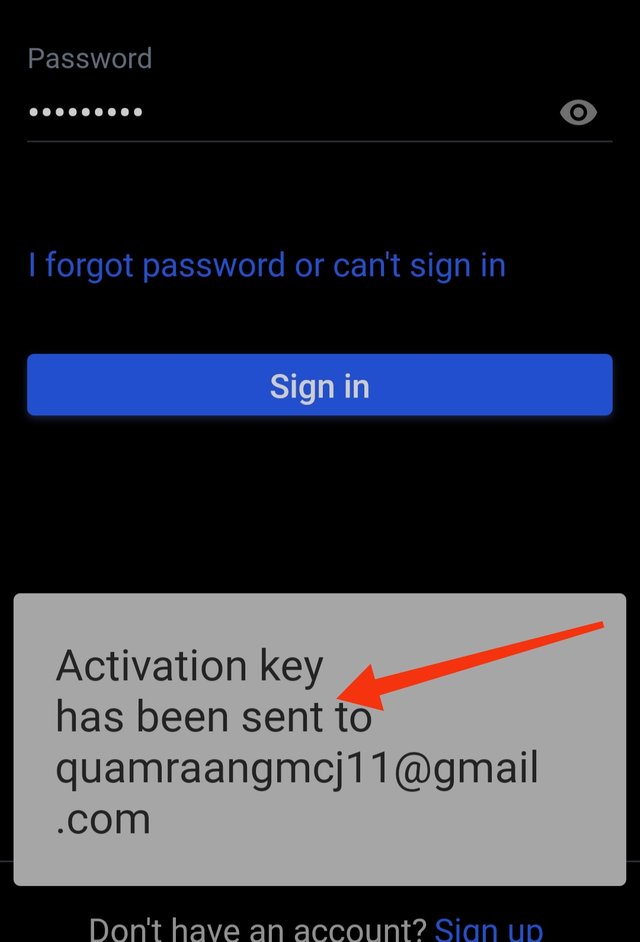
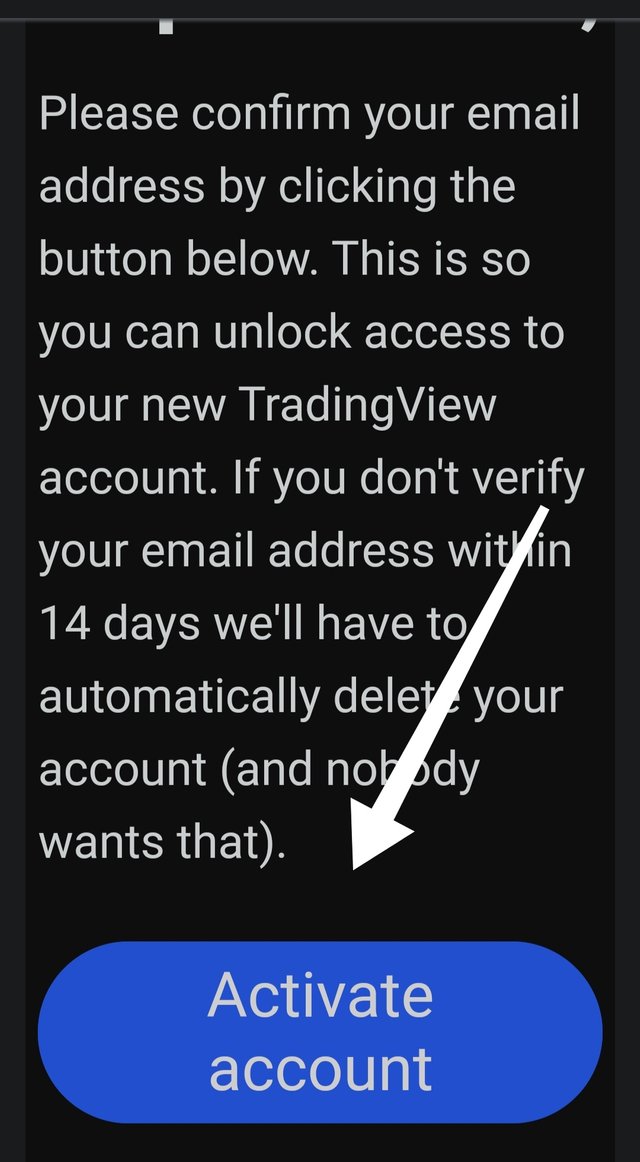
and click on create account.An activation e-mail link will be sent to given email id.
Open link to activate account and we are into tradingView free basic account.
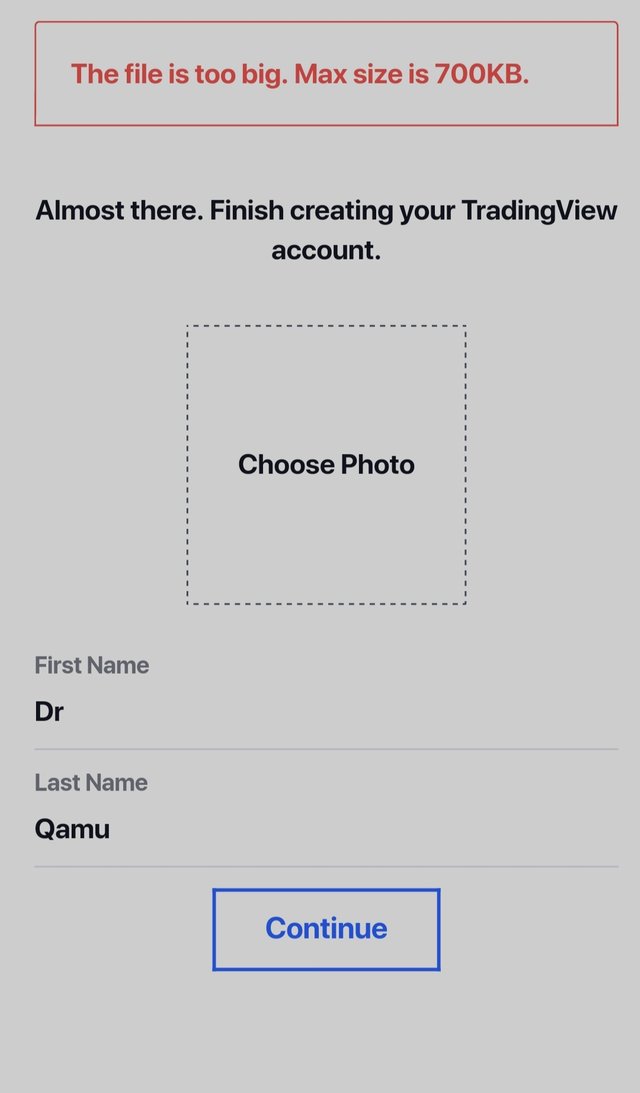
Next we have to enter details like first and last name, profile picture.
We are done.
Registration plans.
By creating account, we are in basic free plan where we have access to some Basic features. As a beginner free version does suffice. But as a trader or youtuber or tutor, we may need some other plans with advanced features like pro, pro + and premium for which we have to pay monthly or annually. For 30 days, any plan can be tried free of cost.
Pro plan
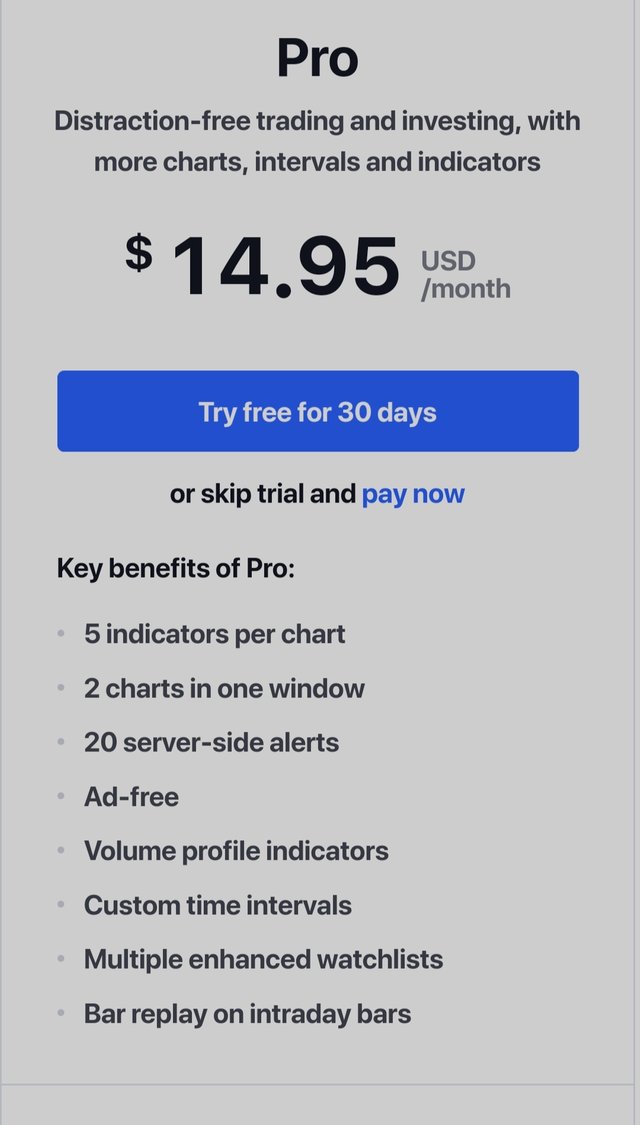
As seen in screenshot above, pro plan entitles us to following benefits :
- Five indicators per chart - It may involve any combination of overlay or oscillating indicators.
Two charts in one window - it helps. In comparison of assets.
20 server-side alerts
Ad-free - No disturbance by plan ads as seen in free basic plan.
Volume profile indicators in addition to 3 indicators listed above
Custom time intervals
Multiple enhanced watchlists
Bar replay on intraday bars
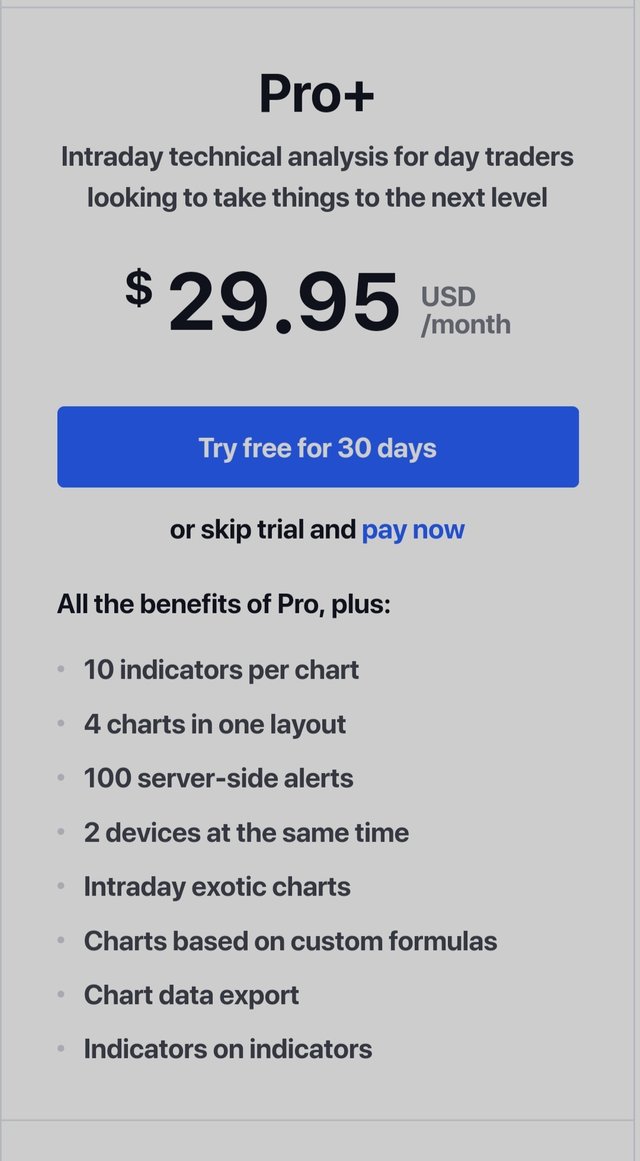
Pro + plan
Features are shown below. It allows usage of more indicator, windowws and also allows sharing of plan on two devices. If you can't afford plan individually, you can take it with your friend and both will be benefitted with all the features.
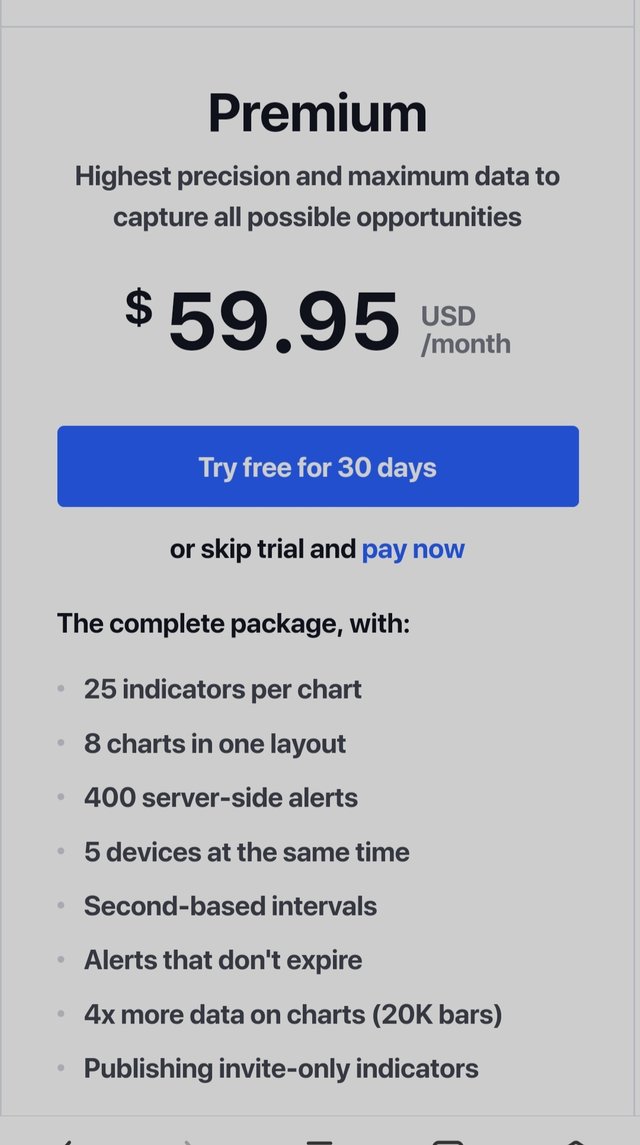
Premium plan
Features shown below are more advanced than pro + and it can be shared with 5 people at a time.
Explain the different features of tradingView and what is your favorite feature and why?(screenshot necessary)
Tradingview is a feature rich site. It provides so mamy features that, it is confusing for beginners. However, we will discuss some important features of site that we use on day to day basis excluding screener and markets already explained by professor.
Watchliat
When we open trading View app, at the bottom panel of the launch page , we get to see some options and they are "watchlist", "charts ", "ideas" , "chats" and "profile" from left to right. Let's begin by discussing watchlist .
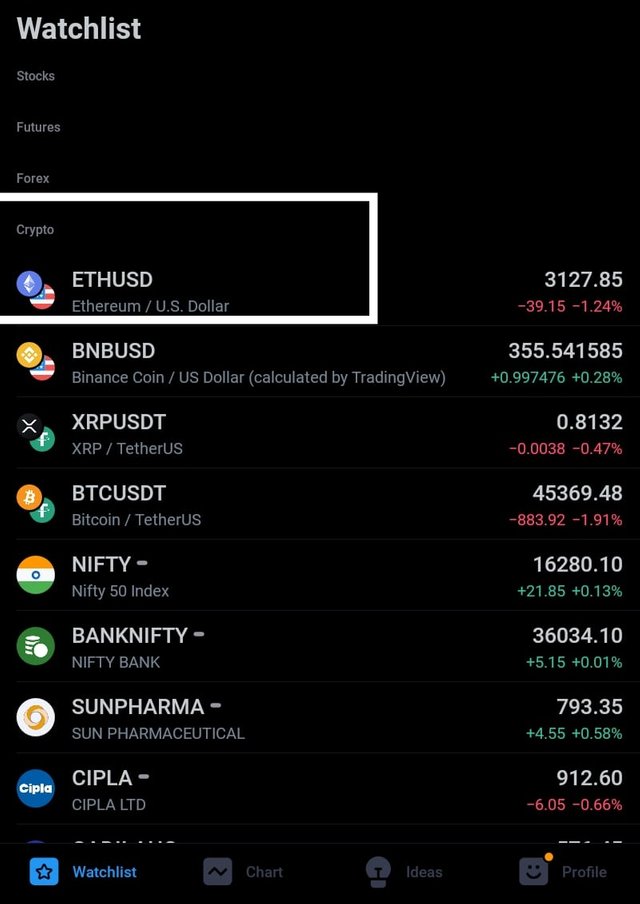
Watchlist is your personalised list of stocks, commodities cryptocurrencies, forex currencies etc. You can add your favourite assets to the watchlist and they may be available for you at the single click . You need not search for them everytime you look for them.
When we click on watchlist , at the top right corner there is an icon, click on it and search for your favourite asset and add to your list and to delete any item from your watchliat, scroll left over the item and click delete. Moreover, you can also personalise your stocks as per their price or price change, symbol etc.
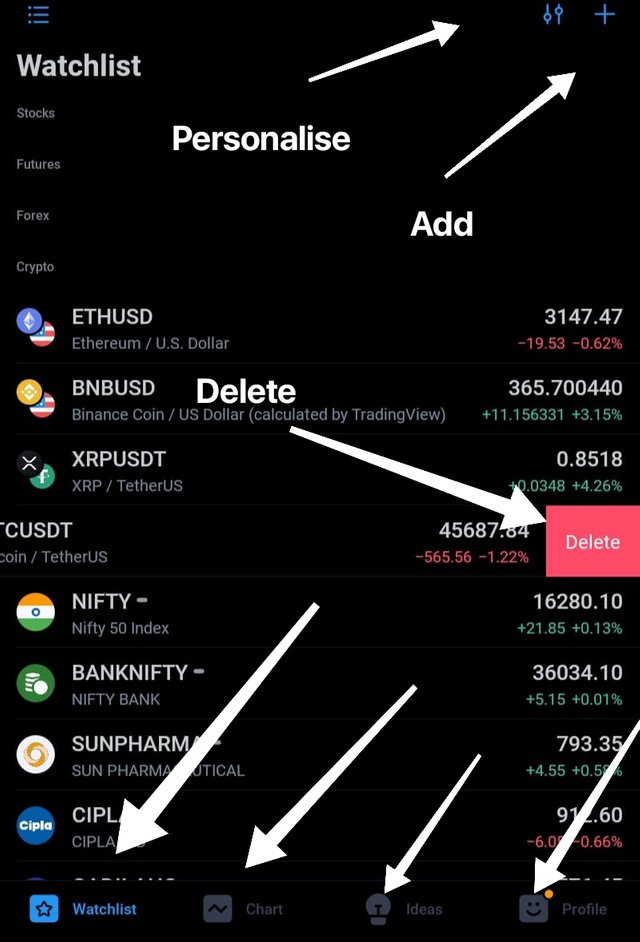
My watchlist
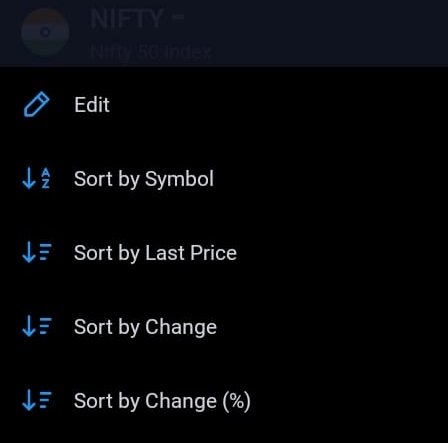
Watchlist personalisation options
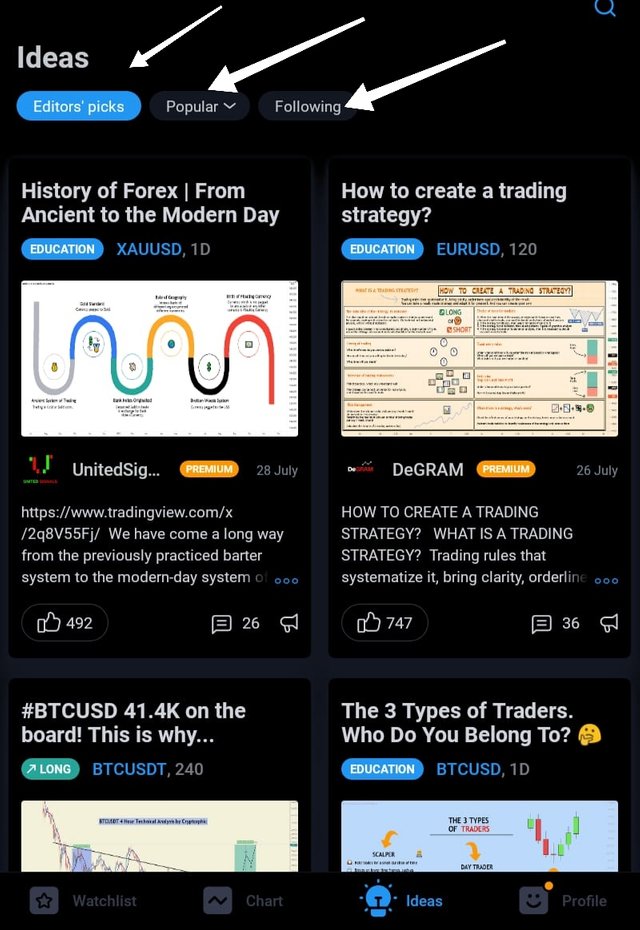
Ideas .
Here we see trading related ideas shared by others. It is a sort of social media platform where we have three options to choose from like editor's picks, popular and following. Under these three sections, we have posts choosen by editor, popular posts and posts shared by people you follow.
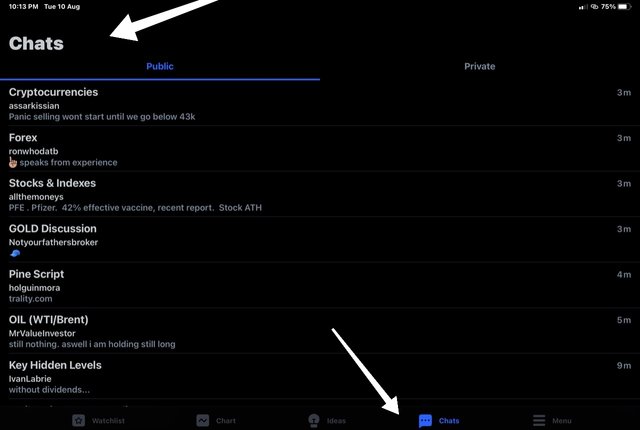
Chats
It is very interesting feature of trading view. When we click on chats, we get list of sections where people interact with each other on different issues in a casual manner. At times, we get interesting advices from people.
Profile
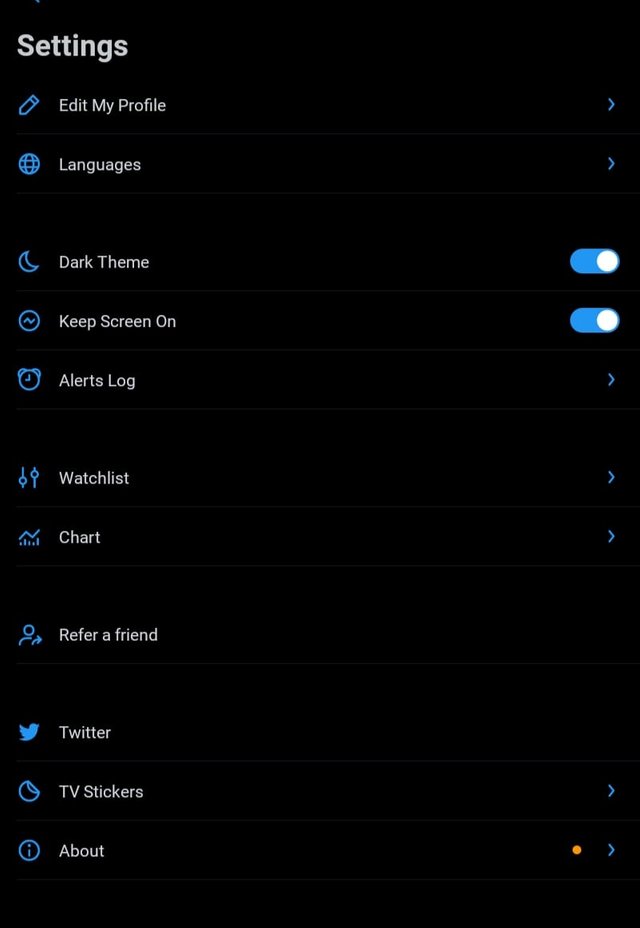
Here we have our published posts, followers, following, reputation. In the same section, at the top right corner we have app settings. When we click on settings, we get a list of settings related to app.
Charts
The feature for which trading view is famous. Click on charts and select the trading pair and explore the chart page .
Top panel .
Starting from top left, we have name of trading pair. We can click on it and chamge to other if we want.
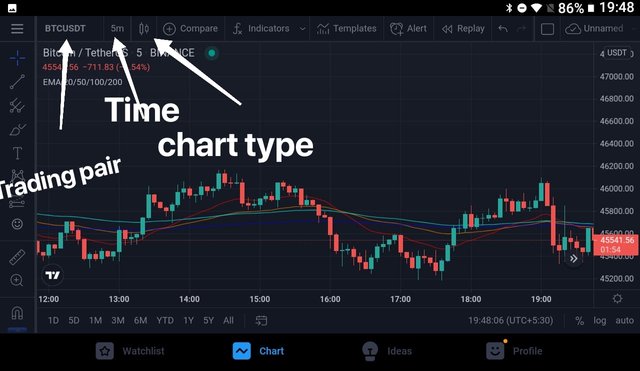
Next we have time frame on which we are viewing chart like 5 min in my case. If we want to change time frame, we have to click on it and a drop down memu will appear from which we have to select the desiree time frame.
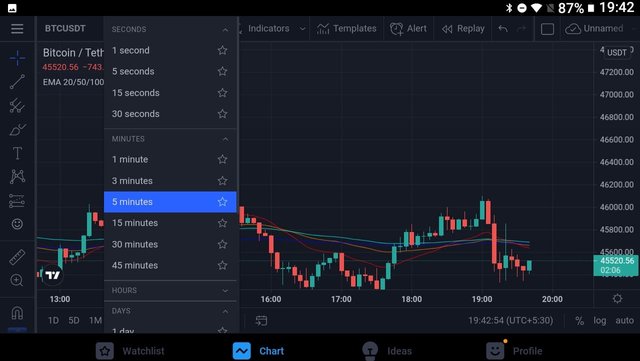
Time frame
Next we have a symbol of chart type as in my case candlesticks icon is there as my chart is candlestick type. When we click on the symbol of chart type, we get number of options to use like hollow candles , line , area, baseline etc. We can choose any type of chart we want.
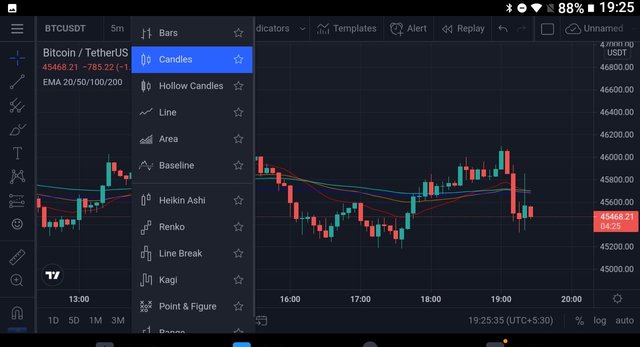
Chart type
Next we have option "compare" . Here we can compare between charts.it is very less commonly used.
Than we have indicators, the most important option of the panel. We will be discussing this option in next question.
Than we have templates which is not commonly used. After that we have alerts. We can set price alert for any token by clicking on alerts options.
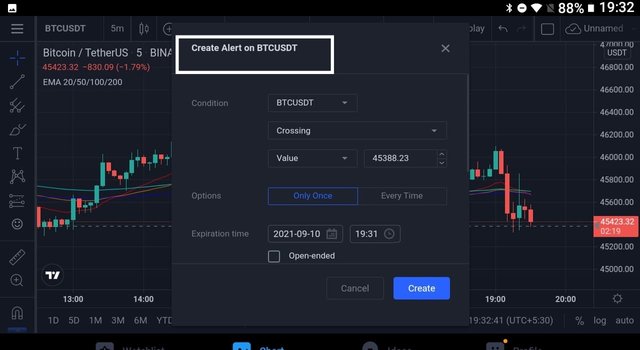
Alert option
Towards right end of the panel, we have settings option . It contains some important chart settings as mentioned in concerned section.
Left panel
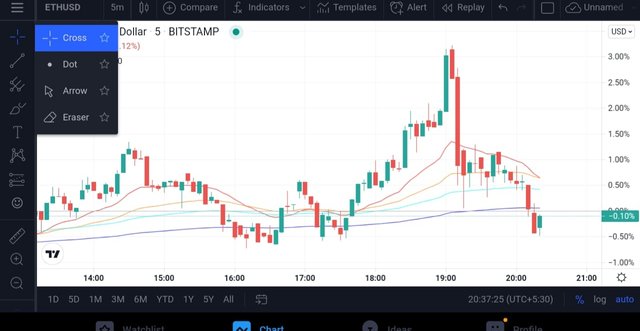
At the top left, we have a plus or cross sign, if we click on it we get option like cross, arrow, dot and eraser . We can use them wherever needed.
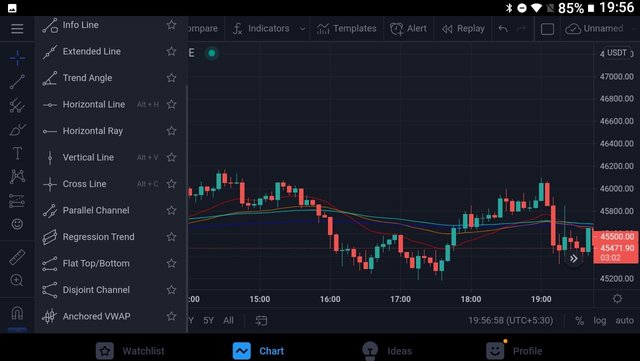
Next we have trend line. Click on it and we get options like Arrow , Info line , extended line, trend angle, horizontal line, horizontal ray, vertical line, cross line , Parallel channel etc . We can use these tools on charts as per our needs.
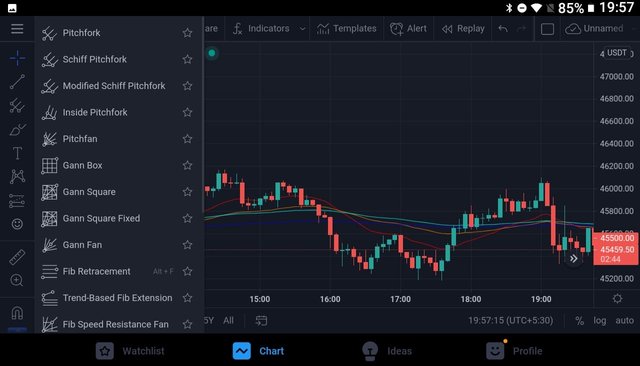
Next we have pinch fork and other similar tools as shown in image below.
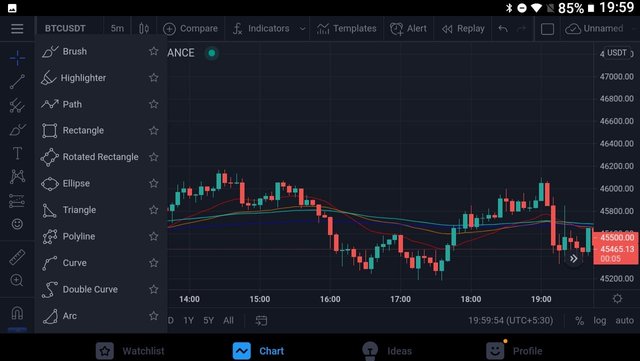
Than we have other tools like brush, rectangle, traingle, curve etc.
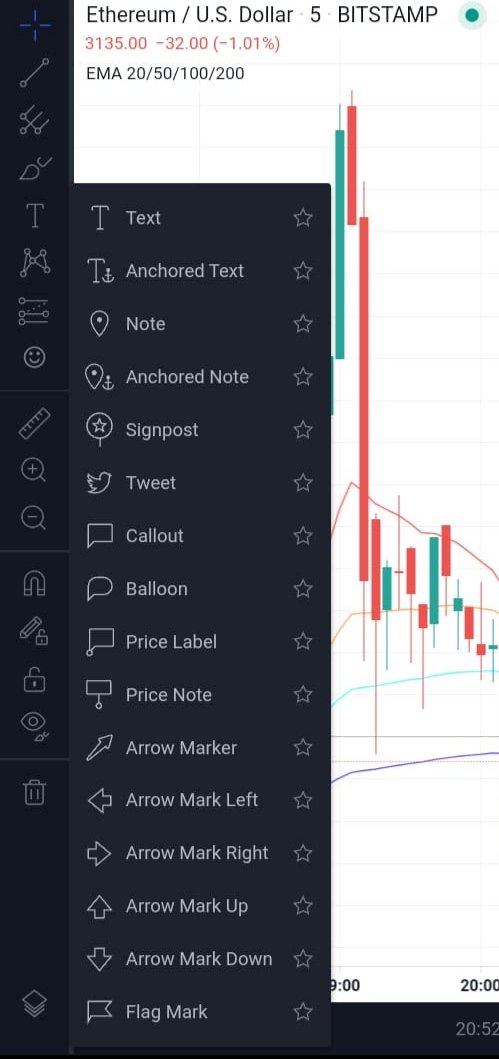
Next we have option to add text to chart and different text stlyes are there which can be used.
Next we have some rarely used option untill we reach bottom of panel where we have delete option. On clicking it, we get option to delete indicators , drawings or both.
Bottom panel
Ww have nothing much to go through, we have data range where we select the time range for which we want to infer the chart. We can also select time zone from panel.
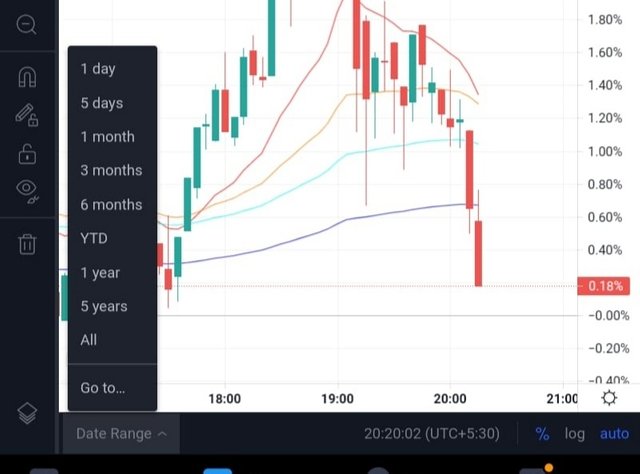
Data range
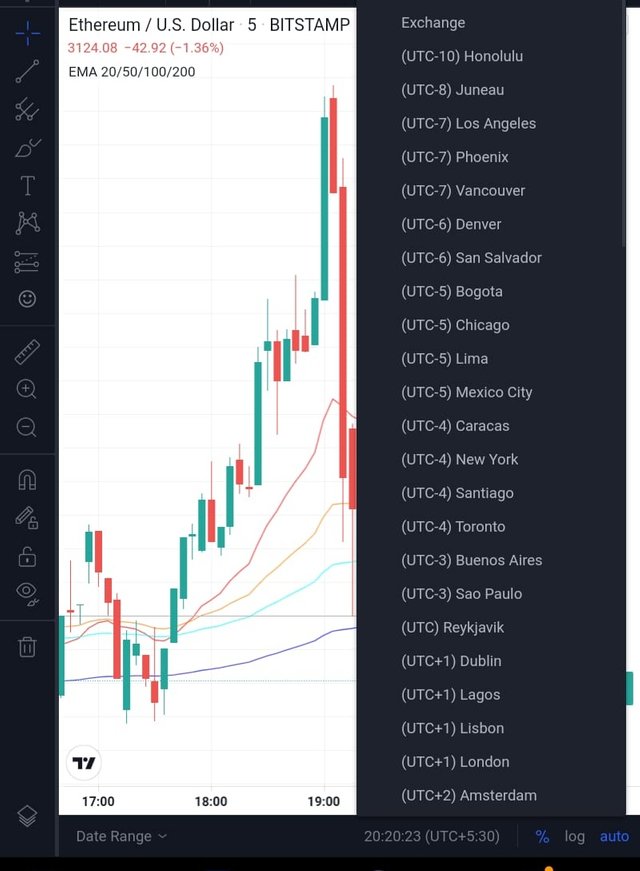
Time zone
The feature that i like most is ideas section. We all use charting and tools but in addition to that trading view has some important features like chats and ideas. I like reading articles on ideas section because they are written by experienced people. The content provided in articles is amazing and very informative.
How to set up a chart in TradingView and use two tools to edit it.(screenshot necessary)
As mentioned in the definition above that it is a charting platform, although it is much more than that but it's primarily used for that purpose by all the traders and investors.
To set a chart of any crypto pair , we go to charts section . Click on charts . Select any trading pair you wish to look for. Chart will load immediately.
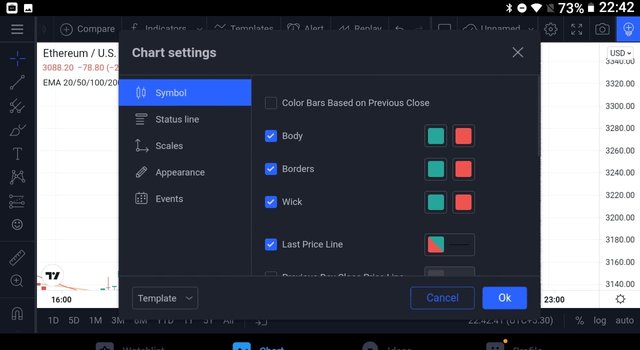
We can configure price chart as per our choice like color of candlestick, body , boarders etc.
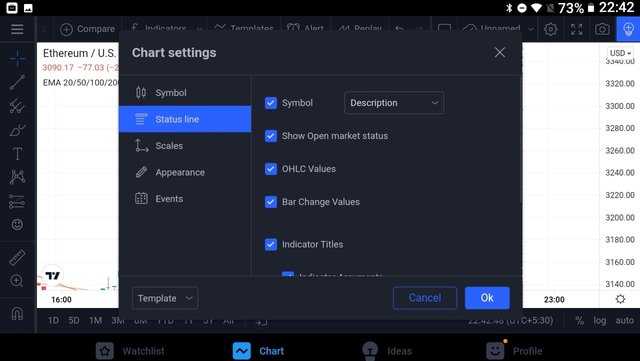
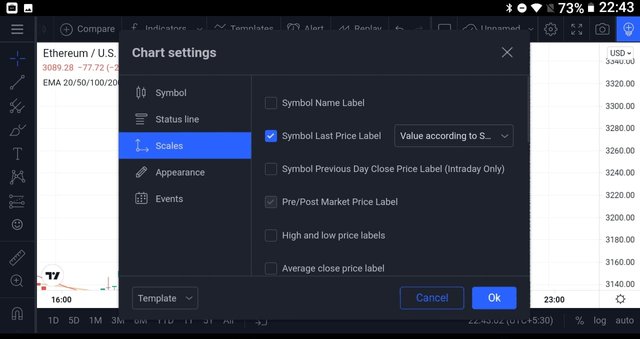
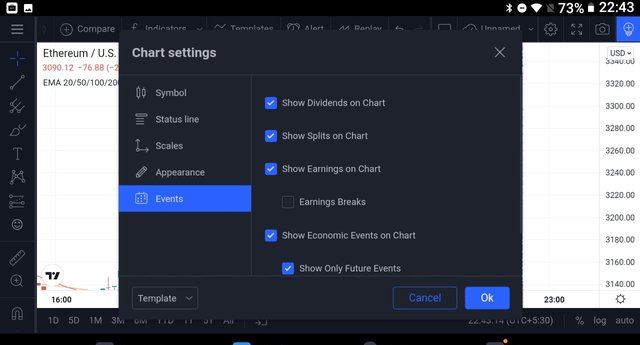
To configure chart, we go to setting option at the top right. When we click on the setting , a panel of options load related to symbol of chart type, starus line, scales, appearance, events. Each of these sections have their own settings like in symbol we get to select color of body, wick, borders etc. Other sections have subsections too.
Two editing tools.
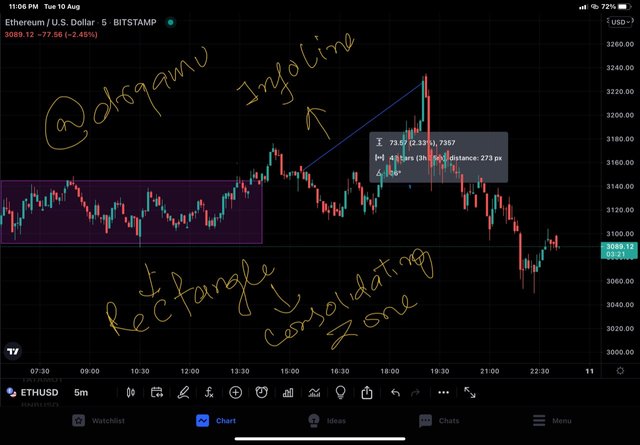
In the chart above, i have used a rectangle representing a zone of consolidation and we can see the market went up after breaking resistance . Another tool that i have used is info line which gives information about price percentage from one point to other, angle elapsed, number of bars in between.
Explain how to add indicator in chart, what is your your favorite indicator and why? (screenshot necessary)
I'll be using trading view app. You can do it from official website of trading view too. I launched trading view app.
Select any trading pair. Chart of the pair will load.
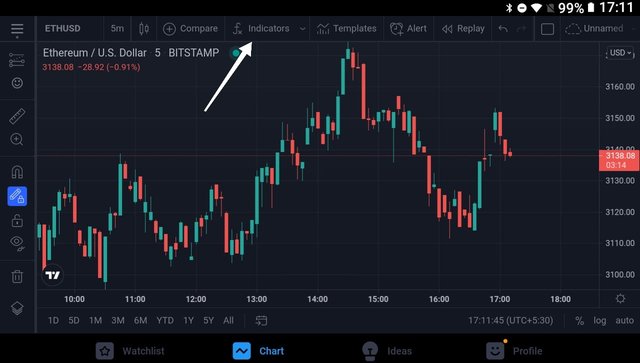
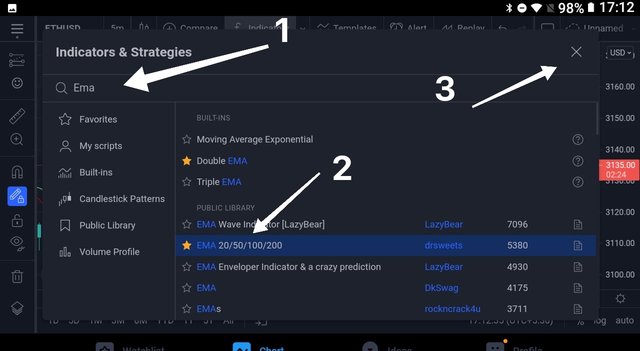
Click on indicators from the top menu.
Next we type name of indicator in the search box provided and select same Indicator from the suggestions. Go back to your chart and you will find indicator loaded at bottom of your chart.
Configuration of the indicator.
Double click on Indicator and chart settings will load.
Style settings -
Here we can choose color and precision of indicator.In the Inputs settings, we have indicator timeframe and length.
In the visibility, we have seconds , minutes, hours, days, weeks, months. Keep default settings for visibility.
My favourite indicator .
My favourite indicator is exponential moving averages because it has given me good profit in crypto as well as stock market. I use combination of 4 moving average and they are 20/50/100/200. I mostly use EMA 50 and 200 on 5 min and 15 minutes timeframe and look for crossover. Most of the times when 50 MA crosses above 200MA , it gives good profit and when reverse happens, sell position is profitable. I think we have discussed this indicator in crypto academy earlier. Let's see if this indicator works:
BNB/USDT
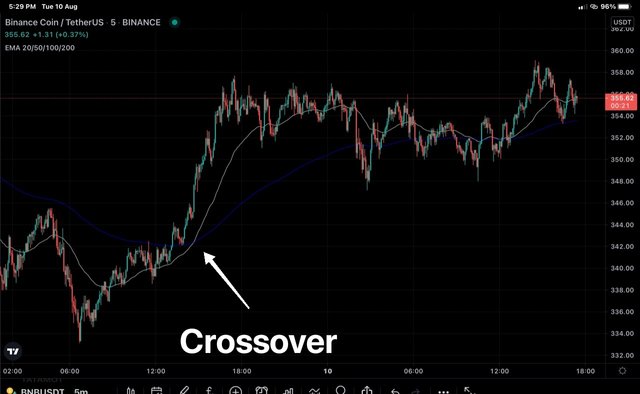
In the above BNB/USDT chart, we can see the golden crossover and the bullish trend that followed thereafter was highly profitable. I have myself traded multiple times on the same crossover .
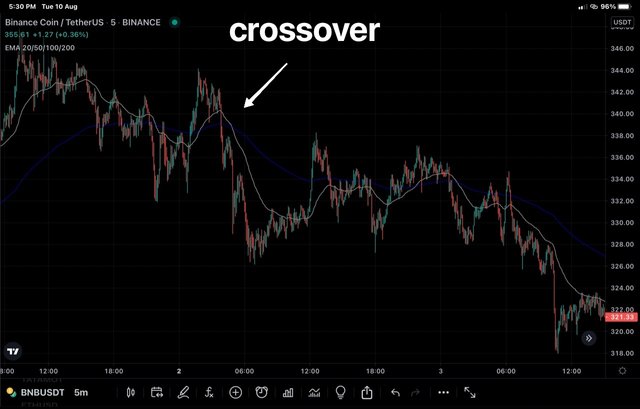
In the above chart, we saw the death cross thar occured and the bearish rally of price that followed would have been very profitable.
Do you think TradingView is useful in predicting the market for cryptocurrency (trend / price)?
Trading view is undoubtedly very useful in predicting market because by looking at charts we get a visual picture of trend and its direction. Addition of indicators and editing of charts further add value to the chart and increase chances of successful trading.
Imagine a situation where you are asked to trade and you are given the numerical values like current price of an asset , previous close, previous high etc. Would you be able to judge the market movement by looking at the numbers? Certainly not , all this is becoming possible when we have a picture of price action in front of us which is further specialised by adding indicators and editing the charts as per our experience and convenience. As all these features are available on the tradingview , it is therefore very useful for trading stocks , Forex commodities etc.
Conclusion
Tradingview is a comprehensive charting platform that is available in the web version as well as app for Android and IOS globally and shows information about the global market. It has different plans that are arranged in the ascending order of increasing features and traders choose as per their needs and therefore make use of the platform to the best of their experience. Not only the charts but the comprehensive list of the indicators and editing tools available on the platform also add value to it.
Respected first thank you very much for taking interest in SteemitCryptoAcademy
Season 3 | intermediate course class week 7
thank you very much for taking interest in this class