[ROC indicator] - Crypto Academy /S4W8-Homework Post for kouba01
Hello lovely people around the globe, hope you are all doing well. Today I am writing homework task for professor @kouba01 , which is about Rate of change indicator.
In your own words, give an explanation of the ROC indicator with an example of how to calculate its value?And comment on the result obtained.
Rate of change indicator as the name implies represents chamge of variable over a particular period of time. The variable here is price . It means that ROC indicator represents change in price over a period of time and that change in price is represented by percentage. So ROC measures price of current period with respect to the pervious period under consideration. It can be either positive or negative . ROC is positive, if price of current period is higher than that of previous period and similarly ROC is negative, if price of current period is lower than the previous period under consideration. So numerical value of ROC will range from minus 100% below to infinity on positive side. However, infinity is impracticable but the point is to get the concept. The current price of an asset on negative side when compared with its previous value cannot fall below minus 100% because if price drops to zero, that will give ROC as minus 100. It does not mean that the price cannot fall below its previous value in isolation. If you look at the isolated price of an asset, it can make new low. However, on positive side price can go up to yield numerical values even more than 100%.
ROC is a momentum indicator that reflects momentum of a trend, strength of a trend, predict reversal of trend and also show overbought and oversold zones. The exact working to provide above trading signals shall be discussed in subsequent sections.
Calculations of ROC
Understanding the mathematical calculation behind any indicator help us in better understanding the working and the purpose of the indicator. ROC has simple formula of calculation and that is:
ROC = Current value minus previous value divided by previous value multiplied by hundred.
ROC = Current value -
Previous value/ Previous value
x 100
Let's say, current value of an asset is X and previous value is Y.
ROC= X - Y / Y * 100
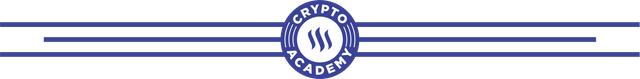
Previous value refers to the value of period under consideration. For example, on daily chart, ROC set over 9 periods would provide previous value as 9 days old value with respect to current value.
Current price = $459.2
Previous price = $449.4
ROC = 459.2 - 449.4/ 449.4 * 100
ROC = 9.9/449.4 * 100
ROC = 2.2
That is exactly there on the ROC curve.
Demonstrate how to add the indicator to the chart on a platform other than the tradingview, highlighting how to modify the settings of the period(best setting).(screenshot required)
For this task, I will be using my Kucoin account to show CMF indicator and its configrarion.
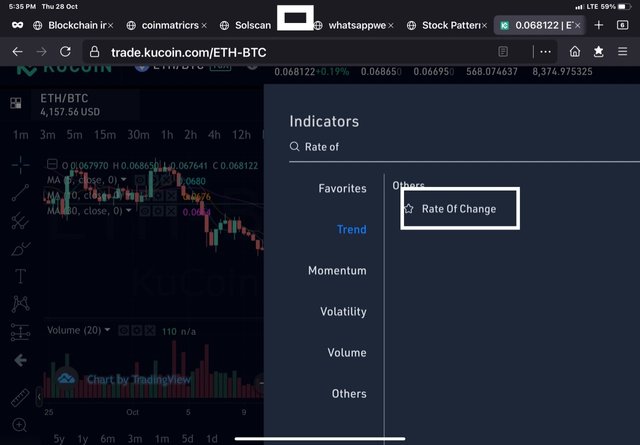
Go to kucoin official website https://m.kucoin.com/ and log in to your account. Default trading pair is BTC /USDT . We can change it by clicking on trading pair.
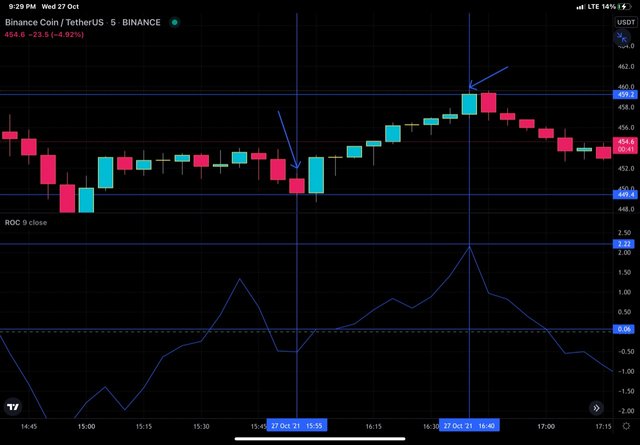
Next we click on indicator icon as shown below. A list of indicators will open . I searched for target indicator and selected Rate of Change .
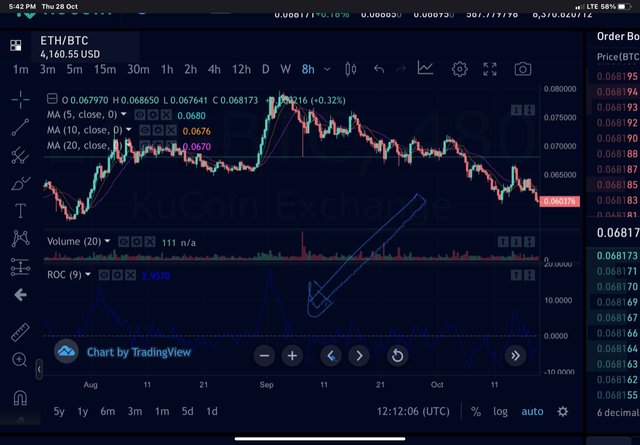
Go back to chart and ROC Indicator will be seen below the chart.
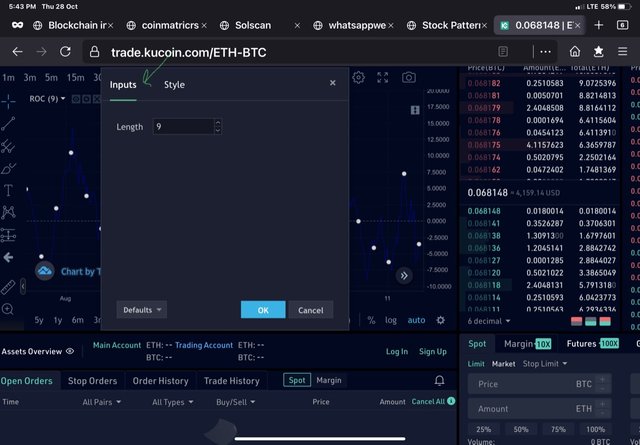
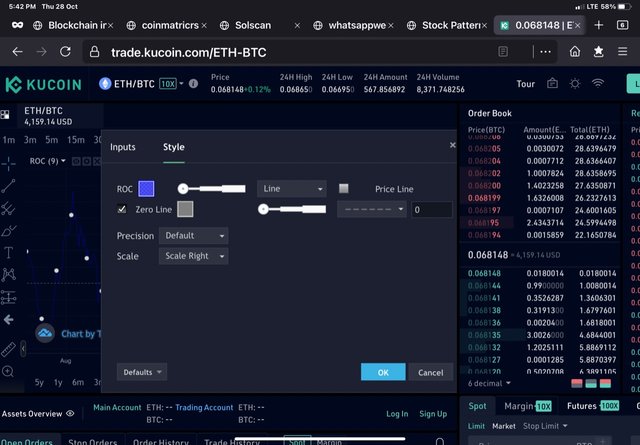
To configure the settings of indicator, double click on the indicator and setting will load. We have inputs and style setting. In input settings, we choose length and in style settings we got to choose color, precision and scale as shown below.
The default settings includes input length of 9 periods. Mostly 12 and 25 periods are used by traders for short term and long term trading. However, it is not fixed. Traders can alter it as per their trading style. So periodic length will depend upon trading style.
What is the ROC trend confirmation strategy? And what are the signals that detect a trend reversal? (Screenshot required)
ROC is a simple indicator that oscillates about its mean ( zero line). Movement above zero line yields its positive value while as movement below zero line yields its negative value. Uptrend or bullish trend on ROC is reflected by movement of ROC from below upwards such that it crosses the zero line and stays in positive zone but for confirmation of bullish trend, price must show upward movement too or slowing down of its down movement.
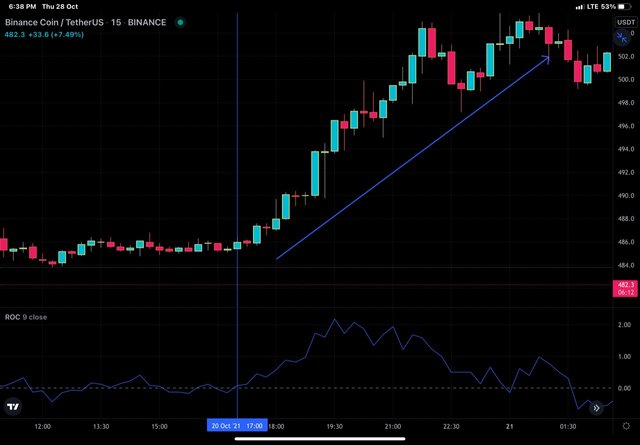
ROC showing Bullish crossover and price follows
In the chart above, we can see that ROC crosses zero line and price is also moving up and than the bullish rally followed.
Downtrend or bearish trend on ROC is reflected by movement of ROC from above downwards such that it crosses the zero line and stays in negative zone but for confirmation of bearish trend, price must show downward movement too or slowing down of its upward movement because the ultimate governing factor is price. Indicator won't make any impact , if price doesn't follow as it is change in price in favourable direction that is going to determine success of trade.
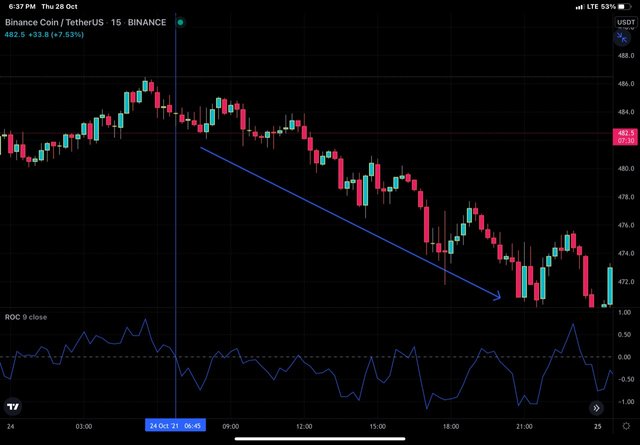
ROC showing Bearish crossover and price follows
In the chart above, we can see that as ROC crosses below zero line, price also started falling and than bearish rally of price followed.
Trend Reversal.
Trend reversal means change of trend from the bullish to bearish or vice versa. It is not always mandatory that a bullish trend will be followed by bearish and vice versa. There may be a phase of consolidation or indecision in between. ROC reflects trend reversal when the up or down moving ROC line starts flattening before actually reversing its direction. Secondly, indecision will be seen as wavy movement of ROC within more or less well defined boundaries.
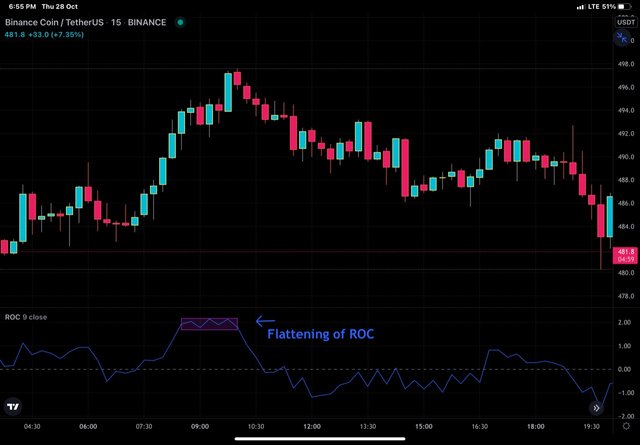
Flattening of ROC before reversal
Another parametre of ROC which shows trend reversal is overbought and oversold zones as we shall discuss later.
What is the indicator’s role in determining buy and sell decicions and identifying signals of overbought and oversold؟(screenshot required)
Buy position is taken by trader when there is bullish trend in the market and that is reflected by steep up movement of the price line from below upwards. But decision cannot be taken on the basis of ROC line alone. It has to be reflected on price line as price moving up or there is slowing of downward move of price if it was in downtrend earlier.
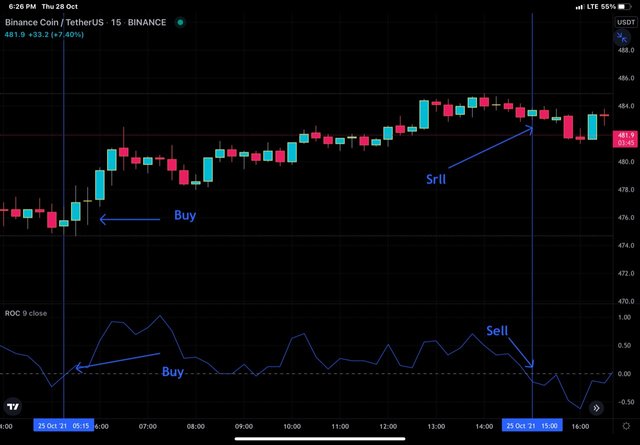
Buy/Sell position on the basis of ROC
Sell position is taken by trader when there is bearish trend in the market and that is reflected by steep down movement of the price line from above downwards. But decision cannot be taken on the basis of ROC line alone. It has to be reflected on price line as price moving down or there is slowing of upward movement of price if it was in uptrend earlier.
Overbought and oversold zones are the areas where in the price of an asset is perceived to be more and lees respectively than its intrinsic value and therefore traders start taking appropriate actions. On the basis ROC, a spread of +/- 3 to 4% is interpreted as an overbought or oversold zone, However , it is not always mandatory that the trend may reverse exactly at such demarcations. At times price does push further up or down in corresponding zones even after crossing above mentioned values. So for action taking, price is ihe trigger.
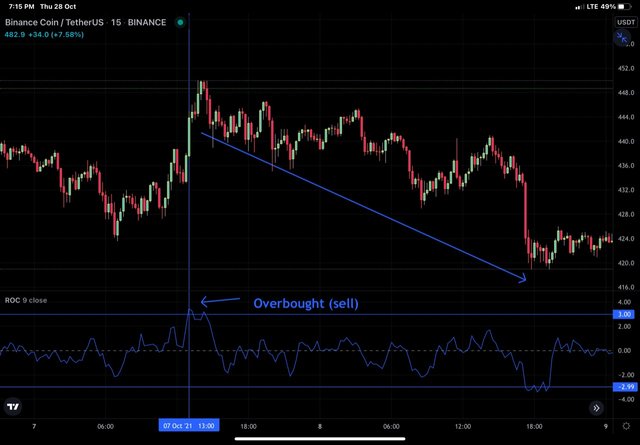
ROC touching +3% and therefore indicates overbought zone and is therefore a sell signal
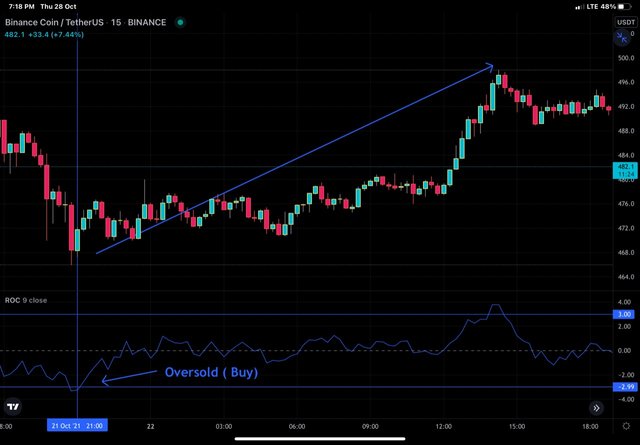
ROC touching -3% and therefore indicates oversold zone and is therefore a buy signal
When ROC shows + 3 to 4 % spread , it indicates overbought zone and if the price is slowing down its upward move, it indicates forthcoming fall and is sell signal. Similarly, when ROC shows - 3 to 4 % spread , it indicates oversold zone and if the price is slowing down its downward move, it indicates forthcoming rise and is sell signal.
How to trade with divergence between the ROC and the price line? Does this trading strategy produce false signals?(screenshot required)
Divergence refers to asynchronization of ROC and price action. Mostly we see that ROC and price action make similar moves. As price moves up, ROC also moves up and as price decreases ROC moves from above downward. So we can say , most of the times ROC and price action synchronise with each other. At times, variation of normal phenomenon is seen and that is known as divergence.
When the price of asset is moving up such that it makes higher high but ROC is making higher low. It means the current trend is weakening and is likely to reverse. So it is a case of bearish divergence and is a signaal to exit the buy position or short the market.
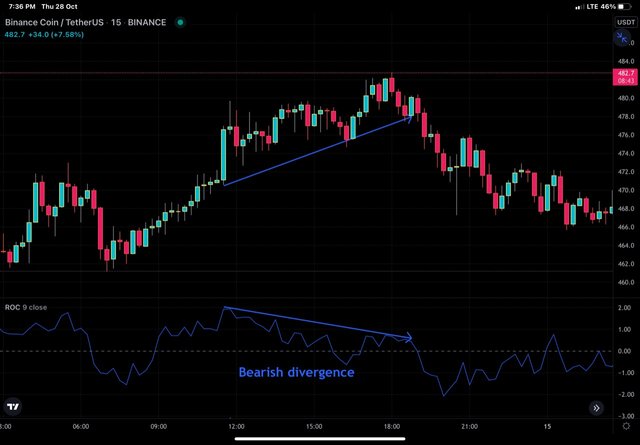
In the above chart we can see that bearish divergence is seen on ROC and the price action has followed the indicator and shown dip thereafter.
The other scenario is that , when the price is moving down but ROC is moving up. The lower low movement of price correponds to lower high on ROC. It reflects forthcoming bullsih trend and is a signal to exit the sell position or take buy position.
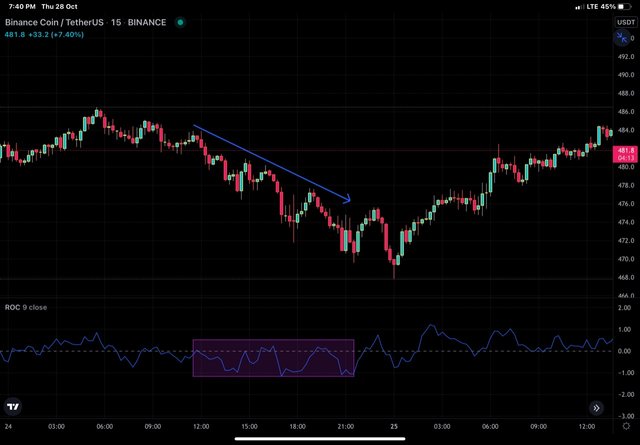
In the chart above, we can see that ROC shows indecision as price action is making lower low but ROC is not syncing with price, it therefore indicates weakening of current trend. And the further progression of price does comply with the indicator by moving up.
Although divergences provide valid trading signals that work most of the times. But it is not 100% sensitive. It does generate false signals.
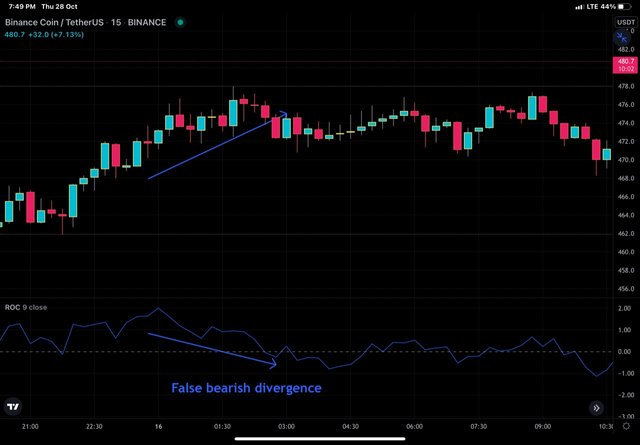
False bearish divergence
We can see that strong bearish divergence on ROC is not followed by bearish momentum of price. So it is a false signal. Generation of false signals can be minimized by taking support from other indicators.
How to Identify and Confirm Breakouts using ROC indicator?(screenshot required)
Breakouts refer to breaking of price above resistance zone or below support zone. We know that, resistance zone refers to an important price zone which is difficult for price to penetrate and therefore price falls towards support. Support zone is another area which is difficult for price to penetrate and price rise up towards resistance. When price breaks these important levels, price is expected to traverse its path further up from resistance and down from support. So these are potential areas for breakout traders. Most of the times we see there is indecision or consolidation in the markets before breakouts occur. Consolidation or indecision is reflected on price as movement within a fixed range and the same is reflected on ROC as wavy movement around zero line or in positive or negative zone of ROC. As breakouts occurs, the wavy indecisive movement of ROC is broken in the direction of breakout and continues in direction of price.
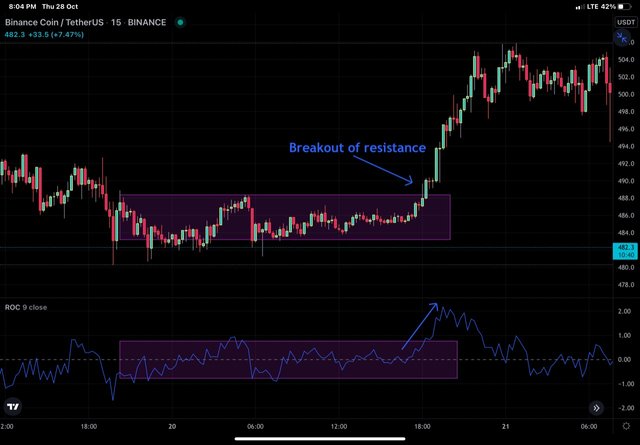
Breakout above resistance following consolidation
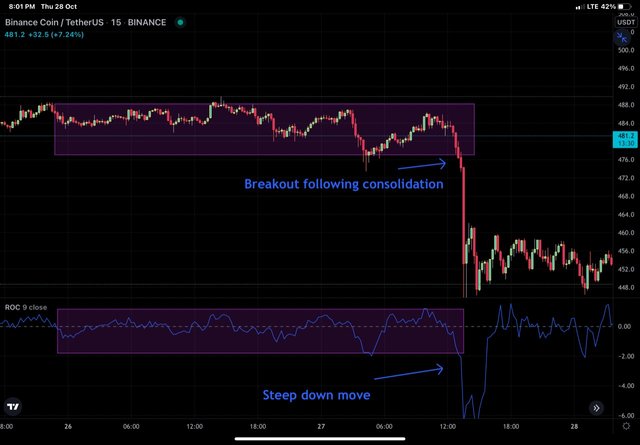
Breakout below support following consolidation
Review the chart of any crypto pair and present the various signals giving by ROC trading strategy. (Screenshot required)
Different trading signals on the basis of ROC have been shown in the various charts in the subsequent sections above. However for the sake of completion of this task, I will be reviewing chart of BNB/USDT on 15 minutes timeframe and show various signals generated.
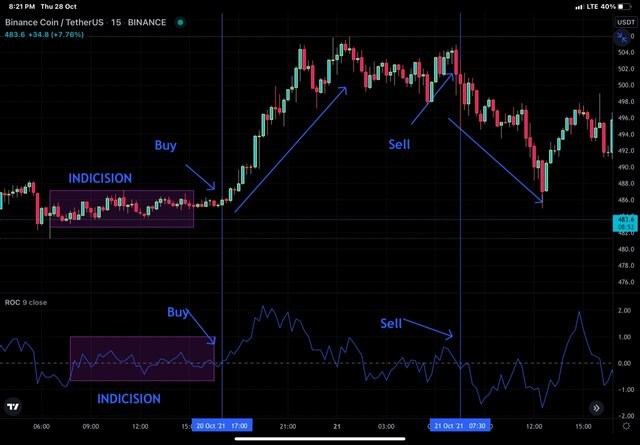
BNB/USDT ON 15 MIN TIMEFRAME
We can see that a consolidation phase shown on price chart as price moving between definite price zones and than breakout of resistance which is represented by buy signal. Steep upward movement of ROC is followed by bullish rally of price and than weakening of trend shown as wavy movement of ROC along zero line, that is than followed by breakdown or sell signal which is in sync with price action as reflected by bearish rally of price down. So on a singal chart, we could see buy, sell, consolidation or indecison, breakouts, trends, strength of trends and weakening of trend as well.
Conclusion:
ROC is a momentum indicator which measures percentage change in Price over a particular time frame and thereby generate various trading signals on the basis of which trading decisions are taken. It is simple to use and understand. Just like other indicators, it has to be used along with other indicators to provide appropriate signals and filter out false signals.
Hi @drqamu
Thanks for participating in the Steemit Crypto Academy
Feedback
Total| 9/10
This is good work. Thanks for demonstrating such a clear and well detailed understanding of trading using Rate of Change indicator.
Thank you