[ Highly Profitable Trading Strategy with VuManChu Cipher B ]-Steemit Crypto Academy | S5W6 | Homework Post for @reddileep

Define VuManChu Cipher B Indicator in your own words.
VuManChu Cipher B Indicator is a combination of multiple indicators that results in formation of a trading system. The VuManChu Cipher B contains indicators like relative strength index (RSI), Money flow index, trend waves, market volume and Momentum etc. Each of these indicators caters to different parameters related to trading and therefore combining them together to generates fairly enough filtered signals to benefit the traders.
The other persecutive of the indicator being its one in many nature. It is beneficial for traders who can't afford the premium version of trading software. In trading softwares, where it is available free, it is counted as one indicator although it is in itself a combination of indicators.
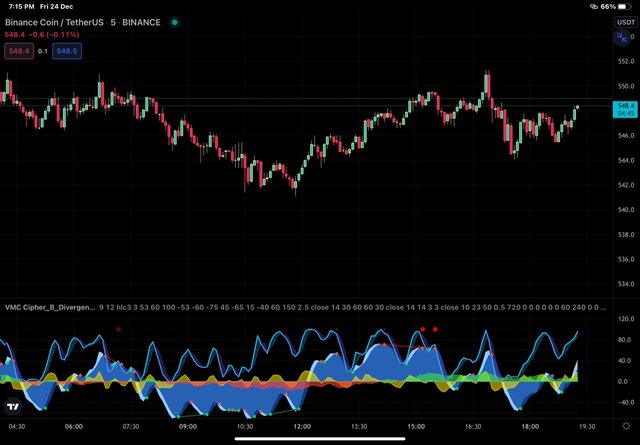
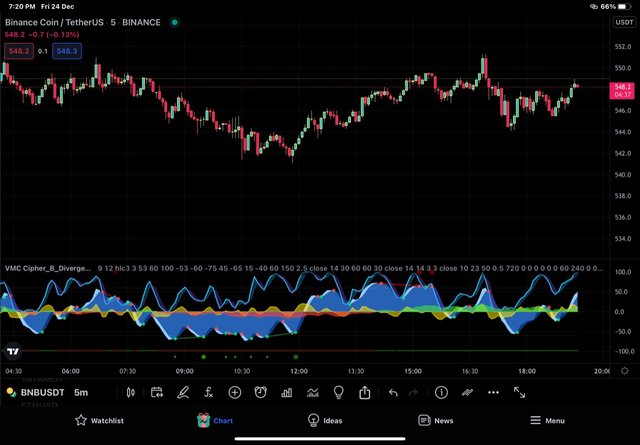
VuManChu Cipher B indicator applied
The working of indicator shall be explored in subsequent sections.
How to customize the VuManChu Cipher B Indicator according to our requirements? (Screenshots required)
To customise VuManChu Cipher B indicator, we will apply the indicator to the chart on tradingview platform and than change settings according to our requirements :
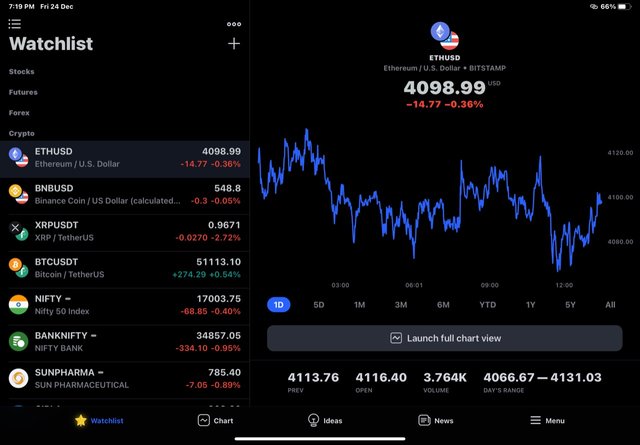
Select any trading pair. Chart of the pair will load.
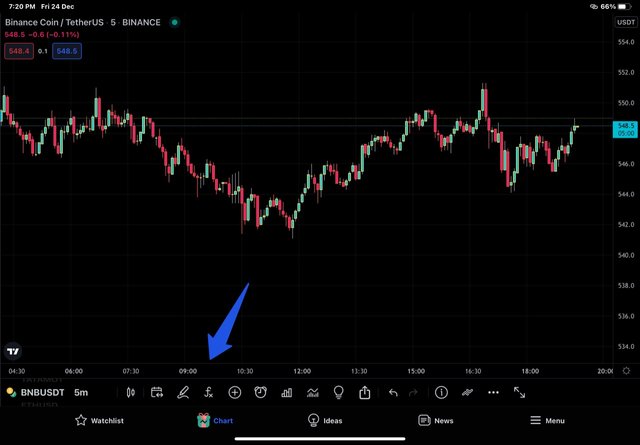
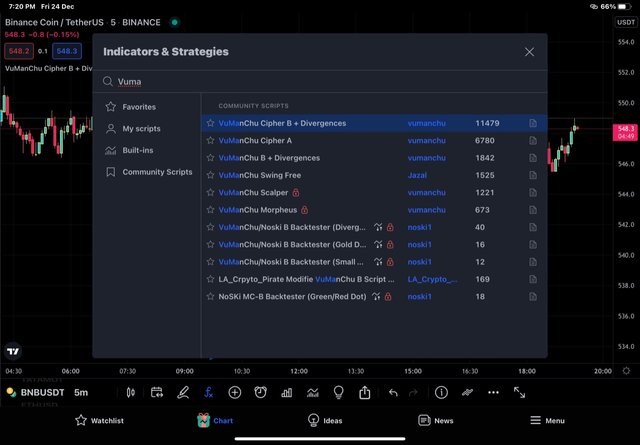
Click on indicators from the top menu. In my case, i have Indicators option at bottom of the chart.
Next we type "VuManChu Cipher B" in the search box provided and select same Indicator from the suggestions.
Go back to your chart and you will find indicator loaded to the chart.
Configurations of the Alligator Indicator.
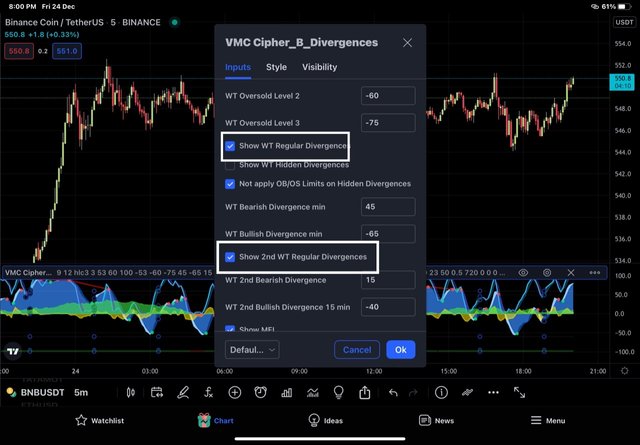
Double click on Indicator and chart settings will load.
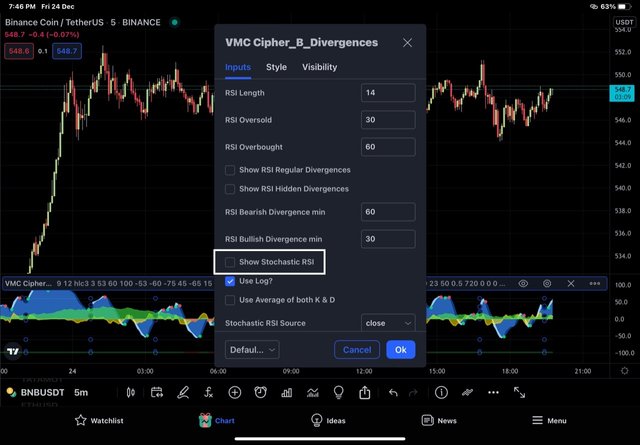
in input settings , we will customise input settings as per the strategy laid down by Professor in the class. Scroll down and unmark the following settings Show WT regular divergence and Show Second WT regular divergence it is because the strategy that we are going to follow doesn’t put divergences in use.
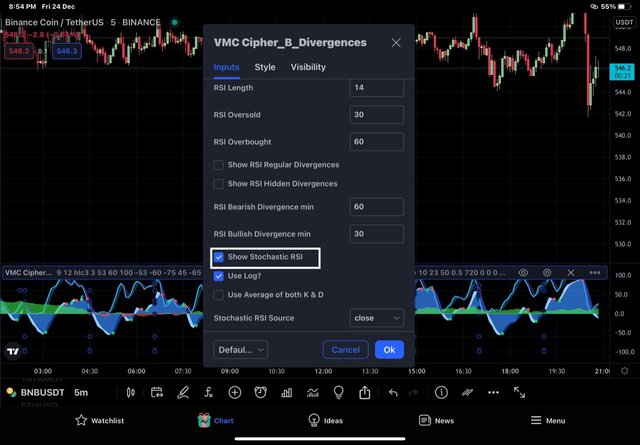
- Scroll down and unmark the options to show Stochastic RSI.
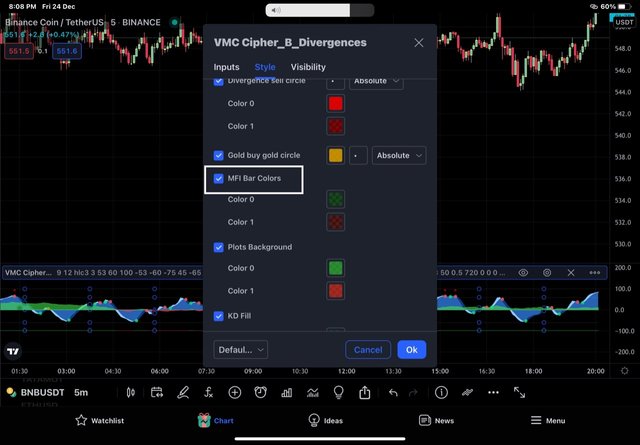
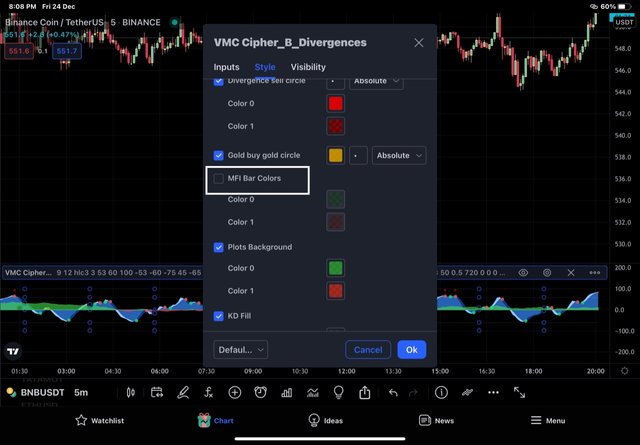
- In style settings:- In the style settings, we can configure indicator colour, thickness and precision etc. Then unmark the VWAP(( volume weighed average price). Because we are not going to use this volume Based indicated in the strategy that follows. Next remove the *MFI bar colorsindicator. MFI refers to the money flow index and it represents the inflow and outflow of the money with different colours we removed it because MFI is not useful.
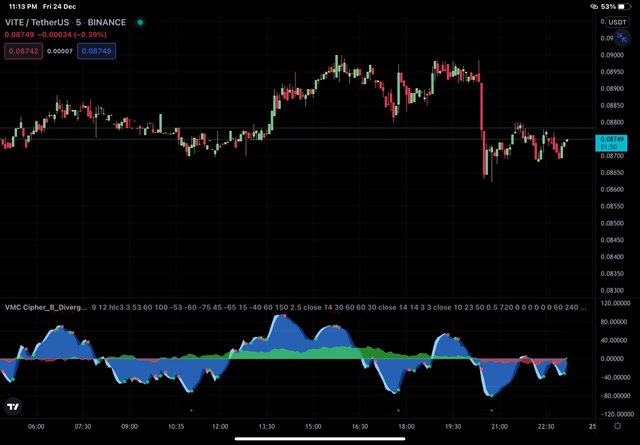
Now when we look at the chart we can find it much easier and looks less frightening.
Explain the appearance of the VuManChu Cipher B Indicator through screenshots. (You should Highlight each important part of this indicator by explaining their purpose)
We will explain the appearance of vuManChu Cipher B indicator as per our trading strategy we have already configured the indicator above and so will be explaining it as per configuration.
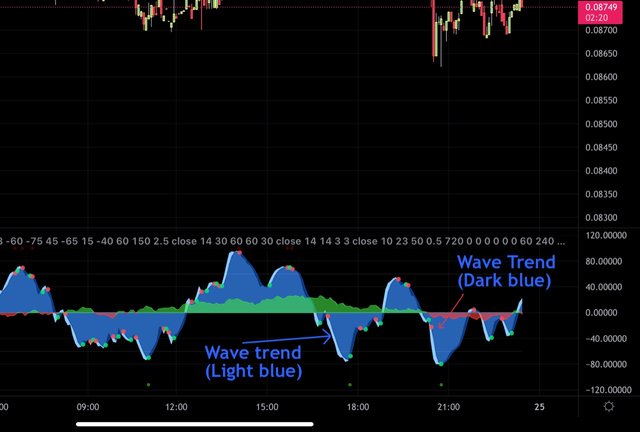
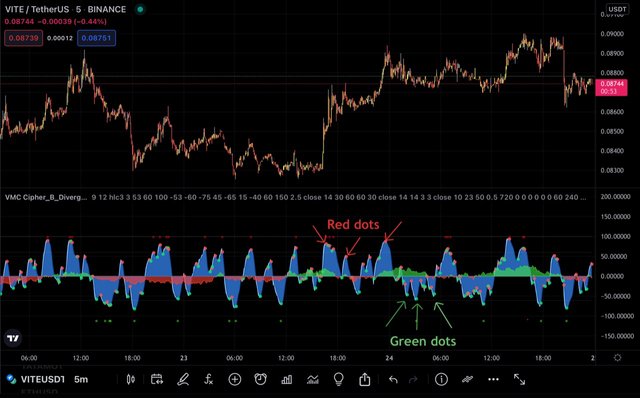
Wave trend indicator:- It is represented on the chart by the blue colour of two different shades- light blue and dark blue. As the name implies, this trend indicator is used to spot the trend in the market. When the light blue wave and the dark blue wave cross each other, there is the formation of two different coloured dots- red dots and green dots.
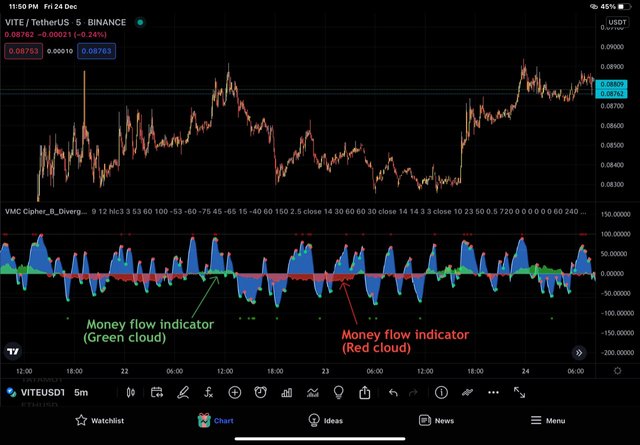
Money flow index:-Money flow index appears like clouds on the chart. When clouds are green, it means that the money is flowing into the market and thereby the market is in a bullish trend. On the other hand, when the clouds are red, it means that the money is flowing out of the asset and therefore the market is in a Bearish trend.
Demonstrate your preparation for the Trading Strategy combining other indicators. (Instead of showing the addition of indicators to the chart, you should explain the purpose of each indicator for this trading strategy.)
VuManChu cipher B indicator is itself a combination of multiple indicator and therefore generates signals with fair degree of accuracy. However, the authenticity of signals generated is further enhanced by filtering out erroneous signals by making use of other indicators like EMA like EMA 200 and EMA 55.
The signals generated on the basis of vuManChu cipher B are filtered by crossover between EMA 200 EMA 55. A trader has to go long , when the buy signal generated on the basis of VuManChu is confirmed by crossover of EMA 55 over EMA 200 from below upwards. A trader must go short, when the sell signal generated by VuManChu cipher B is confirmed by crossover of EMA 200 over EMA 55 from below upwards.
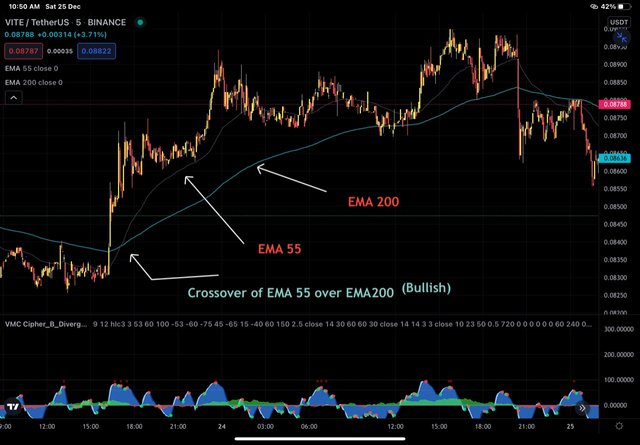
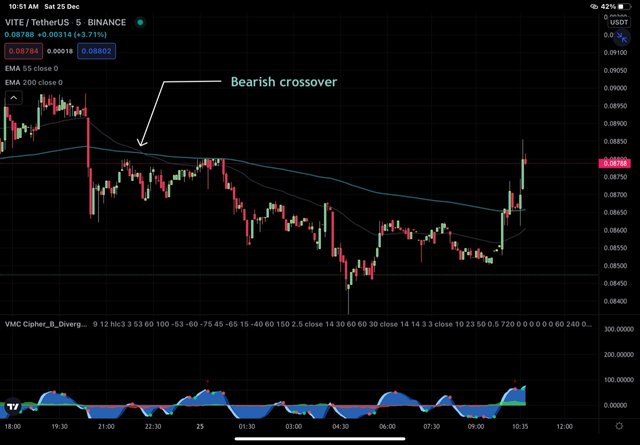
In the charts above, we can see that the signals generated on the basis of VuManChu indicator ( discussed in next section) have been wonderfully supplemented by Exponential Moving Averages (EMAs). Bullish crossover is followed by bullish rally of price and bearish crossover is followed by bearish rally of price.
Graphically explain how to use VuManChu Cipher B Indicator for Successful Trading. (Screenshots required)
For successful trading based on the VuManChu Cipher B indicator, we will look at the signal generated by the indicators within the VuManChu Cipher B and in addition, we will supplement our position with the help of exponential moving averages.
Bullish market - Buy position.
Based on customised VuManChu Cipher B indicator and EMA, for a buy signal, we will look at confirmation of the signal by following points
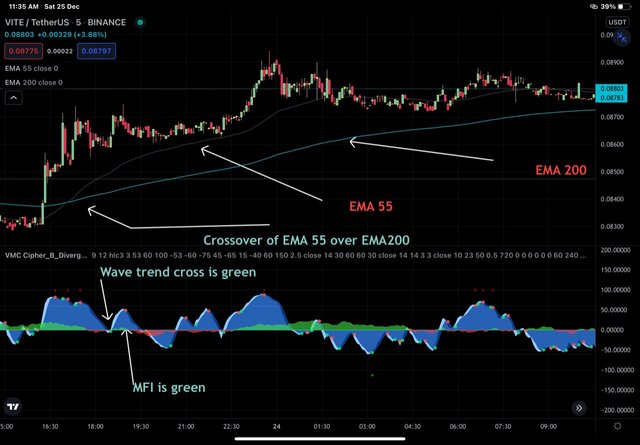
Money flow index must be green. It indicates that the money is flowing into the asset. We know that the flow of money leads to an increase in demand and which Inturn increases the price of an asset.
On the basis of a wave trend indicator, there must be a crossover between dark blue and light blue lines of the VuManChu Cipher B indicator in such a way that green dots are formed. It indicates that there is significant buying pressure in the market that is going to push the price of an asset upwards.
EMA 55 must cross EMA 200 from below upwards.
Bearish market - Sell position.
Based on customised VuManChu Cipher B indicator and EMAs, for a sell position, we will look at confirmation of the signal by following points
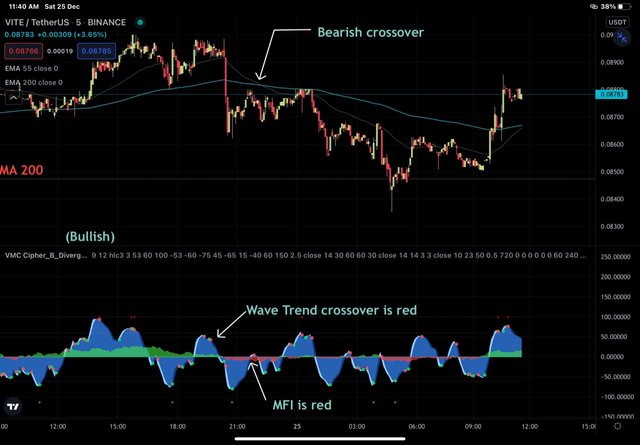
Money flow index must be red. It indicates that the money is flowing out of the asset. We know that the flow of money out leads to a decrease in demand as well as buying pressure and which Inturn decrease the price of an asset.
On the basis of a wave trend indicator, there must be a crossover between dark blue and light blue lines of VuManChu Cipher B indicator in such A way that red dot or formed which reflects the bearish trend. It indicates that there is significant selling pressure in the market that is going to push the price of an asset downwards.
EMA 55 must cross EMA 200 from above downwards.
Using the knowledge gained from previous lessons, do a better Technical Analysis combining this trading Strategy and make a real buy or sell order in a verified exchange. (You should demonstrate all the relevant details including entry point, exit point, resistance lines, support lines or any other trading pattern)
For real trade, I'll use my Wazirx exchange and for showing important signals, I'll use Tradingview .
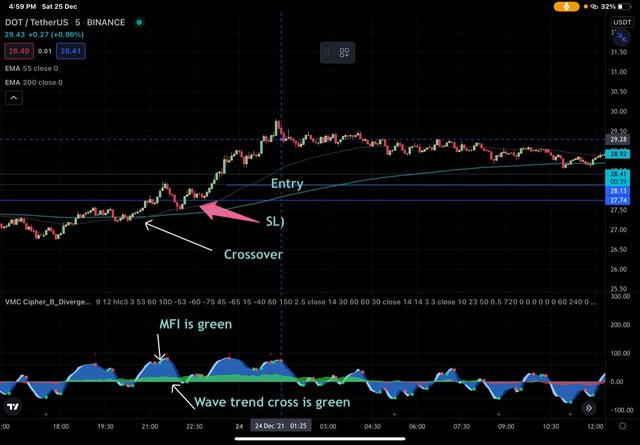
Buy Trade DOT/USDT .
From the chart above, our buy position is confirmed by bullish crossover on EMAs (EMA 55 over EMA 200) and MFI is green and so is WT crossover. We placed entry after breaking up of important level (27.74) by price action after triple confirmation by indicators. We entered at 28. 13 $ and placed TP such such that SL/TP is 1:3.
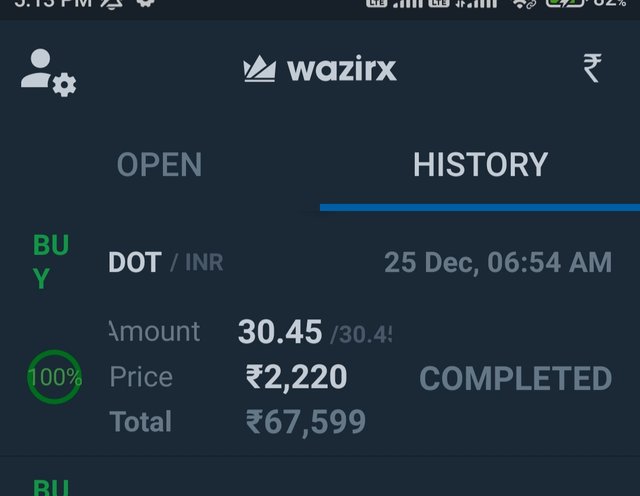
Wazirx buy order completed ( DOT/INR)
Above is my Wazirx Trade of DOT at the mentioned level. Although TP was hit as per strategy but since it is a spot trade and i have been Trading DOt for long time. I am still holding it because I am expecting it to yield more.
Conclusion
VuManChu cipher B indicator is a combination of multiple indicators and generates multiple signals. Although it looks complicated to begin with but after proper customisation, only strategy based indicators are retained to materialise the signals. In addition, when it is combined with other indicators , the versatility of the indicator is further enhanced.