Crypto Trading With Linear Regression Indicator- Crypto Academy /S5W5-Homework Post for kouba01
Hello guys, hope you all are doing well. Today I am writing homework task for professor @kouba01 which is about "Linear Regression Indicator".

Discuss your understanding of the principle of linear regression and its use as a trading indicator and show how it is calculated?
Linear regression is a stastical concept to determine relationship between dependent and independent variables. Dependent variable refers to a numeric value that is affected by other factors but independent variables are not affected by dependent variables. For example, if we want to determine price of any crypto coin, we will have to look at all the factors that have tendency to alter the price like supply, demand, market news, competing cryptos etc. The final price is dependent and the factors mentioned above are independent variables.
If the relationship between dependent variable and independent variable is such that, with x fold increase or decrease in independent variables , the dependent variables also increase or decrease by x fold. Stastically , the graph will be a straight line known as linear regression line.
Now, we understood the principle behind linear regression line. Linear regression indicator is graphically represented for a particular period by joining the end points of a linear regression line. The practical utility is to help in predicting where a price is expected to be. Although, it looks similar to moving average but differs from MA in method of calculations as MA tries to average out the price while LRI is based square fit method and makes it more responsive than MA.
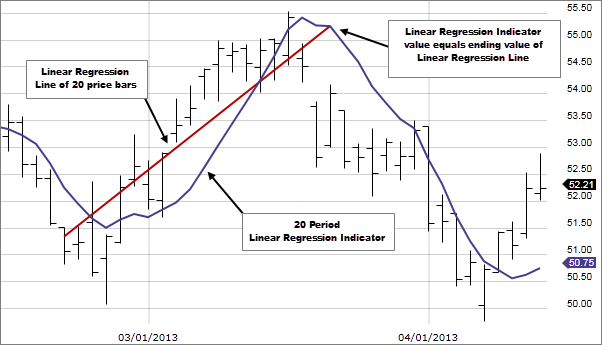
LR line and LRI
So for calculating linear regression indicator we need to calculate linear regression line. Mathematical equation for Linear regression line is
y = mx + c
m is slope of line
X is a independent variable
C is intercept
Y is dependent variable
LRI is drawn by joining end points of linear regression line at every period. So LRI is obtained by summation of various Linear regression models over a particular time.
Show how to add the indicator to the graph, How to configure the linear regression indicator and is it advisable to change its default settings? (Screenshot required)
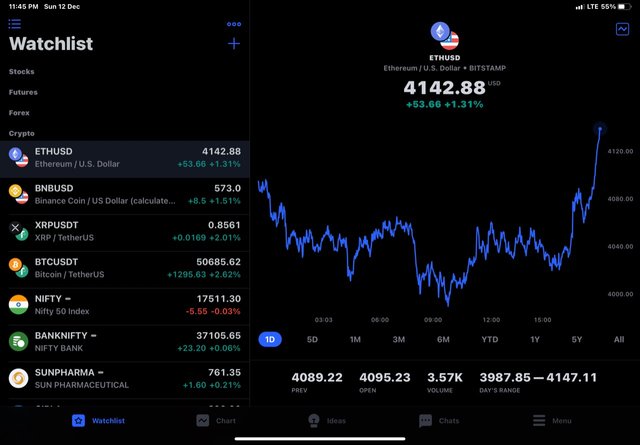
For this task, I'll be using trading view app. You can do it from official website of trading view too. I launched trading view app.
Select any trading pair. Chart of the pair will load.
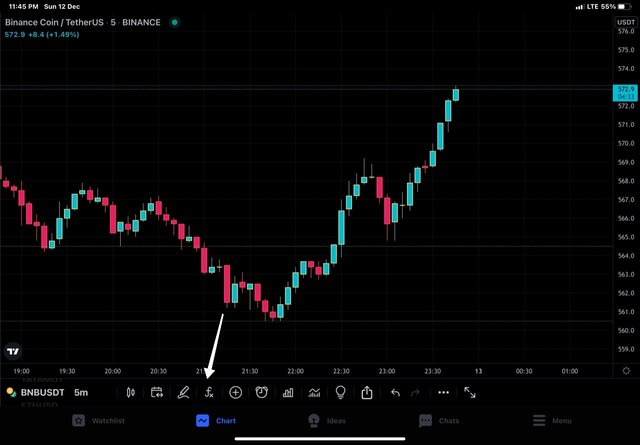
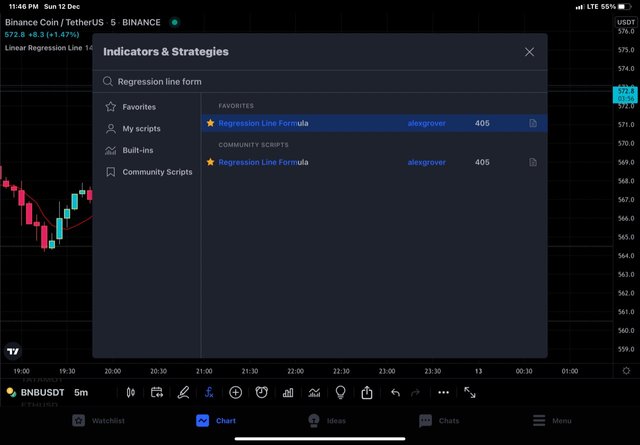
Click on indicators from the top menu. In my case, i have Indicators option at bottom of the chart.
Next we type "Regression line formula" in the search box provided and select same Indicator from the suggestions.
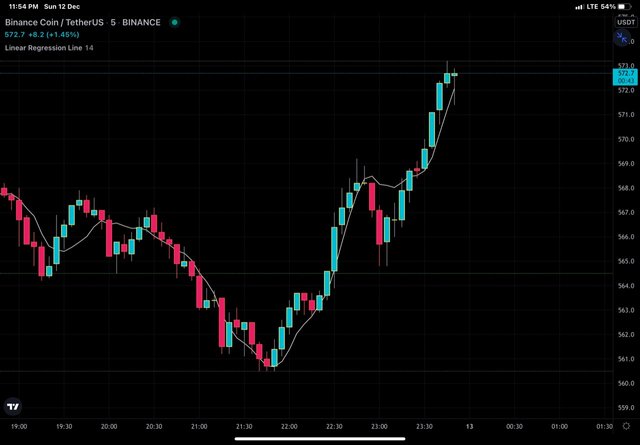
Go back to your chart and you will find indicator loaded to the chart.
Configurations of the Alligator Indicator.
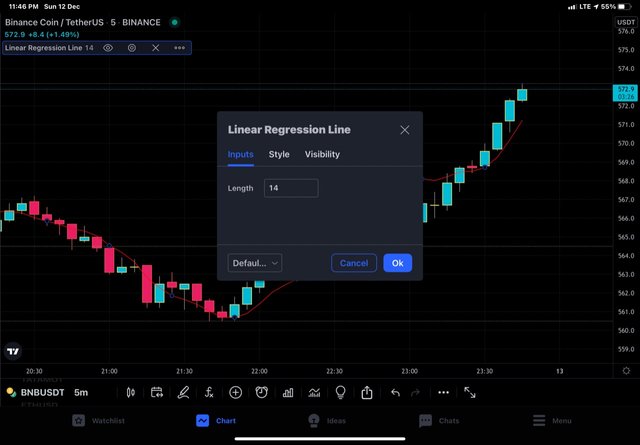
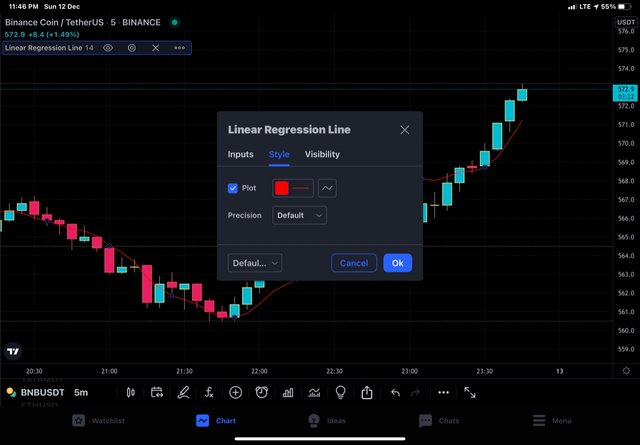
Double click on Indicator and chart settings will load.
Style settings: Here we can choose color and precision of indicator,
In the Inputs settings, we have indicator length that is set to 14 periods by default.
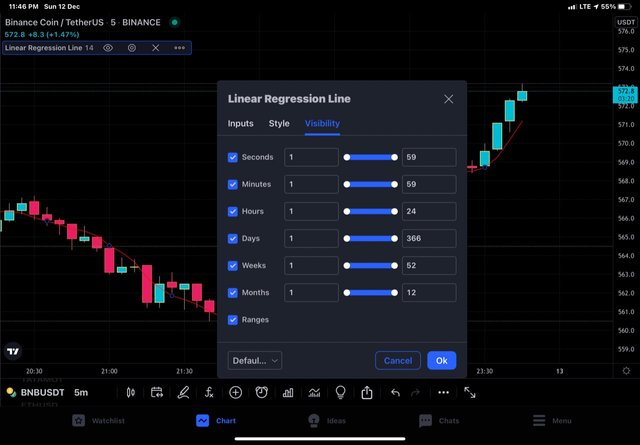
In the visibility, we have seconds , minutes, hours, days, weeks, months. Let's keep default settings for visibility.
As for settings of indicator are concerned, it works best at default settings of 14 . However, traders can change settings that suit their trading style. Some commonly used settings are 60/66/72 etc.
How does this indicator allow us to highlight the direction of a trend and identify any signs of a change in the trend itself? (Screenshot required)
Depending upon the period chosen for the indicator and price line, the shape of the Linear regression indicator keeps on changing. The direction of the trend is the same as that of the LRI curve. An upward projecting LRI is seen during an uptrend and a downwards protecting LRI is seen during a downtrend. This principle holds as the trend continues to traverse their path after establishment. Moreover, the slope of the indicator points towards the strength of a trend. The more strong the trend, the steeper is the LRI curve.
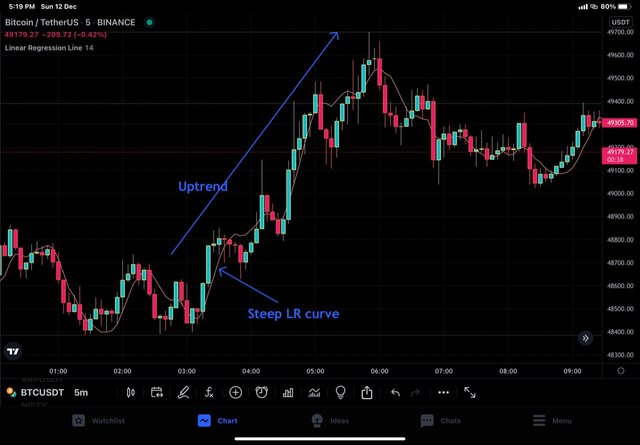
Uptrend on BTC/USDT
In the chart above, we can see that there is a strong uptrend in the market as shown by a bullish rally of price and steep LRI curve upwards.
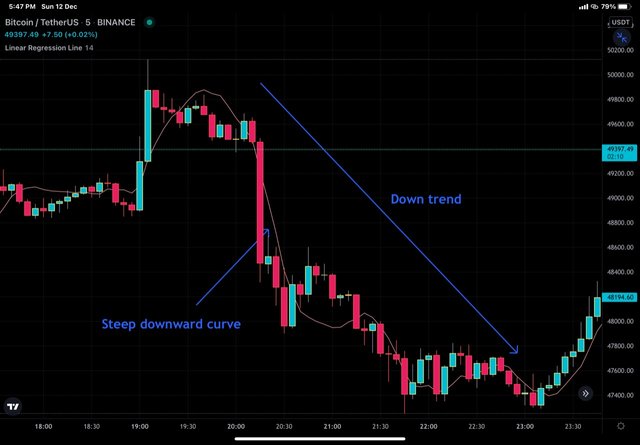
Downtrend on BTC/USDT
In the chart above, we can see that there is a strong downtrend in the market as shown by a bearish rally of price and steep LRI curve downwards.
Just before the reversal of trend takes place, the price line crosses the LRI curve and shows the change in slope as well. The direction of the trend is the same as that of the LRI curve.
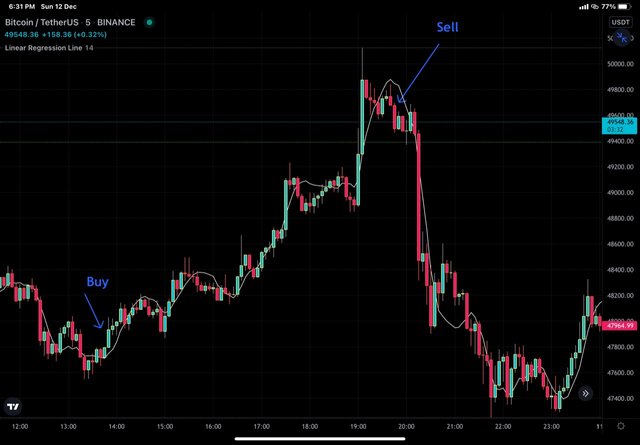
Trend change
In the chart above, we can see that there is a change in trend from bullish to bearish and LRI curve changed its direction from upwards to downwards. I have shown the buy and sell position with the help of arrows. As for the placement of stop loss and take profit is concerned, the concept should be crystal clear. For buy position place stops loss below the LRI curve before it started moving up and book profit at reversal signal by indicator. For sell position, place stop loss above the LRI curve where it starts projecting down.
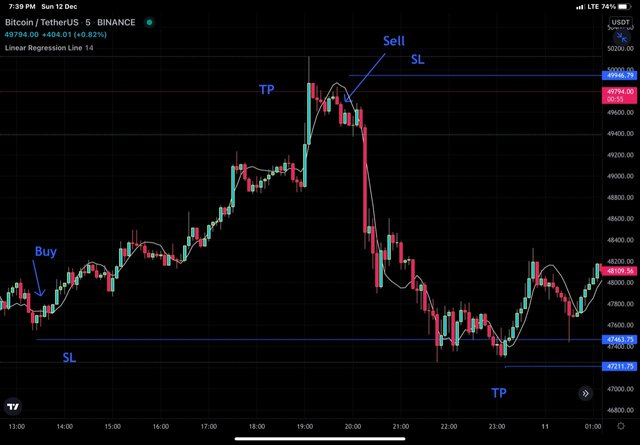
Complete trade set up for both buy and sell positions
In the chart above, I have labelled the complete set-up for buy as well as sell. Position including SL. and TP. Please do not confuse SL and TP at the top or bottom instead look at them separately for either position.
Based on the use of price crossing strategy with the indicator, how can one predict whether the trend will be bullish or bearish (screenshot required)
Crossover of indicator curve and price line is another aspect of the indicator to look for. Crossover of price line and Indicator curve known as "cut" is a signal that reinforces the validity of buy or sell signal generated. For reconfirmation, we need certain finer details about the morphology of the candle crossing the indicator line and let me tell you what that means.
For confirmation of the uptrend, we should have a strong bullish candle crossing the indicator line from below upwards and giving closing above the price line. if a bullish candle crosses the indicator line but the indicator does not give closing above the price line that won't be considered as a re-confirmation.
For confirmation of the downtrend, we should have a strong bearish candle crossing the price line from above downwards and giving closing below the indicator line. As mentioned above, if a candle crosses the price line but doesn't give closing below the indicator line that won't be considered as a re-confirmation.
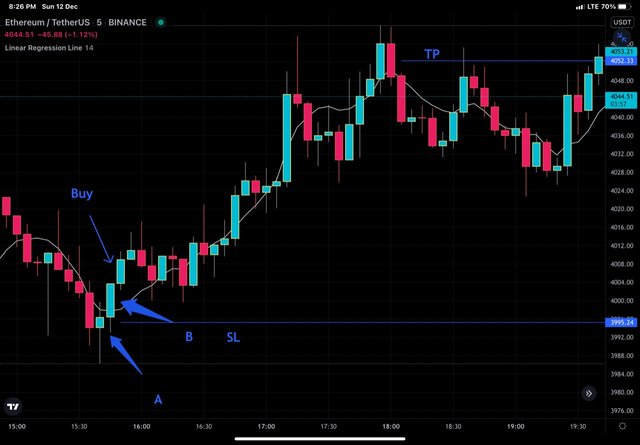
Crossover followed by bullish trend
In the chart above I have marked two candles A and B. Both these candles have crossed the indicator but candle A has given closing below the curve after making a long upper wick. Candle B is a strong bullish candle that has given closing above the indicator after the indicator line has crossed through its body. So it confirms the bullish trend and buy position can be taken on the next green candle. Stop-loss has been placed just below the candle where the indicator touches the price line and take profit has been placed at the top where the indicator has touched the price line before reversal.
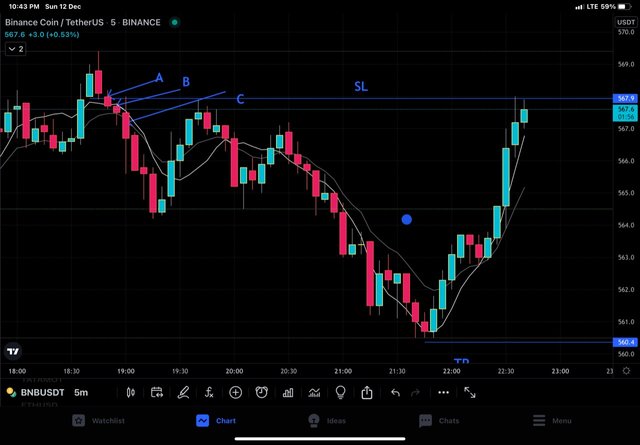
crossover followed by bearish trend
In the chart above I have marked three candles A, B and C after crossover of indicator and price line. Candle A has not given closing below the curve Candle B has given closing below the indicator after the indicator line has crossed through its body. So it confirms the bearish trend and sells position can be taken on the candle C. Stop loss has been placed just above the candle where the indicator touches the price line and project downwards and take profit has been placed at the bottom where the indicator has touched the price line before reversal.
Explain how the moving average indicator helps strengthen the signals determined by the linear regression indicator. (screenshot required)
By now, we have been taught so many indicators and we have seen that no indicator is 100% perfect. Every time we need to supplement the action of one indicator with other. Extrapolate the same concept here on a combination of MA and LRI. Undoubtedly, it is a means of having double confirmation before taking any position.
Morphologically both the lines seem similar but their method of calculations differ as LRI considers the squared values of variables while MA takes the average of variables. The regression line is more dynamic and generates signals earlier than that of moving average.
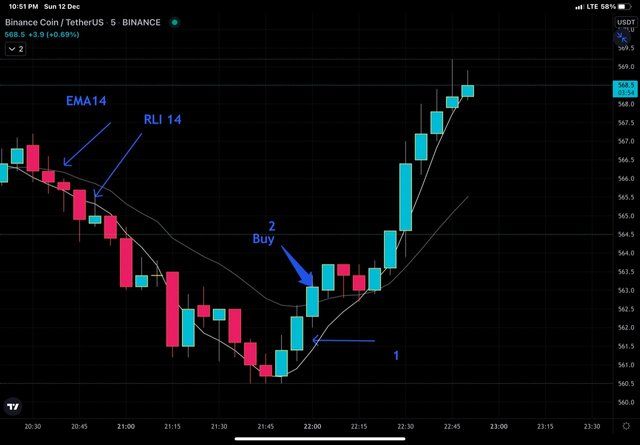
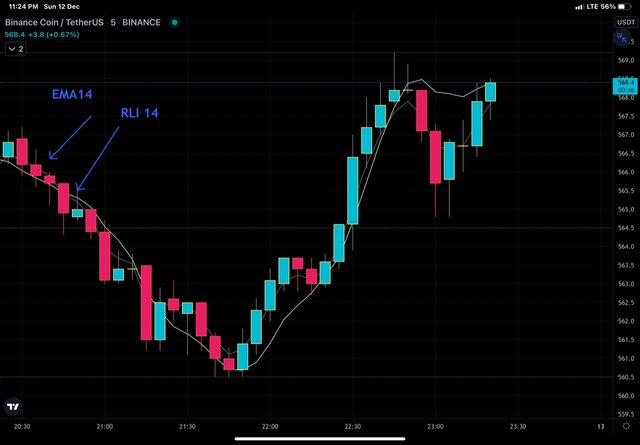
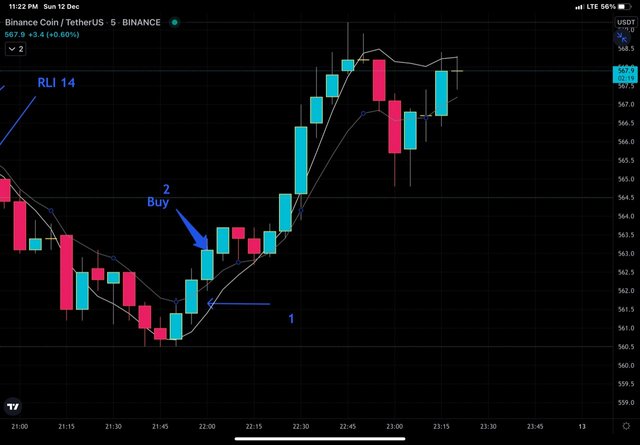
EMA 14 and RLI 14 period together
In the chart above, I have marked 2 candles as 1 and 2 . Candle 1 is giving me a buy signal based on RLI and candle 2 is giving buy signal based on both RLI and EMA. So, a combination of two indicators would give me double confirmation of the signal generated. On the same chart, we have seen that RLI generated signals earlier than EMA of the same period. However, we can try different periods for both indicator. Let's keep RLI at 14 periods and decrease EMA from 14 to 7 and then 3. We will see that indicator sensitivity will increase and will match the signals generated based on RLI but increased sensitivity is associated with the generation of false signals as well.
We can see in the above charts that a decrease in the period of EMA tries to bring two indicators closer and generate more or fewer signals at the approximately the same time but that has its own drawbacks as mentioned above.
Do you see the effectiveness of using the linear regression indicator in the style of CFD trading? Show the main differences between this indicator and the TSF indicator (screenshot required)
The TSF is more sensitive to price changes over the short term and therefore is well suited for trading CFDs. Being a trend following indicator, it is efficient enough to detect short term trends in an upward or downward direction.
The working of the indicator is very simple, when the price moves above the TSF, the trend is bullish and when the price goes below TSF, the trend is bearish. The trader can take position accordingly. It looks like MA but is more sensitive than MA while responding to price change.
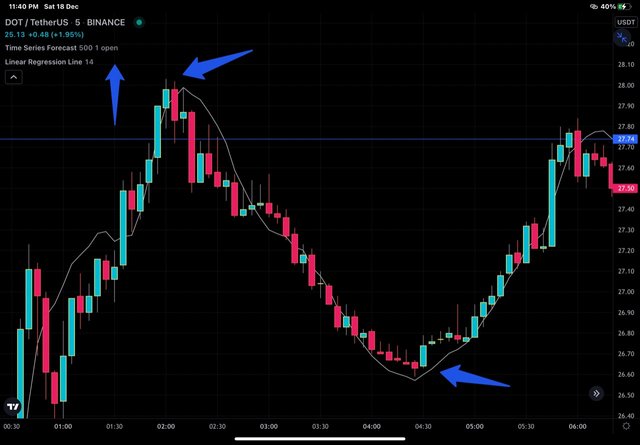
D0T/USDT - TSF Applied
In the chart above, we can see that TSF generated clear buy/sell and signals that can be materialised.
List the advantages and disadvantages of the linear regression indicator:
Advantages of indicator
Linear regression line is a very simple indicator to comprehend on a chart.
A single moving line like EMA doesn't obscure the view of the chart.
It generates signals on time and much before EMAs.
It can be used at any time frame and for any trading strategy.
Disadvantage
The calculations ot indicator is a bit difficult.
Being dynamic, it generates a lot of false signals.
The indicator needs to be supplemented by some other indicator like EMAs.
Conclusion:
A linear regression indicator is a potential tool in the hands of traders that can aid in the understanding the market and materialise the signals generated. Theoretically difficult to explain but practically easy to understand. The indicator helps in generating signals like buy/sell signals based on various movements of the indicator line.