Crypto Academy Week 16 , Homework post for [ @kouba01 ].. Bollinger Bands
Hello friends hope you are all fine, today i am writing homework task for professor @kouba01 which is about bollinger bands. Let me test my understanding of this topic.
Define the Bollinger Bands indicator by explaining its calculation method, how does it work? and what is the best Bollinger Band setup?
Bollinger Bands represent a simple moving average based technical analysis tool developed by John Bollinger indicating various trading signals. A Bollinger Band is composed of three lines or bands. The middle line represents the simple moving average (SMA) and the upper line is set plus two standard deviations ( + 2 SD) above the simple moving average and the lower line is set at minus 2 standard deviations
( - 2 SD) below the simple moving average. The Simple moving average that is commonly used in bollinger bands is 20 -
days SMA. It is not fixed, it can be changed but best results have been seen by trading professionals with this reference. So the best set up is 20 day SMA and + 2SD for upper band and -2SD for lower band.
Calculation of Bollinger Bands .
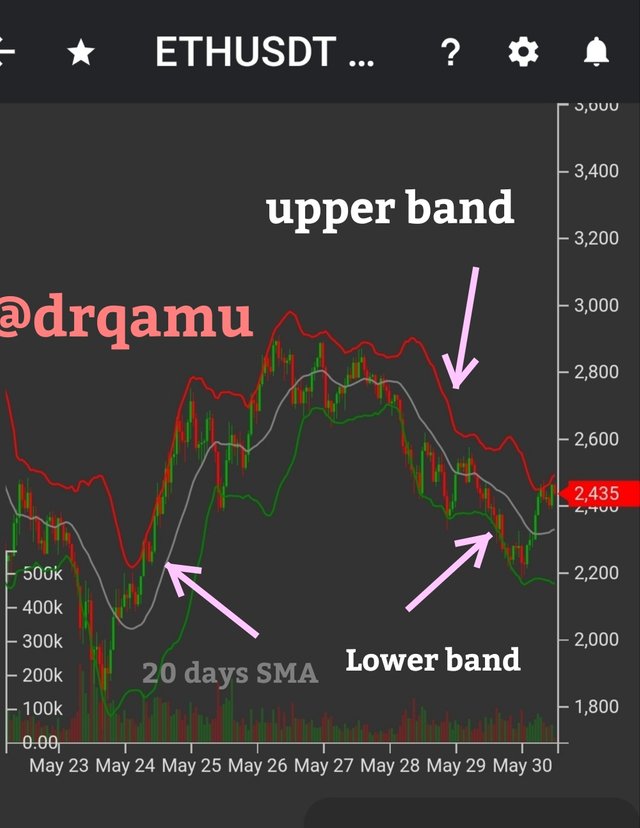
ETH/USDT from my tradiny acc with Bollinger Band
The main point first to be understood is concept of Simple Moving Average. I remember i was taught simple average as sum of observations divided by number of observations. Example, a trader is doing any trade for a month and at the end of month, he is having different profits on different days , say $10 on day 1 , $ 20 on day 2
, 34$ on day 3 and so on and ao forth. But at the end when we ask for the average profit , he won't say individual figures but
he has to sum up all the profits for 30 days and divide that sum by 30.
Applying the same concept to 20 - days SMA. It would refers to simple average of closing prices of asset under consideration for 20 days.
Standard deviation as the name implies would mean deviation of price from standard price. Here standard price would refer to price indicated by 20 days SMA. Any upward movement in price above SMA would be positive deviation and any decrease from SMA would mean negative SMA. In Bollinger Bands +2 SD for upper band and -2SD for lower Band are considered.
Working of Bollinger Bands
Volatality indicator
Bolinger bands show volatility of the market with fair degree of accuracy. The concept is quite simpler and goes like this; the wider the bollinger bands ( upper and lower) , the more volatile is the market. On the other hand , closer the upper and lower bollinger bands , less volatile is the market. div>
Overbought
and Oversold
### Determining Breakout with Bollinger Bands
Look at above screenshot, around May 26 Bollinger Bands are wide apart and look at corresponding price chart showing significant volatility. Than look at May 28 , bollinger bands come close together which is reflected on price charts too.
and Oversold
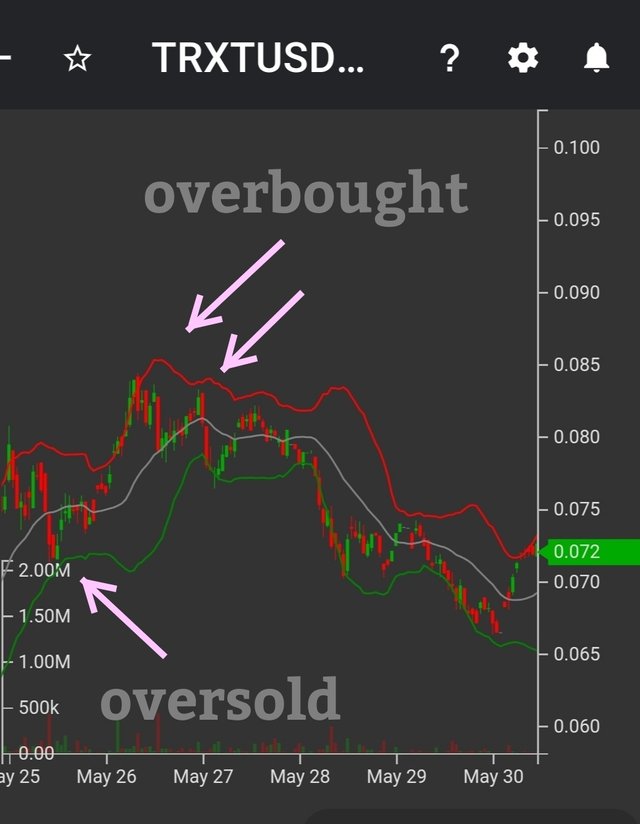
We know that , we call an asset overbought when its price is going very high and same thing can be seen on bollinger bands when the Price chart is touching the upper bollinger band. It therefore indicates forthcoming price correction to occur and therefore is considered as sell sign by traders. However I would again like to emphasise that there is no clear cut point on the band to indicate sell therefore other indicator must be considered along with it.
Similarly, an asset is considered oversold when its price is low and same thing can be seen on Bollinger bands when price moves closer to lower band.
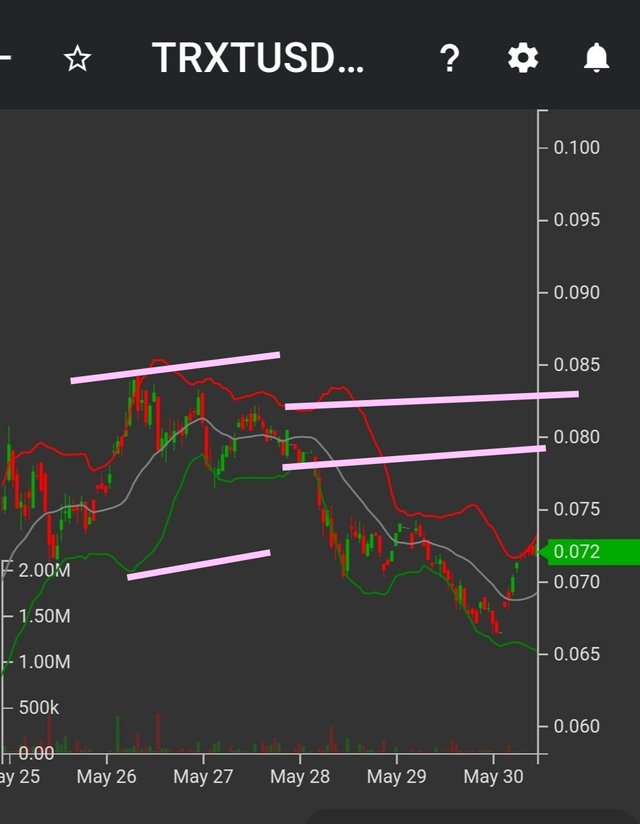
In the screenshot above, you can see that the TRX price touchs lower bollinger band around Mayb25 and subsequent price correction took place and price went up . Soon thereafter the price touchs the upper band few times in the subsequent days and then the price went down. So the point that I mentioned above,
that there is no clear cut indication of where to buy or sell can be seen on the chart above, it can filtered by making use of other indicators, which i shall explain later. But one point that we saw is that price followed the bollinger signal at both overbought and oversold zones
The other features of bollinger bands like support , resistance, price breakout, trend finding , trade reversal shall be discussed in below mentioned questions separately. To avoid repetition, i am skipping it here.
What is a breakout and how do you determine it? (Screenshot required)
A breakout in crypto , as the name implies refers to breaking out of asset price above resistance or below support level. To simplify, we say a price breakout has occurred , when the price of an asset that we are looking for has gone above our established resistance level or has gone down the established support level. So in a way,,I can say that it is subjective thing because support and resistance level vary from trader to trader. However the definition applies to major chunk of the traders in the market in large volume breakouts.
### Determining Breakout with Bollinger Bands
To determine breakouts with the help of bollinger bands we will have to look for "bollinger squeeze". It is an
important concept that lies at the heart of bollinger bands. It refers to constriction of the gap between upper and lower bollinger bands resulting in squeeze of SMA in between. Bollinger squeeze therefore signals lesser volatility and imminent price breakout. One thing to remember here in this context is that, price breakout refers to movement of price above resistance or below support but not movement above or below bollinger bands. Most of the breakout (85 to 90% approx ) take place within bollinger bands and smaller number of breakouts can take place outside of bands too.
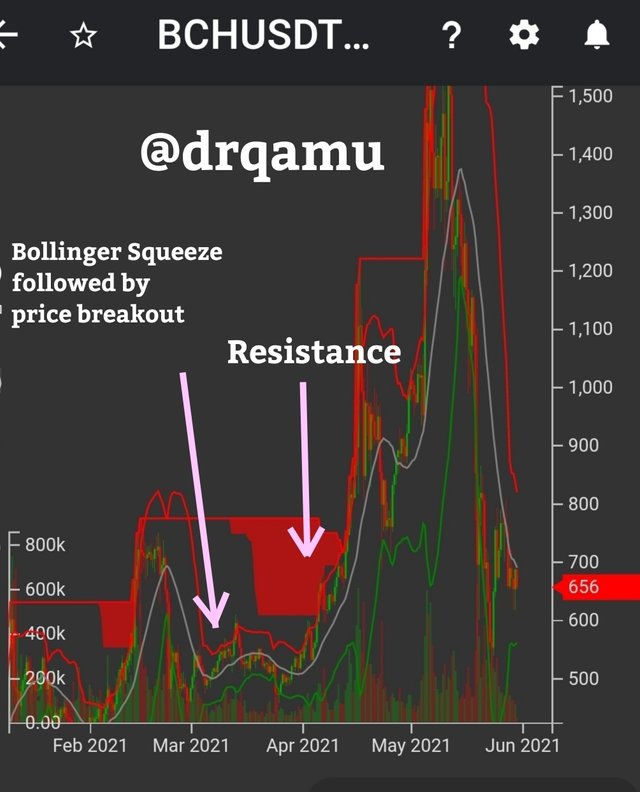
BCH/USDT chart from my tradiny acc
Look at the screenshot above, you can see a classical example of the price breakout . BCH resistance prior to price breakout was at 750 USDT in feb 2021 . You can see a massive breakout above resistance clearly indicated by bollinger squeeze and almost doubled price of BCH towards ending march.
How to use Bollinger bands with a trending market? (screenshot required)
Bollinger Bands are a bit simpler to interpret than other single line indicators like moving average. It is because bollinger bands form a pipe like structure that keeps on widening or constricting based on inputs from market. However, the general concept remains, an upward moving pipe (Bollinger Band ) indicates uptrend and a downward moving pipe, indicates downtrend. In trending markets, we trade middle line of bollinger bands. What does that mean?
In a bullish market, if price pullbacks touch a middle line, they form support on it and therefore gives buy signal to the trader. On the contrary, in bearish market, if price pullbacks touch the middle line, it forms a resistance line and therefore gives sell signal.
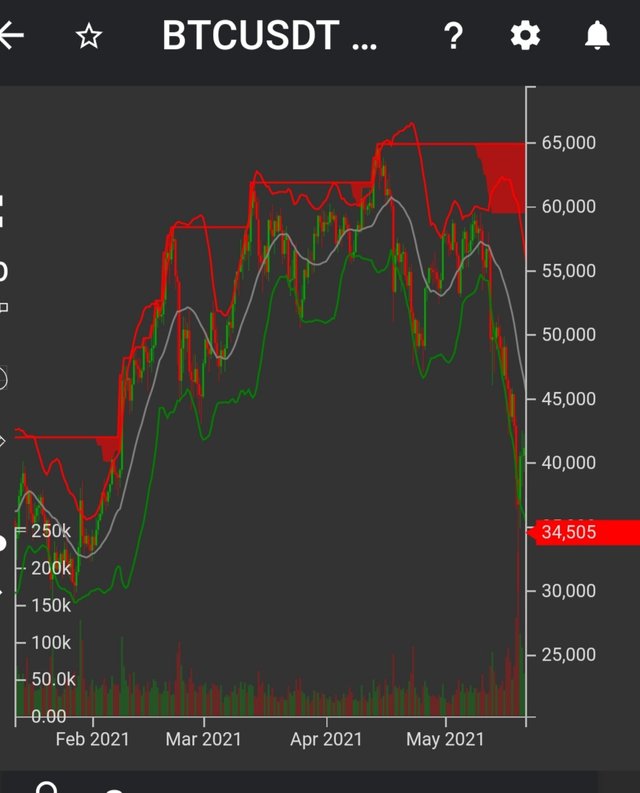
BTC/USDT in uptrend
Look at screenshot above, the middle band without any further drawing on it, is clearly represents a line which the price rebounces are not able to cross and therefore form a support line that can be utilized by traders as buy signal. Also note that wherever BTC price has come down, price line has also followed and moved down the middle band.
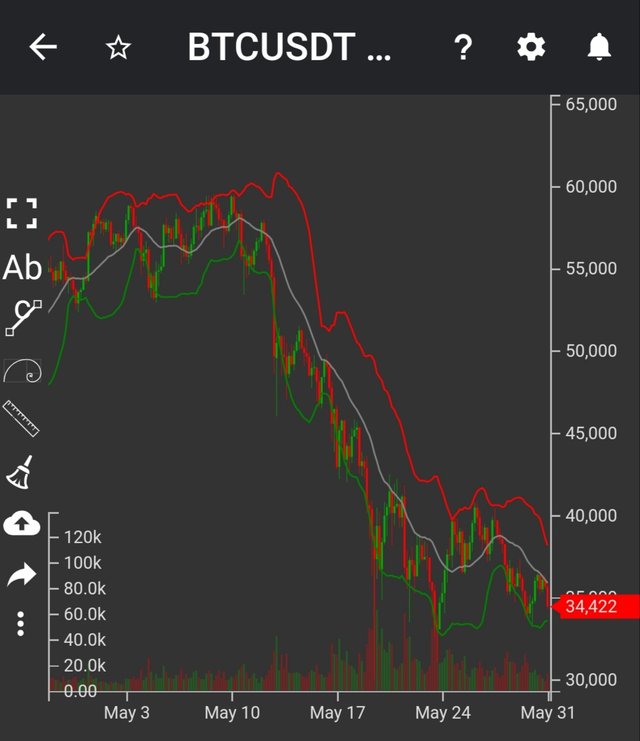
Now look at BTC in downtrend, you can see clearly that the price pullbacks are not able to cross middle band and therefore middle band acts as resistance line and can therefore be utilized by traders as resistance line and sell signal.
What is the best indicator to use with Bollinger Bands to make your trade more meaningful? (Screenshot required)
I think if Bollinger Bands are used along with MACD and RSI, it would make a perfect and reliable combination of indicators. Shortcomings of any one may be compensated and cross checked by other two.
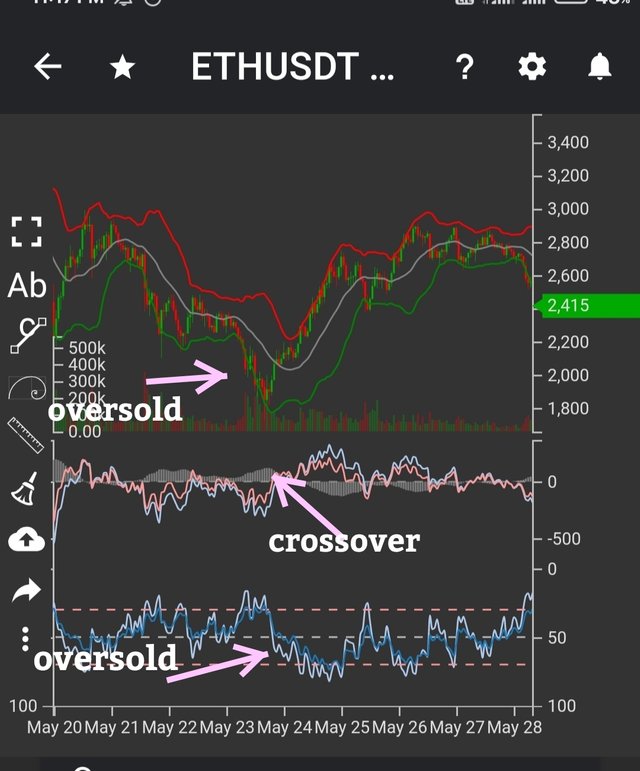
Let's try to review above chart of ETH/USDT, around 23 May price touched lower Bollinger band that is perceived by traders as oversold asset and expect subsequent price correction. Same can be confirmed by RSI value touching 30 on the same period and even further down a bit later. So when both Bollinger band and RSI are used together, we are in a better position to make trading decisions.
Now let's look at subsequent price hike seen on 24 May, post Bollinger constriction on Bollinger bands and same can be verified by MACD cross over as indicated by arrows and we know in MACD cross over has great significance in trading. So both of them taken together can serve as good trading tool.
What timeframe does the Bollinger Bands work best on?And why? (Screenshots required)
Basically timeframe of bollinger bands depend on your trading style. Suppose, if you are a day trader , you have enough time to keep continuous track of market than small time frames like 5 min and 15 min are used.
For swing trader or for holding , larger time frames are best like daily and weekly time frames.
However a better strategy would be dual time frame strategy. We use large time frame to find trend and smaller time frames to find entry and exit points. Suppose we want to trade on trend and we made a mind to enter market. What we will do, is to look for larger time frame like weekly. We will try to find support near middle band which would mean that a market is in uptrend and we expect price to go up. Than we will come back to lower time frame like an hour or 15 min , where we expect price chart to be near lower band which would indicate price an oversold asset and expect subsequent price correction and hike. So the dual strategy would be more beneficial to follow than any one individuality. However the general concept would be, lower time frame for day traders and higher time frame for holding or swing trading.
Review the chart of any pair and present the various signals giving by the indicator Bollinger Bands. (Screenshot required)
Most of the signals have already been explained by me in above mentioned questions because i am making use of real screenshots. Just for the sake ot completion, i am putting screenshots here again indicating various signals.
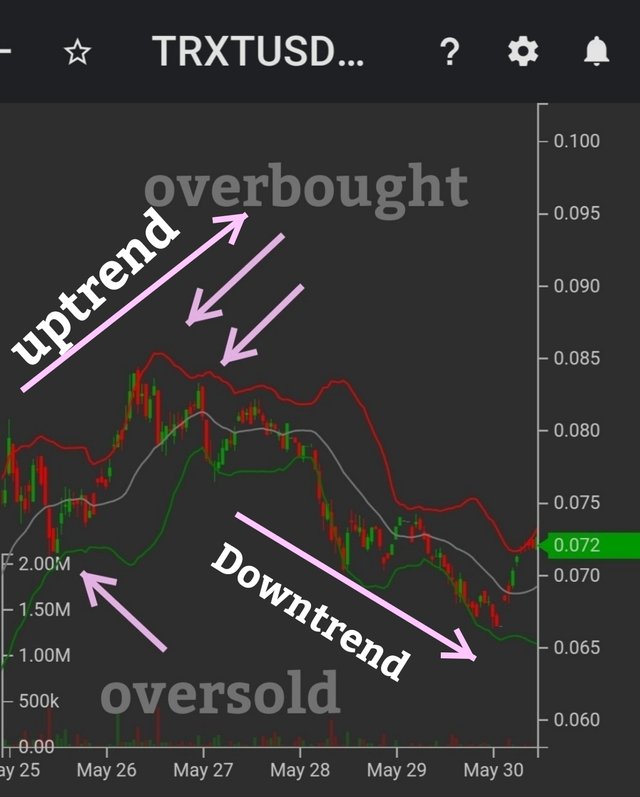
TRX/USDT indicating overbough and oversold points and therfore sell and buy signals respectively. For buy /sell remember, if the price crosses middle band from below upward, it is bullish signal and if it crosses middle band from above downwards, it is bearish trend.

BCH/USDT showing Price breakout above resistance.
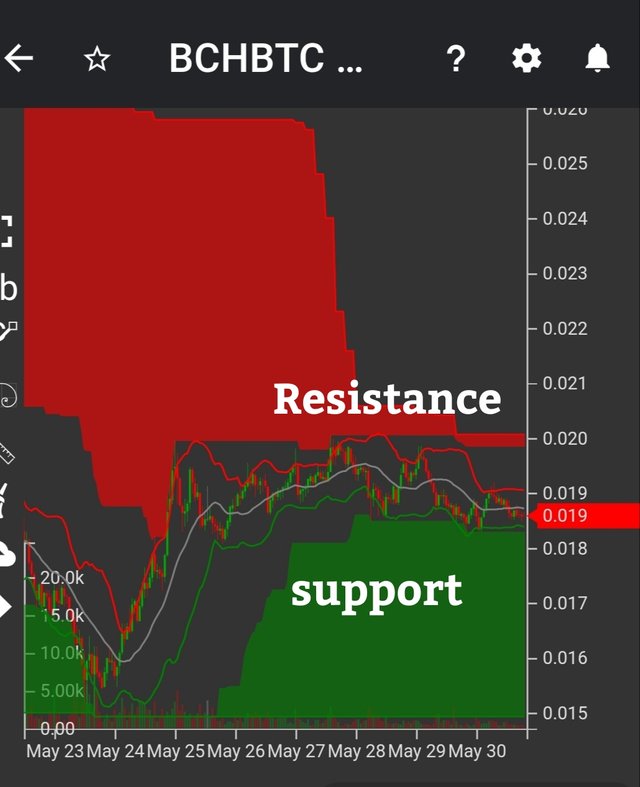
Support and Resistance for BCH/BTC. As seen above, support and resistance coincide with the falling and rising ends of lower and upper bands respectively.
Hello @drqamu,
Thank you for participating in the 8th Week Crypto Course in its second season and for your efforts to complete the suggested tasks, you deserve a 10/10 rating, according to the following scale:
My review :
An article with excellent content due to your diligence in all previous lessons and your attempt to excel every time. This time, you shined in your answers to the questions, as you followed a clear methodology that enabled you to analyze what is needed accurately.
Thanks again for your effort, and we look forward to reading your next work.
Sincerely,@kouba01
Thank you sir. Your way of explaining things is so clear that we as students need very little efforts to excel.
#affable
Nice presentation from you.
For Explaing Bollinger Bands you use screen shots.Can I know which Exchage Platform you use It.
#affable #india
Thank you.
I am using tradiny.
#affable
Oh ok. Thanks for informing.
#affable #india
You have explained every question beautifully,so you deserve the rating,given by professor @kouba01
#affable #india