Crypto Academy Week 15 , Homework post for [ @yohan2on].. Swing trading strategy.
What is Swing trading?
Pros of Swing Trading.
it is less time consuming because in swing trading traders don't need sticking to the trading platforms to keep watching trends. Traders set trade according to their strategy and wait for desired trend and execute the trade.
It is less stressful than day trading.
It makes use of technical analysis strategy which is reliable form of strategy to follow.
Good returns are expected in short time.
Cons of swing trading.
As trade doesn't end in one session, traders are exposed to overnight and weekend risks.
As traders hold for more than one trading session, abrupt trading reversals can result in significant losses.
At times long term trends are missed in this type of trading.
it requires sound technical knowledge to flourish.
Gap up and gap down risks can cause signifcant loss
Technical Analysis of crypto-pairs in different time frames.
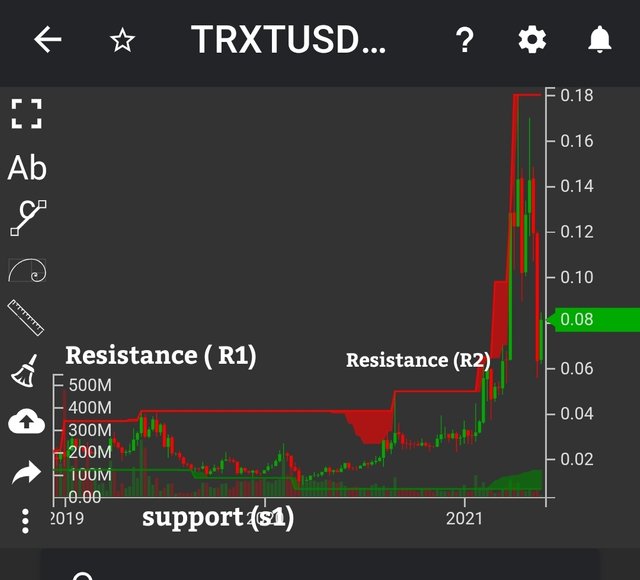
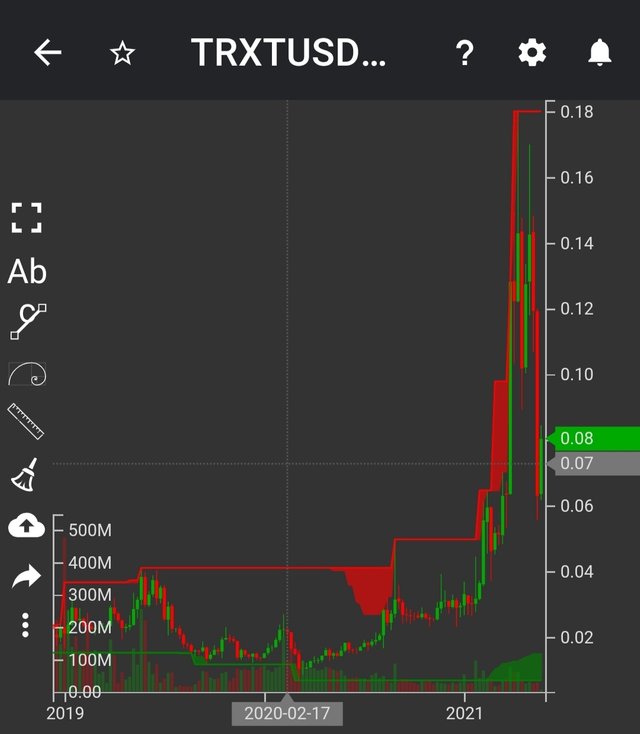
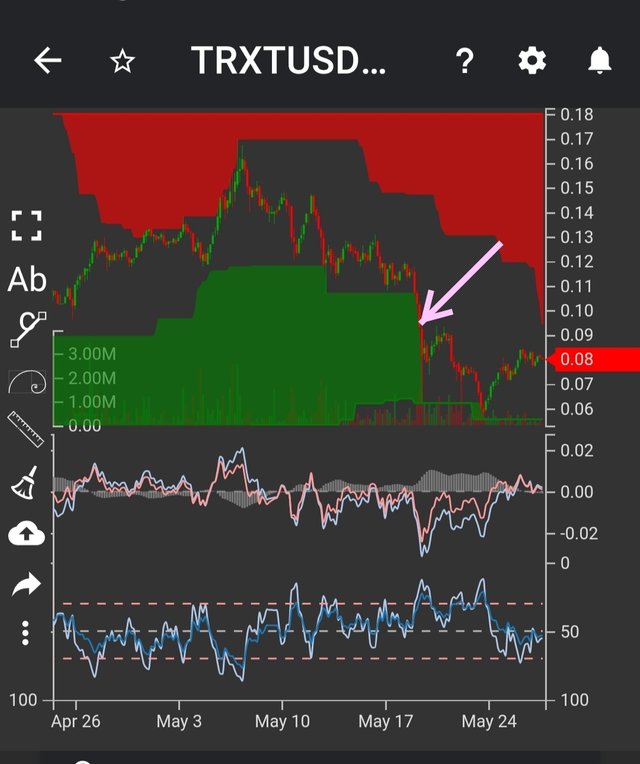
Differenr time frames of crypto pair to be traded has to be used as memtioned above and demonstrated below. However, to enter or exit, considering price charts along with indicators is mandatory. I think use of basic indicators like support, Resistance and momentum indicators like MACD and RSI when applied to short time frame charts can be potential good tools to determine entry and exit points. Also what i have heard many professional traders saying that don't use multiple indicators on same chart. It may only lead to confusion. However, to filter out false signals few indicators and multiple time frames usually suffice. Keeping same strategy in view, i am using 1month and 1 week chart to find the long term trend of the tradeing pair. Then to enter or exit into the trade, 4 hour chart with support, resistance , RSI and MACD and candle stick pattern like double top and double bottom are doing wonders.
Timeframe : Month
Weekly time frame
Daily timeframe.
Please note that don't forget to set stop loss in your trade. It is usually set below previous low. As it is not possible that all trades may always go in your favour.
Enter trade only after self accessment of risk /benefit ratio and on that basis that set stop loss and target profit.
Select the amount to be traded only that much as you are willing to lose.


Hello @drqamu,
Thank you for participating in the 7th Week Crypto Course in its second season and for your efforts to complete the suggested tasks, you deserve a 7/10 rating, according to the following scale:
My review :
Well-content article in which I try to use various analytical techniques to determine the signals provided by the indicators used. What your work lacks is an in-depth analysis of other aspects of this topic, such as your trade management.
Thanks again for your effort, and we look forward to reading your next work.
Sincerely,@kouba01