Crypto Academy Season 4 , week 2 | Homework post for professor for [@reddileep] : [Heikin-Ashi Trading Strategy
Continuing learning in cryptoacademy , gradually i am getting to learn new concepts. Today i am writing homework post set by professor @reddileep which is about Heikin-Ashi strategy. Let's begin.
Define Heikin-Ashi Technique in your own words.
Heikin-Ashi is composed of two words , heikin means *average * and Ashi means bar. So Heikin-Ashi is Japanese name for average bar. Heikin-Ashi technique uses heiken- ashi candlesticks to filter out the noise generated due to frequent price changes in assets and therefore average out the price to give clear picture of trend in the market. Heikin- Ashi charts also help to predict forthcoming price action based on different rules which we shall discuss larer.
Heikin-ashi charts make use of averaged out price based on two periods to construct candlesticks. Therefore the price shown on Heikin-Ashi is not the actual price of the asset at that point of time.
Make your own research and differentiate between the traditional candlestick chart and the Heikin-Ashi chart. (Screenshots required from both chart patterns)
| Traditional candlesticks | Heiken-Ashi |
|---|---|
| These charts look complicated because of noise generated due to frequent change in price of assets | These charts look smooth because of filtering out of noise |
| These charts don't clearly identify the trend | These charts provide clear visual picture of trend |
| There is no clear demarcation of candles on the basis of color | Candles representing a particular trend are of same color. Color changes only with change of trend |
| Candles are formed on the basis of open, highh, low and closing price of asset during a particular time frame | These candles are formed on the basis of various calculations |
| These candle determine trend on the basis of candle stick patrerns | Trend is determined by a particular group of candles whether bullish or bearish |
| These candles work well on all time frames | These candles work well on larger time frames |
| Each candle starts from closing of previous candle | Candlestick starts from middle of previous candle |
| Price on chart is the current price of candles | Price on chart is not current price of candle as candles average out price in heiken-ashi. |
| Gaps are seen when price open higher or lower than the previous close | No gaps are seen |
Explain the Heikin-Ashi Formula. (In addition to simply stating the formula, you should provide a clear explanation about the calculation)
- Opening price of current bar is calculated by summation of opening of previous bar and closing of previous bar and dividing that summation by 2. So opening of any candle will be at mid point of previous candle .
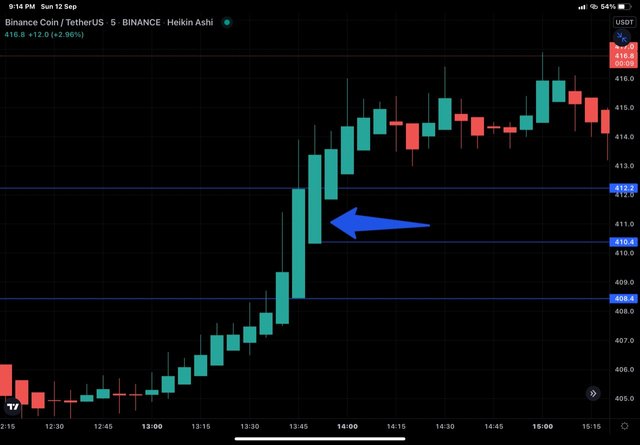
In the screenshot of BNB/USDT chart above, opening price of candle marked with arrow is $410 which is obtained by dividing opening and closing of previous candle by 2.
Opening price of previous candle = $408 .
Closing of previous candle = $412
Opening of target candle = 408+412 / 2 = 410
- Closing of current bar is calculated by summation of open, close, high and low price of current normal Japanese candle stick ( not Heikin Ashi candlestick) and dividing it by 4.
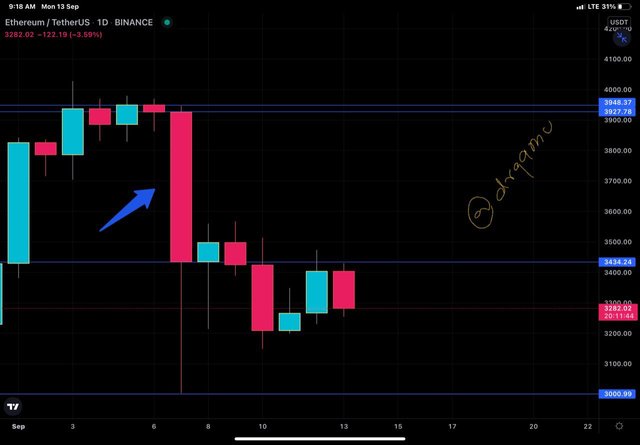
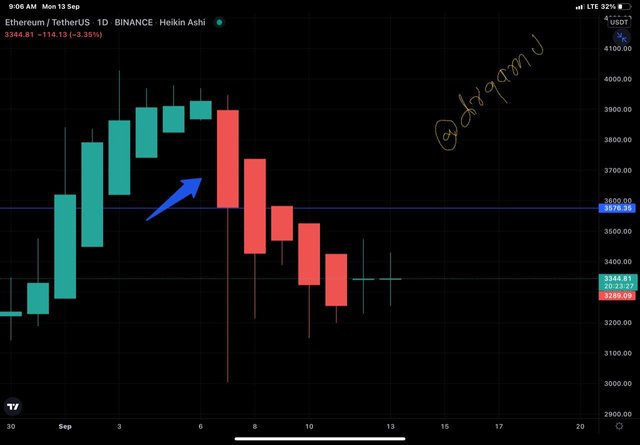
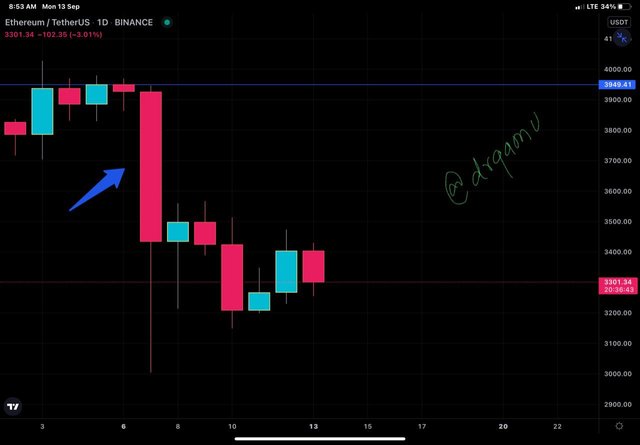
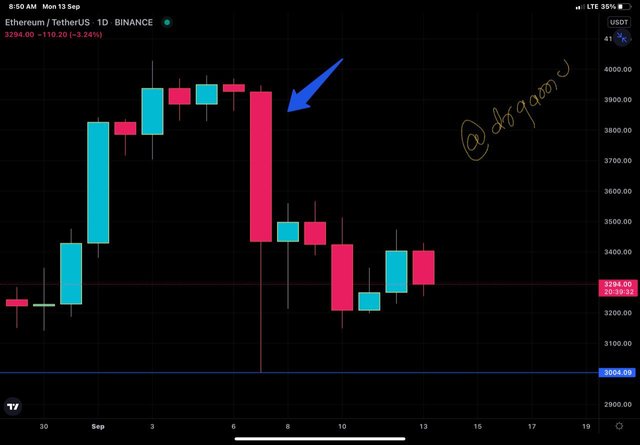
In the ETH/USDT chart (right) above, closing price of Heikin-Ashi is $3004 ( ignoring decimals). It is obtained by summation of opening price, closing price, high and low of normal candlesticks (left) for same period and dividing by 4.
Opening price of normal candle = $3927.
Closing price candle = $3434
High of previous candle = $3948
Low of previous candle = $3000
Closing of target candle = 3928+3434+ 3949 + 3000 / 4= 3576 ( ignoring decimals)
- High of Heikin Ashi is maximum value among high, open and close of the normal candlestick corresponding to Heikin-Ashi for that period.
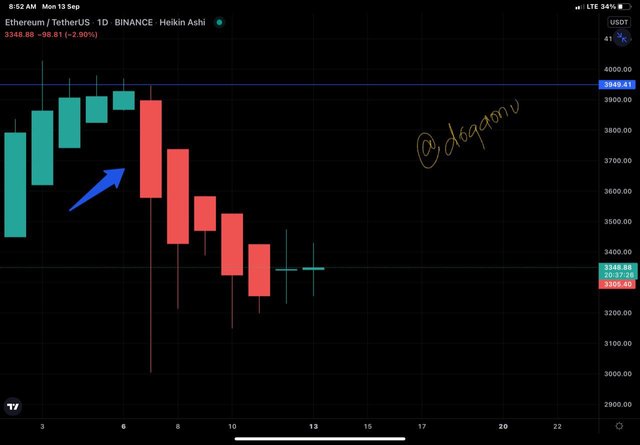
In the screenshot above , among all the three Prices of normal candlestick, the highest value is of high price and that is the high of Heikin- Ashi .
- Low of Heikin-Ashi is lowest value among low, open and closing price of normal candlestick corresponding to Heikin-Ashi for that period.

In the ETH/USDT screenshot above , we can see that among all the three values ( low open and close) , the lowest value is of low price and that is 3004.09 and that is exactly the low of Heikin- Ashi .
Graphically explain trends and buying opportunities through Heikin-Ashi Candles. (Screenshots required)
To understand trends in Heikin-Ashi Candlesticks , we need to be familiar with 3 types of candles.
Bullish Candle : A green candle with a wick above the body.
Bearish Candle: A red candle with wick below the body.
Indecision Candle : A candle with wick both above and below the body.
- Uptrend : in Heiken-Ashi, bullish trend is shown by series of green colored candles with a wick above the body or candle with each subsequent candle opening in the middle of previous candle and closing usually above the closing of previous candle.
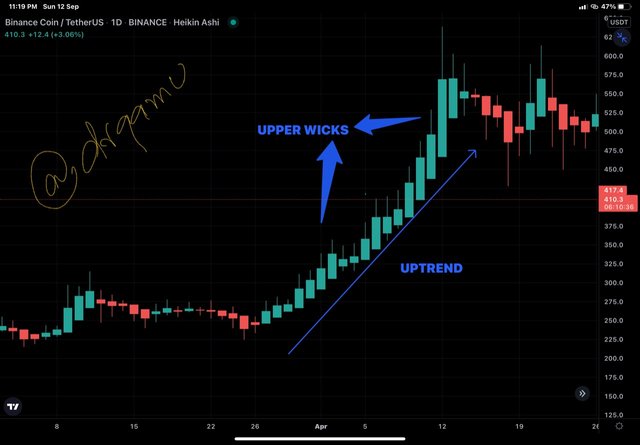
BNB/USDT chart showing bullish trend
- Downtrend : in Heiken-Ashi, bearish trend is shown by series of red colored candles with a wick below the body or candle with each subsequent candle opening in the middle of previous candle and closing usually below the closing of previous candle.
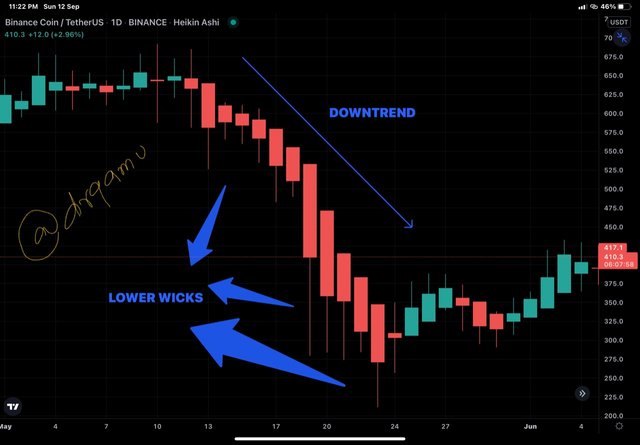
BNB/USDT chart showing downtrend
Buying opportunity.
To spot buying opportunity we should look for indecision within the market and than spot the indecision candle followed by bullish candle. Bullish candle following indecision candle is a buy signal.
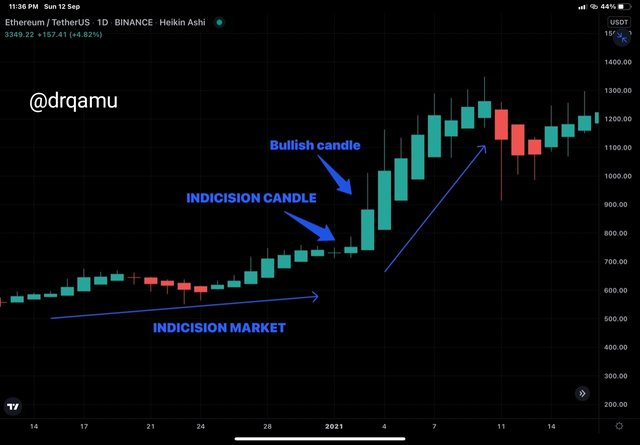
indecision market followed by indecision candle and than buy signal at bullish candle
Is it possible to transact only with signals received using the Heikin-Ashi Technique? Explain the reasons for your answer.
No indicator or strategy is 100% reliable under any circumstances. Same holds true for Heiken-Ashi technique. HA technique has certain limitations like :
Firstly, this technique is not useful for intraday traders because intraday trade is carried out on smaller time frames. As it takes into consideration average price over two periods , trade set up takes longer time to manifest.
The closing price of Heiken-Ashi is not the actual closing price but is average closing price. So while analysing market on the basis of
previous closing price, HA is not useful.
As HA tries to average out the price, the actual changes that market has undergone are obscured.
HA doesn't show gaps. Gaps provide important signals and trading opportunities. So these are missed with HA.
Sometimes HA give false signal even on larger time frames. Let me give an example :
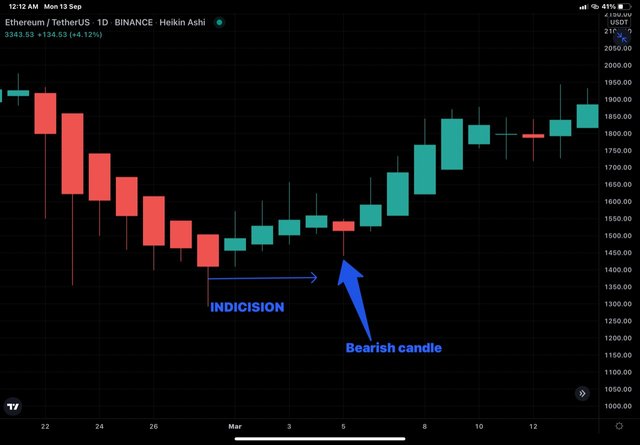
Indecision within the market is followed by a bearish candle, if we short the market here, we are going to land in trouble with subsequent bullish rally of Price.
By using a Demo account, perform both Buy and Sell orders using Heikin-Ashi+ 55 EMA+21 EMA.
Sell trade
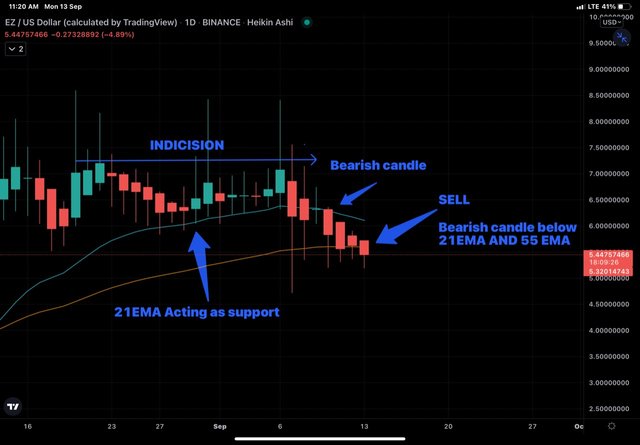
In EZ/USD chart above, we can see that indecision in the market is followed by bearish candle. To further confirm it, we wait for a bearish candle to go below EMA 21 and EMA 55. I take sell trade at the candle that opens below both the EMI and place stoploss and take profit such that risk reward ratio is equal to 1:2.
Buy trade
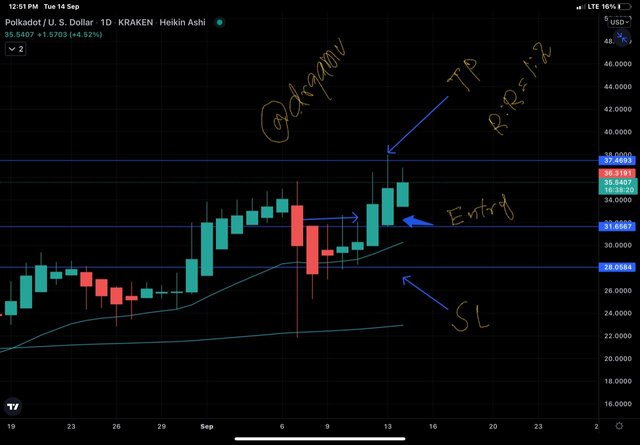
In the palkadot/USDT chart above, indicision in the market is followed by bullish candle. But to be sure i took buy trade at second bullish candle and set SL and TP such that risk : reward ratio 1:1.5 .
Conclusion
Chart patterns are graphical representation of price action. There are many types or chart patrerns in the market like line chart, Japanese candle stick chart, heikin ashi chart etc. Each of these chart patrerns have specific peculiarities . Heikin - Ashi technique tries to filter out frequent price changes and give a smooth appearance of charts and trends . They are more useful for swing traders as these charts work well on bugger time frames. When these charts are used along with other indicators like exponential moving averages and stochastic RSI, these charts are potential tools in the hands of swing traders and provide valuable signals.