Crypto Academy Season 4 , week 1 | Homework post for professor [ @allbert] : Trading with Strong, Weak and Gap Levels.
I am delighted to take part in season 4 of cryptoacademy. New lessons full of new concepts have been posted by professors. Today i am writing homework post set by professor @albert which is about strong levels and Gaps. Let's begin.
Graphically, explain the difference between Weak and Strong Levels. (Screenshots required) Explain what happens in the market for these differences to occur.
To understand difference between weak and strong support and resistance levels, we should first understand what support and resistance mean .
Support refers to a price level from which a downtrending rally of price is is expected to halt and reverse its direction whereas resistance refers to a price level where an upward moving price railly is expected to halt and reverse its direction. To put it simply , we can say that , at support level downtrend is expected to change its direction and at resistance level an uptrend is expected to change its direction.
Now coming to strong levels. Strong support refers to price level which is touched by a down going price rally multiple times or we can say that downtrend halts at this level multiple times and gets converted into an uptrend whereas at weak support level price bounces back only once or twice.
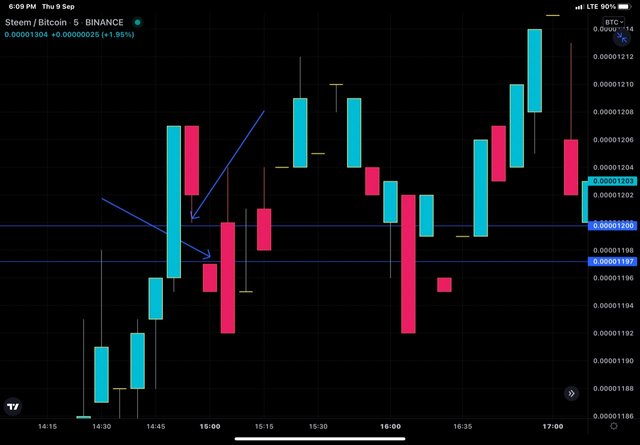
Screenehot taken from my trading view app showing strong support level
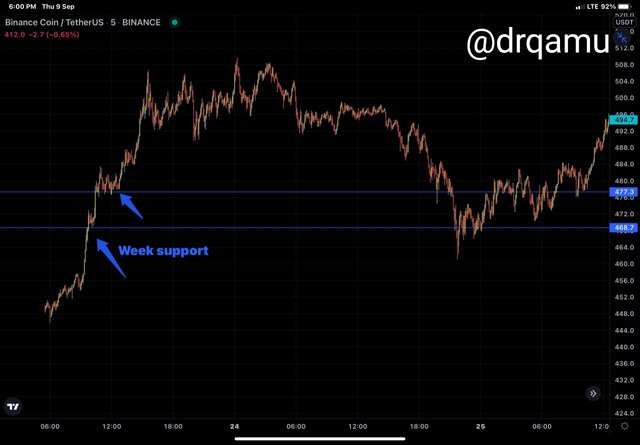
Screenehot taken from my trading view app showing weak support level
Strong resistance level refers to price level where an uptrending rally of price halts multiple times and reverse its direction whereas at weak resistance level price bonces back only once or twice.
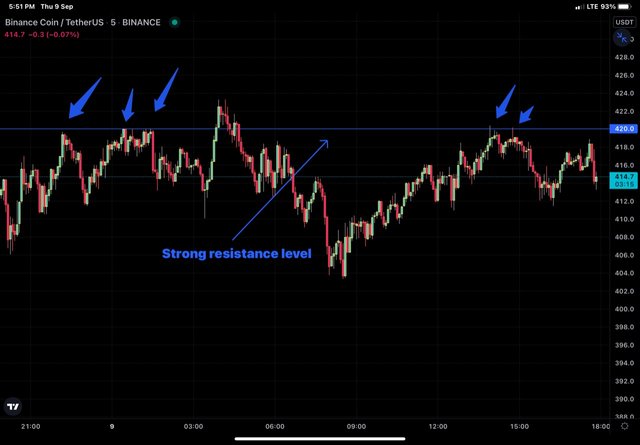
Screenehot taken from my trading view app showing strong resistance level
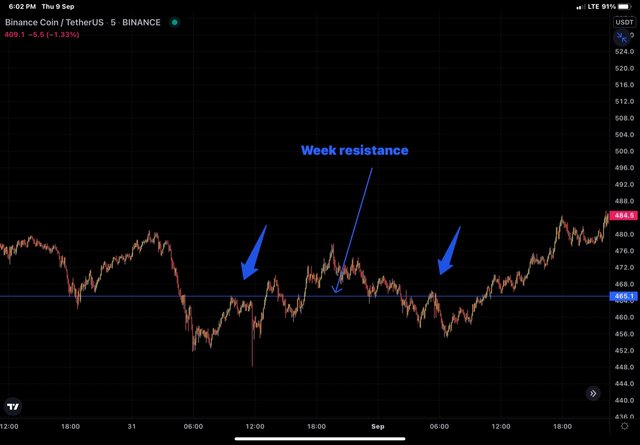
Screenehot taken from my trading view app showing weak resistance support level
Significance of strong and weak level is that strong levels are more reliable then weak levels. As for market dynamics is concerned, let's try to understand what changes take place in market, that results in formation of these levels.
At support level, there are pending buy orders and depending upon the number and volume of orders, level may be strong or week. If large mumber and or high volume orders are pending at a particular level, strong support level is formed. Because of buy orders, demand vs supply ratio is increased and we know that increase in demand, increases price. At weak support level, only small quantity and volume of buy orders are there.
At resistance levels, there are pending sell orders and depending upon the number and volume of orders, level may be strong or week. If large mumber and or high volume sell orders are pending at a particular level, strong resistance level is formed. Because of sell orders, demand vs supply ratio is decreased and we know that drcrease in demand or increase in supply, decreases price. At weak resistance level, only small quantity and volume of sell orders are there.
It is not like that market will keep on moving between fixed support and resistance levels but these levels do break and at times support may become future resistnace and resistance may become future support.
Explain what a Gap is. (Required Screenshots) What happens in the market to cause It.
A gap is a discontinuation or space seen in price action on the chart of an asset (crypto, stock, forex etc) that results due to some underlying change in the fundamental or technical parameters related to that asset. Such gaps have been thoroughly studied by maket analysts and have been seen to reflect some signal that can be used to take profit from the market.
Gap shown by STEEM at its price between 0.00001197 BTC and 0.00001200 BTC.
On candlestick charts , such gaps are seen as skipping of certain price level or we can see that opening/closing of subsequent candle is not in continuation to the closing/opening of previous candle. As seen in screenshot above, gap between 2 bearish candle skipping 0.00000003 BTC levels.
As for market dynamics is concerned, these gaps are created due to sudden influx or efflux ( buy/sell) of large volume orders from or into the market that results in sudden and abrupt change in the price of an asset and therefore skipping of interviening price levels.
Explain the types of Gap (Screenshots required, it is not allowed to use the same images of the class).
There are three major types of gaps which are discussed below.
Breakaway Gap : it is the strongest gap. When the market is in range and the range is broken by a gap, it mostly happens at the beginning of a new trend.
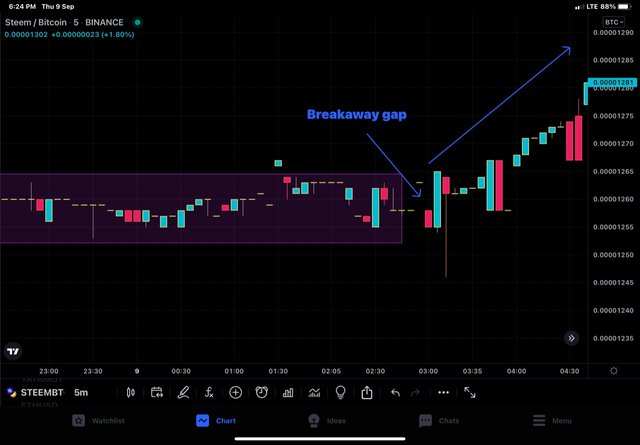
Screenehot taken from my trading view app showing breakaway gapRun Away Gap: it is a type of a gap formed somewhere in the middle of a trend following which the same trend continues. So it indicates trend continuation and is therefore a signal not to exit the trade but to keep holding.
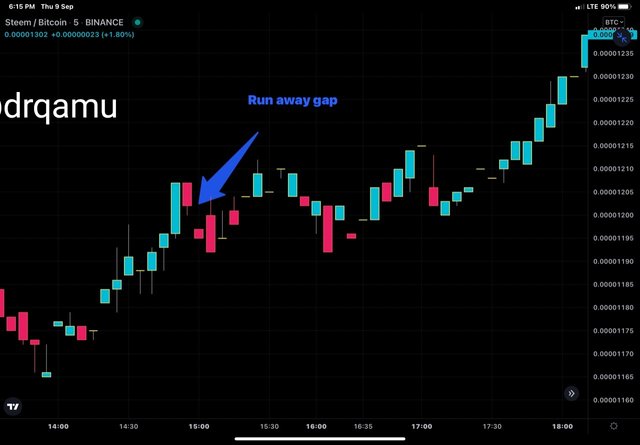
Screenehot taken from my trading view app showing run away gapExhaustion Gap : As the name implies, it is a type of gap formed at the end or exhaustion of a trend and is the indicator of forthcoming trend reversal and the subsequent reversal of the price action results in filling of the gap shortly after its formation. This filling of gap is known as fading.
Runaway gap and exhaustion gaps are difficult to find and are often spotted once they pass. So their practical utility is not significant. On the contrary, breakaway gap is easy to find and can be used as an important level from which advantage can be taken.
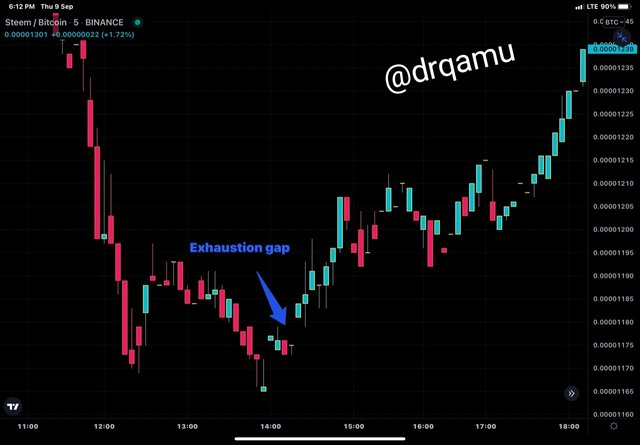
Screenehot taken from my trading view app showing exhaustion gap
Through a Demo account, perform the (buy/sell) through Strong Supports and resistances. Explain the procedure (Required Screenshots).
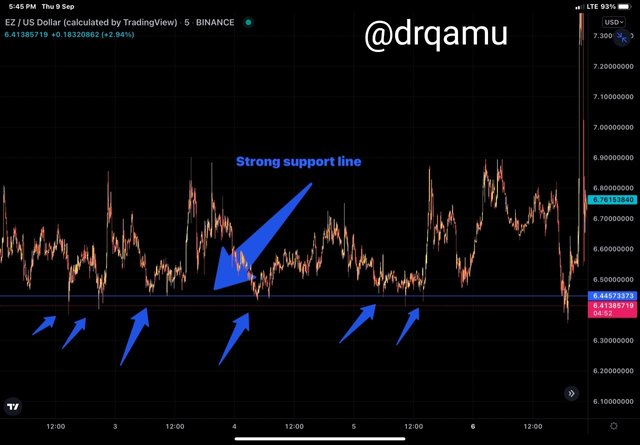
For this part of task, i have performed real trade with EZ/USD from its strong support level.
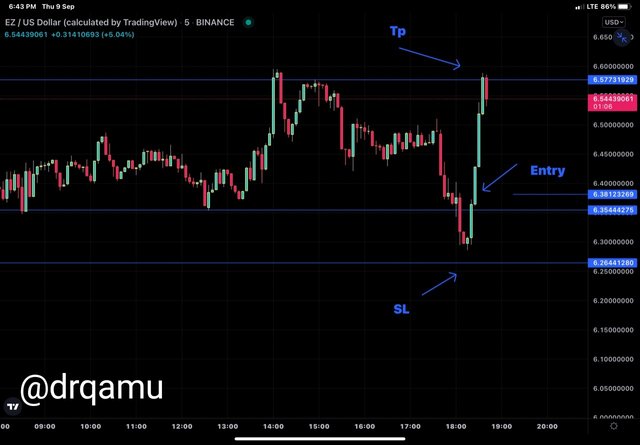
Screenshot from tradingview app
In the chart above, EZ has formed a strong support level at price of 6.354 USD. After bouncing back, i took entry at EZ price of 6.38 USD ( approx 480 INR) and set stoploss at 6.26 USDand Take profit at 6.58 USD (INR 496) . Risk reward ratio here is 1:2.5.
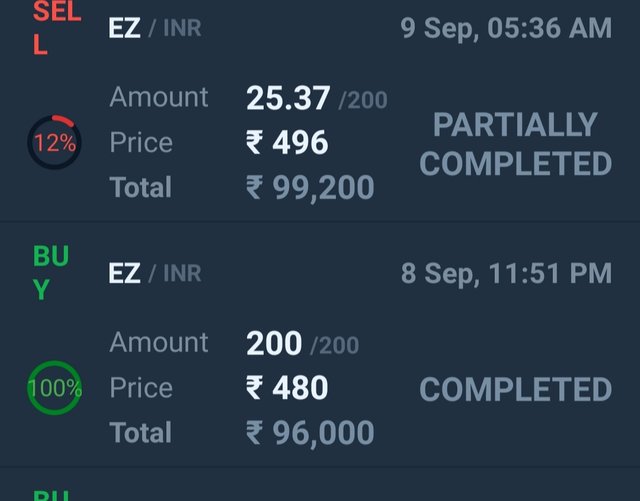
Screen shot from my wazirx account
Please note that there is difference in price between trading view and WazirX
We saw that price is respecting the levels and TP was hit and profit was booked. This emphasizes the importance of strong levels.
Through a Demo account, perform the (buy/sell) through Gaps levels. Explain the procedure (Required Screenshots).
For this task, I'll be performing trade through breakaway gap for STE3M/BTC .
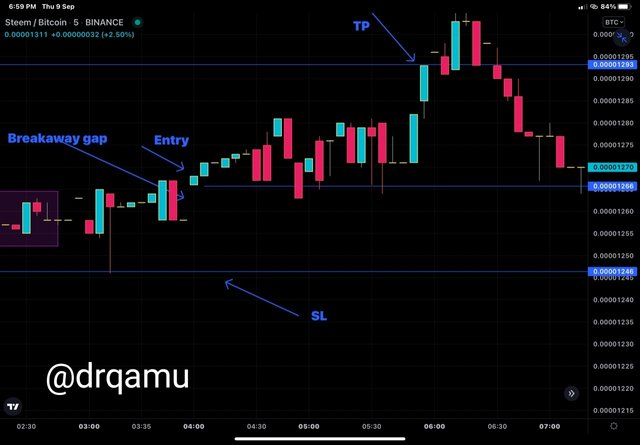
Screenshot from my trading view app
I took entry at STEEM price of 0.00001266 BTC and set stoploss at 0.00001248 and take profit at 0.00001293. Here risk reward ratio is 1: 1.5.
Reason for taking entry at 0.00001266 is break of strong resistance level of consolidation phase which was at 0.00001260. Stoploss was set at 0.0000148 because it marks the level lower than lowest price of bearish candle behind the entry point.