Crypto Academy / Season 3 / Week 2 - Homework Post for professor @cryptokraze- Market Structure Break (MSB) Strategy to Trade Reversals.
What do you understand about Market Structure?
Volatility in terms of price is the inherent feature of cryptocurrencies so the price action is not linear, instead variable patterns are formed. The variable structures of price action formed in the market is known as the market structure.
Price of an asset can either go up or go down or remain in a particular ramge for some period of time. The price moveent in any of these directions is not fixed. It keeps on changing which means an asset which undergoes bullish trend will not continue to remain bullish , similarly an asset which undergoes bearish trend may not continue to remain beraish. Whether the price of an asset goes up or down, it does not occur linearly but it happens in specific patterns.
Crypto analysts have thoroughly studied these patterns over due course of time and have developed certain indicators and trading strategies, which if followed maximise the profit from the volatile market and minimise the loss.
Two best indicators worth mentioning before diving deep into this task are "support" and "resistance". Support represnts a price level where a dowtrend is expected to pause. During downtrend as price decreases, buyers tend to dominate the market and therefore demand of an asset increase that tries to halt the downtrend and therefore price is expected to rise. Support line prevents price from pushing further down.
Resistance represents the point where an upward trend is expected to stop, which means price of an asset is expected to come down. It marks the point
from where demand starts decreasing . So at resistance, price rally runs out of energy and tends to fall back.
Market structure for uptrend
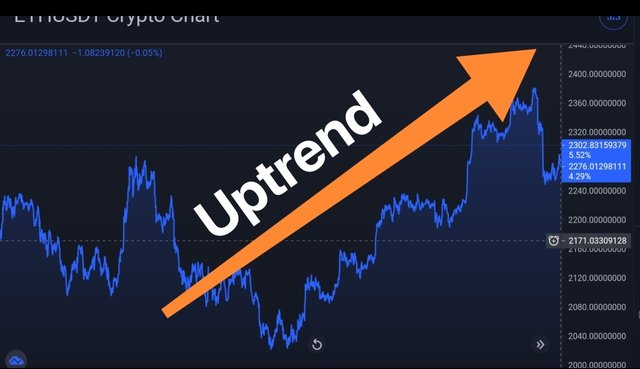
Market structure for uptrend
Market structure for uptrend involves a continuous chart pattern where in subsequent high is higher than previous high turning previous resistance level into support.
Market structure for downtrend
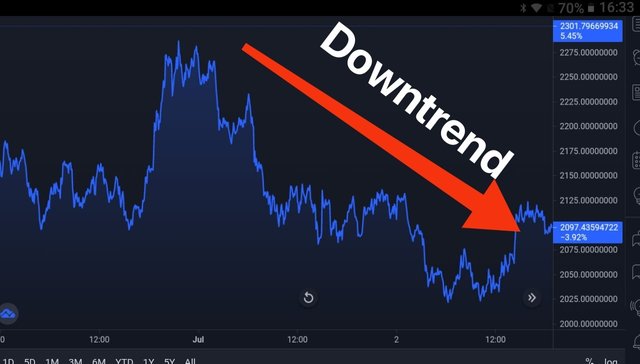
Market structure for downtrend
Market structure for downtrend involves a continuous chart pattern where in subsequent low is lower than previous low turning previous support level into resistance.
What do you understand about Lower High and Higher Low? Give Chart Examples from Crypto Assets.
Lower high
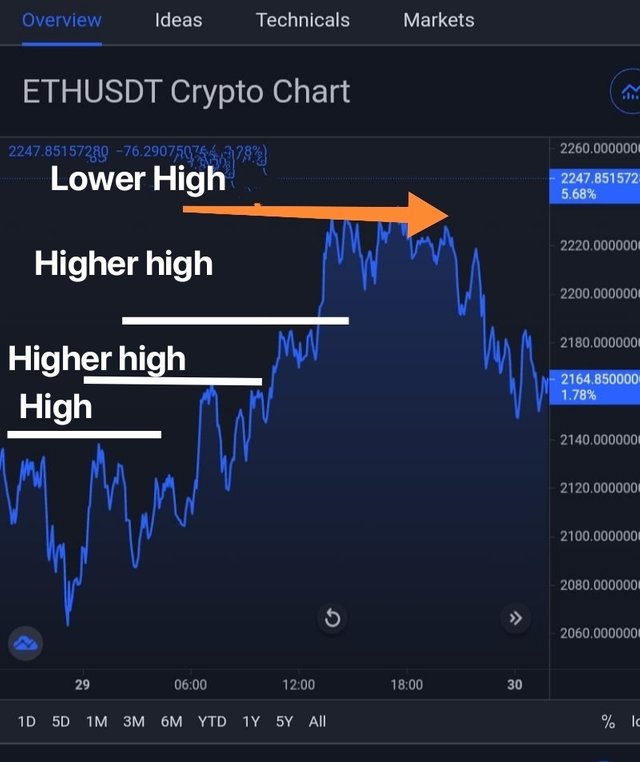
As seen above in market structure for uptrend , subsequent highs are higher than previous highs. It is during this phase that the demand for asset keeps on increasing and keeps driving the price up till a stage is reached where price correction starts taking place. Lower high is formed at the top of uptrend where subsequent price correction is iminent resulting in formation of subsequent high lower than previous high.
Higher Low
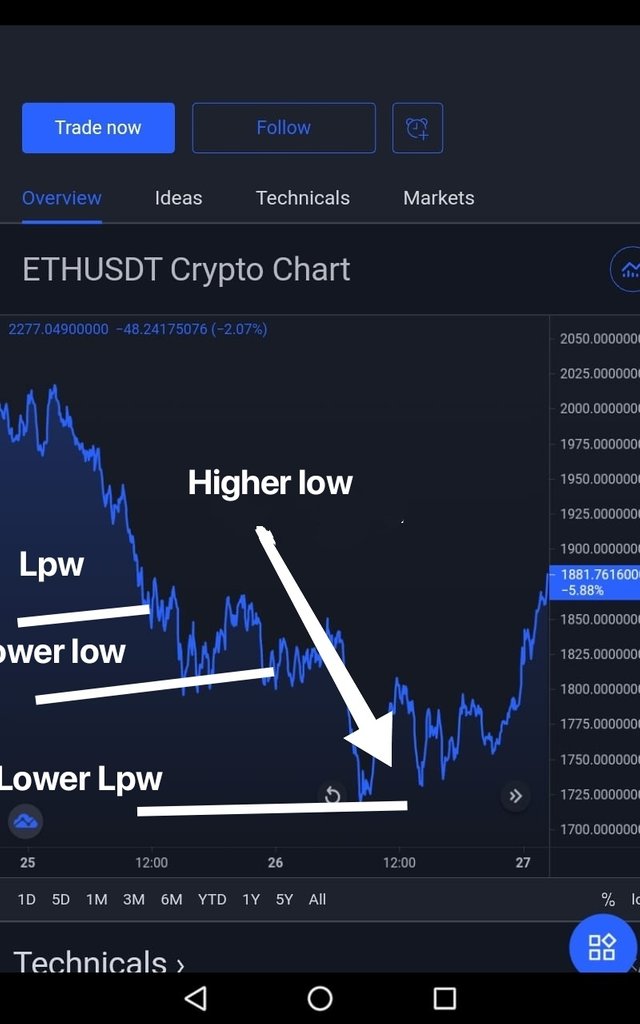
In market structure for downtrend , subsequent low are lower than previous low but this trend will not continue for ever, price correction has to take place at some point . Lower low point is formed near the bottom of downtrend where subsequent low is higher than previous low.
How will you identify Trend Reversal early using Market Structure Break? (Screenshots Needed)
Identify Trend Reversal Early with MSB
As we are now familiar with the basics of market structure. Now it is very easy to find trend reversal early for both uptrend and downtrend. Let me show you how.
Identify uptrend Reversal Early
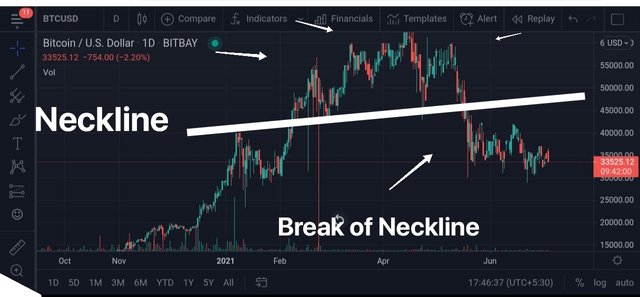
Uptrend Reversal - signal to sell
To identify trend reversal in uptrend, first we need to identify lower high at the top of uptrend. We know that lower high is formed towards top of uptrend in preparation for subsequent price correction following series of higher highs.
Second step is to find the neckline market structure. Neck line is formed towards top of uptrend above which there may be few higher highs and more importantly higher low is also above this line.
- Third and final step is to spot the break of neck line.
Let's look at chart above, we can see that lower high is formed above neckline and that is followed by break of neckline which is followed by series of price rallys down.
Identify downtrend Reversal Early
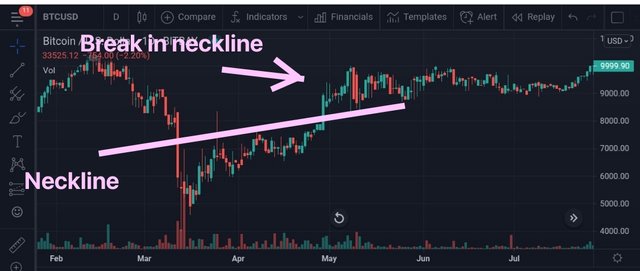
To identify trend reversal in downtrend, first we need to identify higher low at the bottom of downtrend. We know that higher low is formed towards bottom of downtrend in preparation for subsequent price correction following series of lower lows.
Second step is to find the neckline market structure. Neck line is formed towards bottom of downtrend below which there may be few lower lows and more iimportant lower high is also below this line.
Third and final step is to spot the break of neckline.
Let's look at chart above, we can see that lower high is formed above neckline and that is followed by break of neckline which is followed by series of price rallys up.
4 - Explain Trade Entry and Exit Criteria on any Crypto Asset using any time frame of your choice (Screenshots Needed)
Trade Entry Criteria for MSB Strategy.
As mentioned above, the purpose of any strategy or indicator is to help traders make entry and exit from the market at specified points dictated by preset rules so as to gain advantage from the market volatility. Let's find out these points.
BUY or entry criteria.
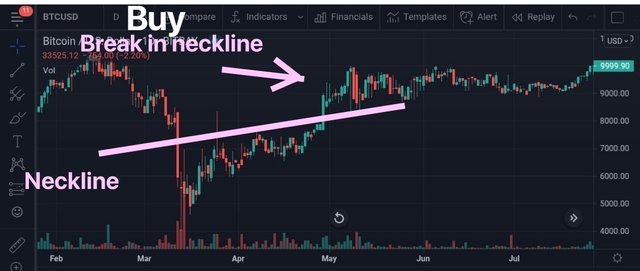
To enter into the market, one thing is clear that anyone would enter into the market when the price of asset is low. But to exactly find where to enter, there are some points or rules which we should look for, so as to find perfect entry points. So let me tell you, what to look for :
For entry look at time frames which depends upon your trading strategy. For intraday traders, lower time frames like 5 mim, 15 min, 30 mins are ideal to use. But for those planning to hold for some time, higher time are more suitable.
Find a series of price rallys down forming multiple lower lows.
Draw a neckline at the bottom of downtrend as mentioned above.
Wait for break of neckline . Break of neckline would be clear by formation of bearish candle closing above neckline. This strategy of trading is known as Market strategy Break.
Now enter into the market just above the closure of first bearish candle.
Sell or Exit point criterias.
To exit from the market, one thing is clear that anyone would exit from the market due to two possibilities , first is to book profit and second is to prevent loss. So let me tell you, what to look for :
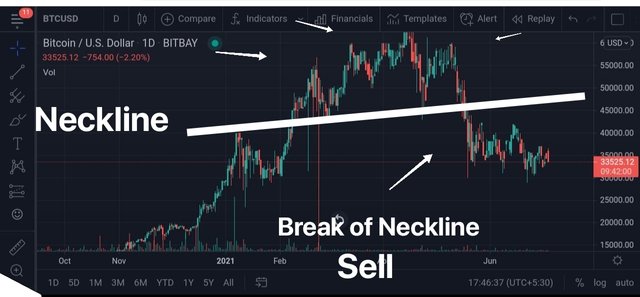
Exit to Book profit as per MSB.
For exit as per MSB, market must be towards top of uptrend where subsequent price correction is imminent.
Find a series of price rallys up forming multiple higher highs.
Draw a neckline at the top of uptrend as mentioned above.
Wait for break of neckline . Break of neckline would be clear by formation of bearish candle closing below neck line. This strategy of trading is known as Market strategy Break.
Now exit from the market just below the closure of first bearish candle.
For any market strategy take profit level to 1:1 Risk : Reward ratio.
Exit to prevent further loss.
One thing to be kept in mind is to set STOP LOSS everytime you enter into trade to prevent loss. It is especially important for Intraday traders. Holders usually do strategic selling when in profit unless a trader has some emergency when he cannot wait for any price change and exit at spot price. STOPLOSS is set above lower high point in strategic selling. If STOPLOSS gets hit, you will automatically exit from the market with minimum loss.
Place 2 demo trades on crypto assets using Market Structure Break Strategy. You can use lower timeframe for these demo trades (Screenshots Needed)
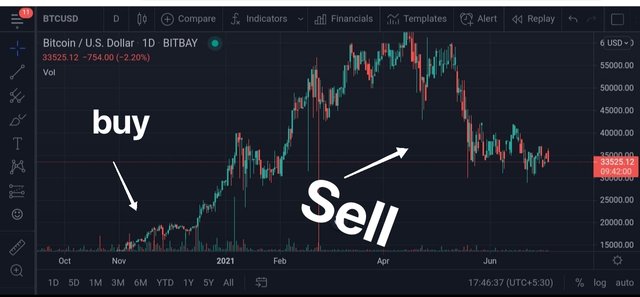
Buy trade.
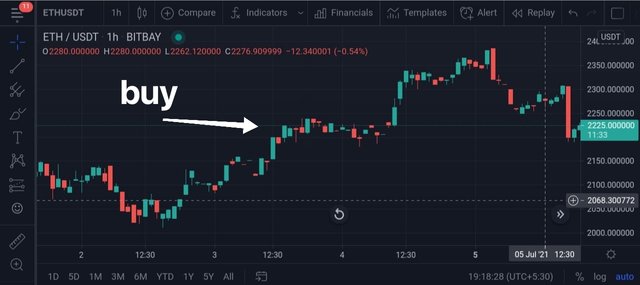
Buy trade for ETH/USDT
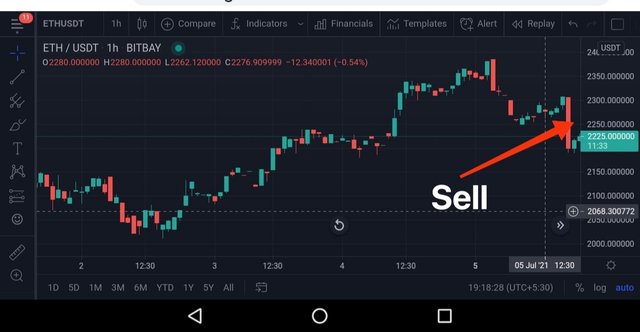
Sell trade for ETH/USDT
From the screenshot above, i have shown where to place buy order for ETH/USDT . It is exactly after break of neck line. Buy trade has to be placed immediately after closure of first bullish candle after break of neckline. You can see the price going up . But at the time of taking screenshot, trend reversal has started . So i should square off immediately after closure of first bearish candle following break of neckline.