Crypto Academy / Season 3 / Week 1 - Homework Post for [kouba01].. Ichimoku kinko hyo
Hello dear friends, hope you are all doing well. The new three tier system of cryptoacademy is a great initiative. As part of advanced tier, i am writing homework task for @kouba01 which is about an indicator Ichimoko Kinko Hyo. As the topic has been thoroughly explained by professor, let me check my understanding of the topic by doing set homework. Let's go
What is the Ichimoku Kinko Hyo indicator? What are the different lines that make it up? (screenshots required)
The Ichimoku Kinko Hyo indicator is a versatile technical indicator which was constructed by Japanese newspaper writer named Goichi Hosoda in 1960s. It is also sometimes known as ichimoko trading system because it is in itself a comprehensive indicator providing information on diverse trading parameters, which we shall discuss in forthcoming sections.
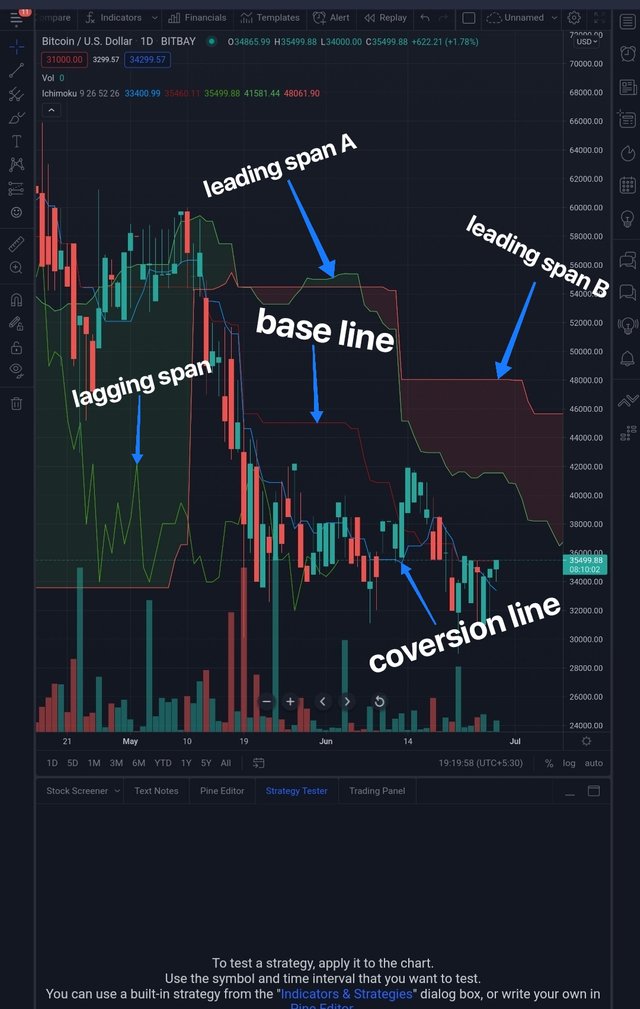
When the indicator is applied to the chart, it seems intimidating because of five lines making this indicator. To me , more frightening were the names of these lines. Let's begin by looking what are the names. The names are tenkan-sen, kijun-sen, senkou span A, senkou span B and chikou span. The space between senkou span A and senkou span B is known as kumo and is colored to form a cloud. These are basically the Japanese names. Let me tell you their english names before discussing these lines so that indicator seems friendly.
| Japanese name | English name |
|---|---|
| Tenkan-sen | Conversion line or fast line |
| Kijun-sen | Baseline or slow line |
| Senkou span A | Leading Span A |
| Senkou span B | Leading Span B |
| Chikou Span | Lagging Span |
The working of different lines shall be discussed in subsequent sections but here i would like to mention only about senkou span A , senkou span and kumo.
Senkou span A ( leading span A) forms the edge of cloud. It is calculated as (Tenkan-sen + kijun-sen)/2 plotted 26 periods ahead. Where as Senkou span B known as leading line B or leading line 2 which forms other edge is calculated as
(highest high + lowest low)/2 calculated over the previous 52 periods and plotted 26 periods ahead. So first thing to emphasize here and which needs attention here is the method of calculation for theoretical purposes.
For practical purposes, let me tell you the significance of these lines and kumo.
When the price is above the kumo (cloud) , it indicates bullish trend and therefore the senkou span A and B can serve as two support lines. When the price is below the kumo, it indicate bullish trend and therefore sankou span A and B can act as two resistance lines. If the price remains within the cloud , it is a sort of neutral signal or we can say that is is sideways market movement. Moreover, the width of cloud depends on volatility of market. More the volatility, more is the width.
How to add the Ichimoku indicator to the chart? What are its default settings? And should it be changed or not?(screenshots required)
Adding ichimoku to chart
It is very simple process just like other indicators that we added in season 2. Depending upon the trading software or platform used, we can do it. Let's say, we are using tradingview.
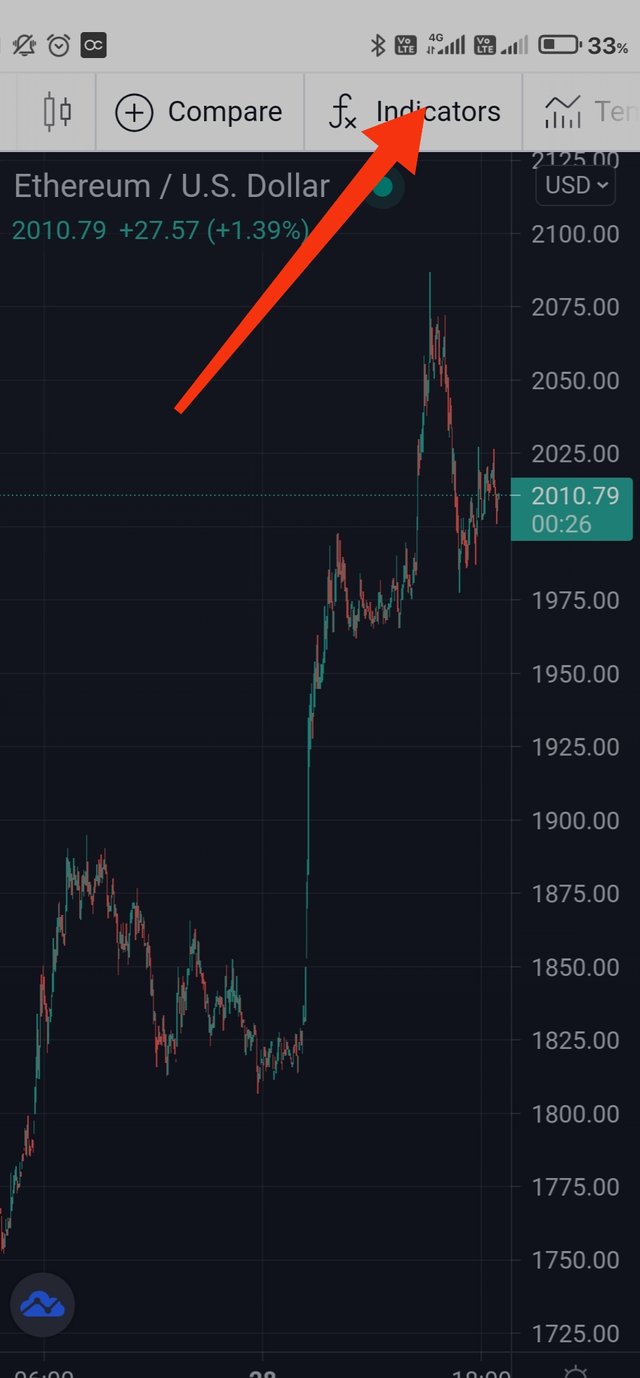
- Go to trading view app or official website. On the mainpage of app or website, click on the Chart tab from top left corner and choose a pair to look for.
Select the "fx" button located at top of chart.
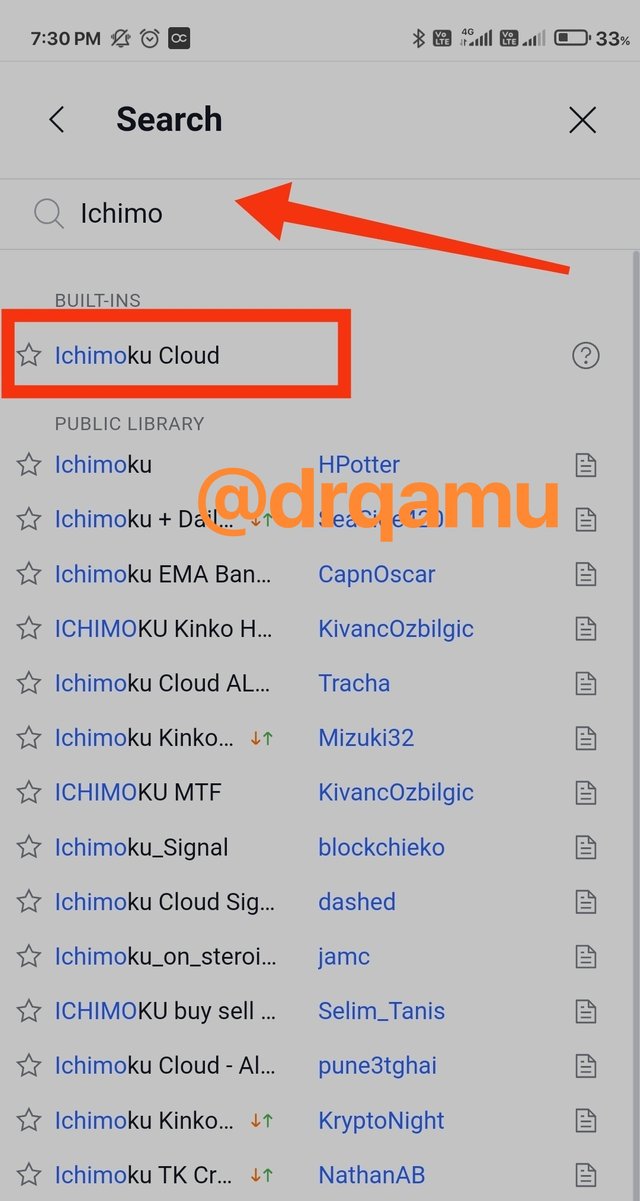
Type ichimoku in the search box.
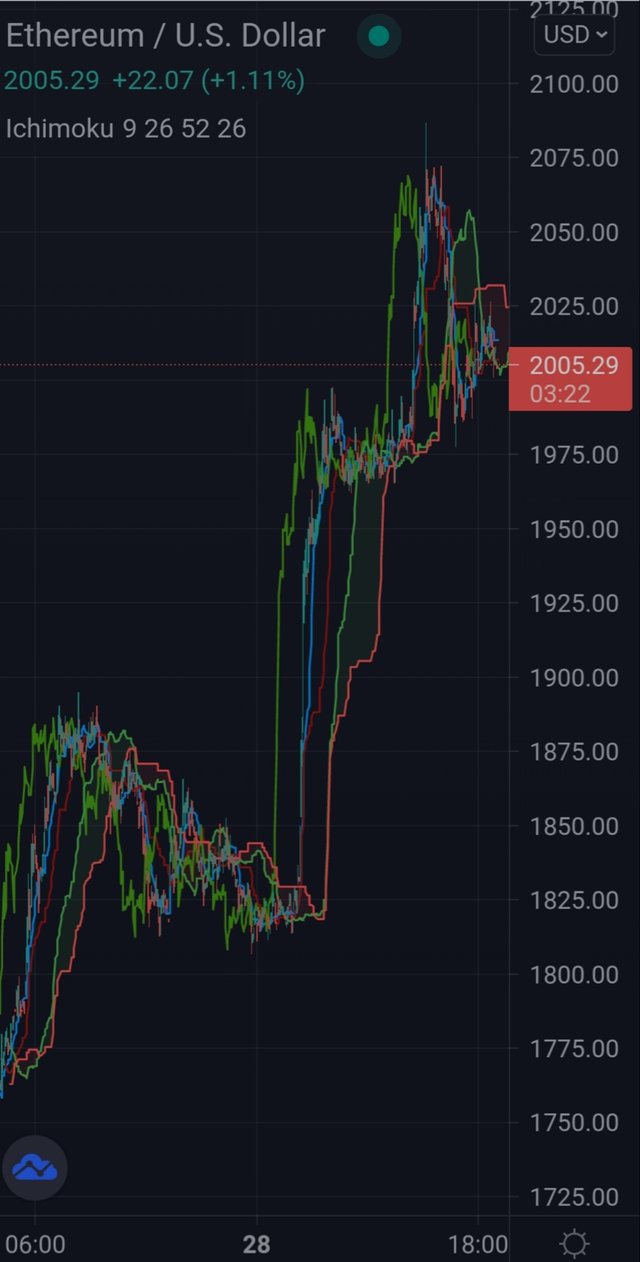
Then choose “ichimoku cloud”. It will be applied to chart.
Settings
| Japanese name | Default setting |
|---|---|
| Tenkan-sen | 9 |
| Kijun-sen | 26 |
| Senkou span A | 26 |
| Senkou span B | 52 |
| Chikou Span | 26 |
As for change in the settings is concerned, it has been seen that the default settings of 9- 26-52 have shown best results, however they are not fixed they can be changed.
How to use the Tenkan Sen line? How to use the Kijun Sen line? And How to use them simultaneously?(screenshots required)
Tenkan sen line corresponds to the median of its high amd low of the period over which it is calculated. For default setting, it represents median of 9 days high and low, which is mathametically calculated as 9 periods, hugh + Low divided by 2.
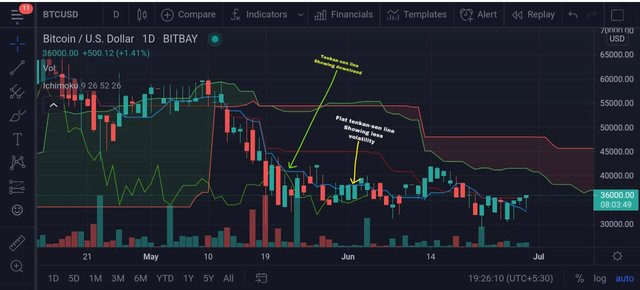
As for individual use of Tenkan sen line is concerned, it is primarily to detect market signal and short term trend . If this line is going up , it means the market is trending upwards and is short term buy signal . If the line is going downwards , it means market is in bearish trend and is therefore sell signal. On the contrary, if the line is going horizontal, it indicates ranging or sideways
movement of market.
The morphology of tenkan sen line can vary from curved line to flat, depending on volatility of market. If the market volatility is significant, the morphology will be curved because the medians will be located apart. On the other hand, if market is less volatile, there won't be significant difference among median values and the Tenken sen will be flat there. So tenkan sen curves can serve as short term support and resistance zones too.
Kijun sen line corresponds to the median of its high amd low of the period over which it is calculated. For default setting, it represents median of 26 days high and low, which is mathametically calculated as 26 period , hugh + Low divided by 2.
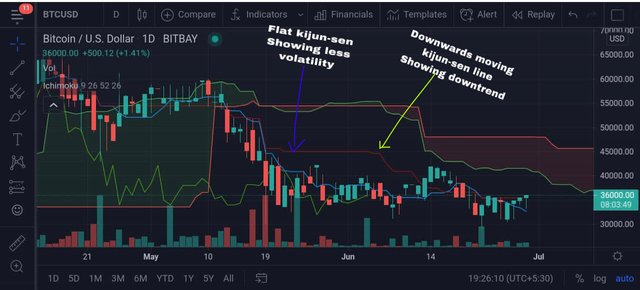
Tenkan sen downtrend and morphology
Kijou sen downtrend and topology
Kijun sen line individually signals medium term price movement, support and resistance and one more important use is that , it can be used as trailing stop line along with Tenkan sen line. Its morphology also follows the same principle as tenkan sen line .
### Simultaneous use of Tenkan sen and kijun sen line
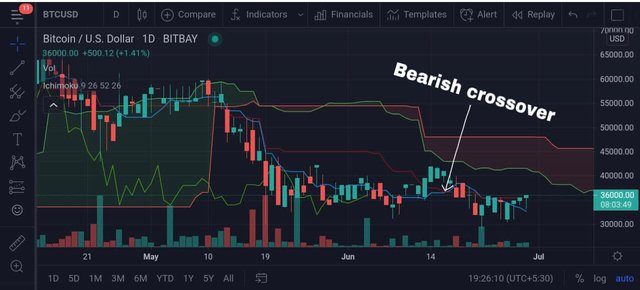
Bearish cross over of Tenkan sen and kijou sen
When conversion line crosses base line from below upwards, it is known as bullish crossover and it indicates the forthcoming bullish Trend and is therefore a buy signal. On the otherhand , when base line crosses conversion line from above downwards, it is known as bearish crossover and indicate the forthcoming bearish market and is therefore indication of sell signal. Bearish crossover is shown in screenshot above.
What is the chikou span line? And how to use it? And Why is it often neglected? (screenshots required)
Chikou Span line or lagging span line is so called because it projects current day's closing price over last 26 days. It can aid is predicting trend reversal . If chikou span crosses price line from below upwards than it indicates market going bullish because such a movement is possible only when the previous price is at lower level than the current price and vice veraa.
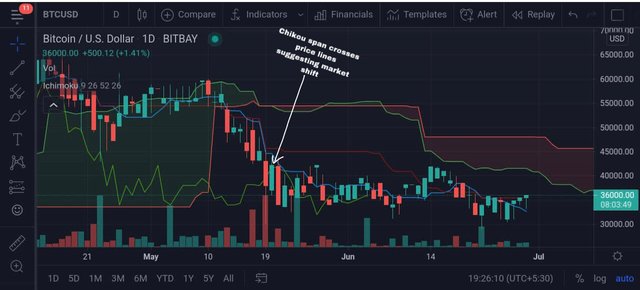 Chikou span and price line cross over
Chikou span ia often neglected by traders because it is often perceived as a line that doesn't refer to any important signal but in real sense, it has bearing on predicting strength of trend. Most of the times, we are concerned about buy/sell signal and therefore are more focused on current market status without looking at it in broader perspective.
What's the best time frame to use Ichimoku? And what is the best indicator to use with it? (screenshots required)
Best time frame depends upon your trading strategy. It is not only about the ichimoku cloud but time frame of all the indicators varies with the trading strategy as we are discussing ichimoku cloud here, for this indicator let me mention that, for an intraday trader a time frame of 5 min, 10 mins, to hours is good, For those who hold their positions long a day or weekly time frame can be used. Moreover, one should not decide only on the basis of one time frame, instead i would suggest use of multiple time frame for various perspectives of trading.
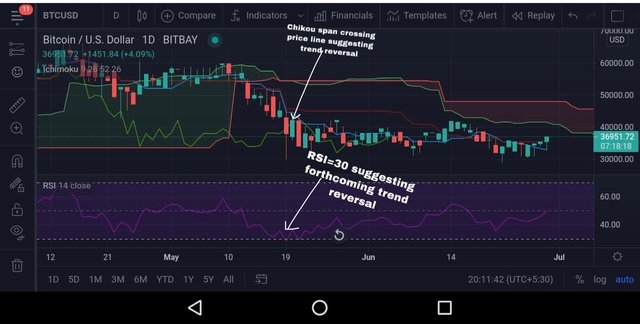
Tenkan sen and RSI together
The best indicator to use with ichimoku cloud is RSI. We know that RSI is classic indicator for signalling overbought and oversold assets. RSI value of less than 30 indicates that the asset is oversold whereas as RSI value of greater than 70 indicates that the asset is overbought and therefore both these zones are potential signals for trend reversal. So when combined with ichimoku cloud trend reversal prediction can be more precise and perfect as compared to individual use of either of these indicators.
Conclusion
Ichimoko cloud being a comprehensive indicator with multiple lines and providing diverse signals ranging from support, Resistance, current trend , future trend, trend reversal and thereby provide buy/ sell signals. Being a trustworthy indicator its reliability is reinforced when used along with other indicators like RSI.
Hello @drqamu,
Thank you for participating in the 1st Week Crypto Course in its third season and for your efforts to complete the suggested tasks, you deserve a 9/10 rating, according to the following scale:
My review :
You are as good at homework as you are my dear friend, for we find an excellent work containing careful analyzes of most of the points raised and giving your opinion clearly, other than this point:
Thanks again for your effort, and we look forward to reading your next work.
Sincerely,@kouba01
Thank you very much . I will try my best next time.
EASY! How to invest smartly & securely in a DeFi project
Click this link for more:
https://bit.ly/freecrypto_class
Discuss, have fun, and let the potential of $PRV blast on the whole universe.
Farming, Staking, & Vaults
You have been upvoted by @sapwood, a Country Representative from INDIA. We are voting with the Steemit Community Curator @steemcurator07 account to support the newcomers coming into Steemit.
Engagement is essential to foster a sense of community. Therefore we would request our members to visit each other's post and make insightful comments.
Thank you