Crypto Academy Season 3 | Homework post for [@asaj]: Vortex Indicator Strategy
Today i am writing homework task for @asaj which is about "Vortex indicator". Let's begin.
In your own words explain the vortex indicator and how it is calculated
Vortex indicator is a technical tool in the hands of traders introduced by Etienne Botes and Douglas Siepman in 2010. It is a trend following indicator composed of two differently colored ( usually green/blue and red) oscillating lines known as uptrend line (VI+) and downtrend line(VI-) .
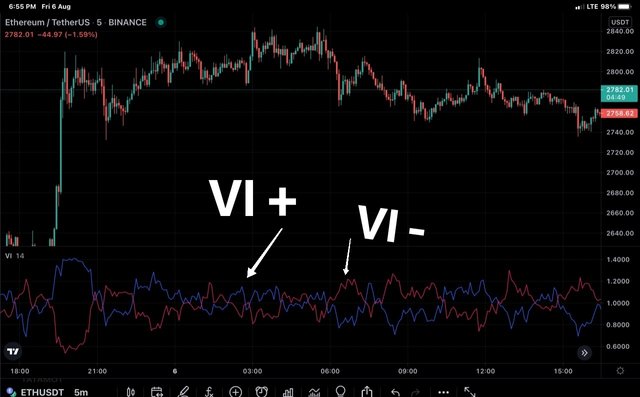
Vi+ and VI - on ETH/USDT chart
We know that market can be either bullish or bearish or can be ranging (sideways). The vortex indicator being a trend following indicator reflects market trend with the help of the two oscillating lines. The uptrend line reflects the bullish trend and the downtrend line ( red line) reflects the bearish trend. But we know that only reflection of the trend doesn't suffice for us. As a trader to take advantage of the trend, we should know entry and exit points and these signals are reflected by crossovers in the vortex indicator.
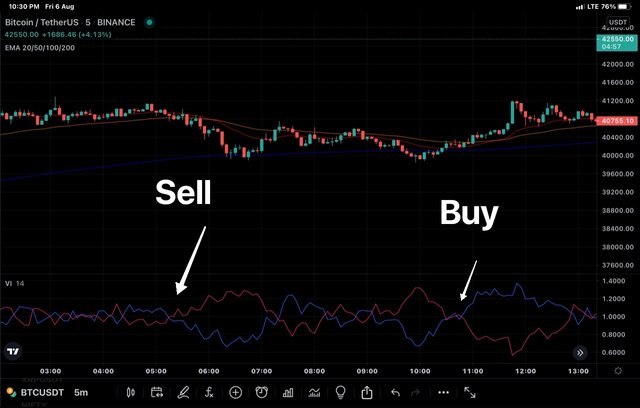
Buy and sell signals by crossovers
When the uptrend line crosses the downtrend line from below upwards, it is signalling the forthcoming bullish trend and therefore is a buy signal , on the contrary when the uptrend line crosses the downtrend line from above downwards, it reffects the forthcoming bearish trend and is therefore the sell signal.
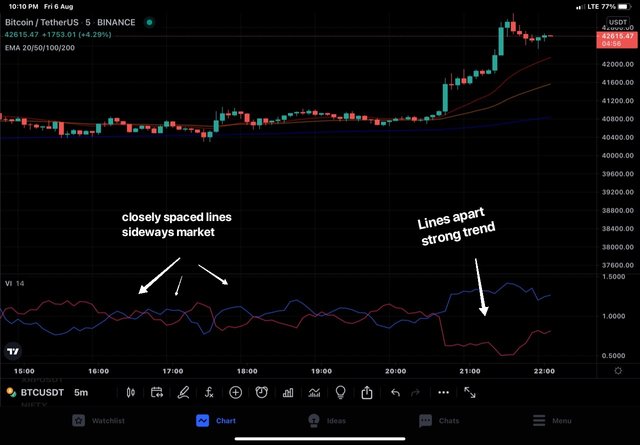
Market strength by line spacing
In addition the vortex indicator also reflects the strength of the trend. If the distance between two lines composing the vortex indicator is more , it indicates the strong trend and on the other hand if the two lines are moving closer to each other, It reflects weak or no trend or ranging market.
Calculations of indicator
Vortex indicator although simple to use and understand, its calculations seem tedious but we won't go into more technical details. Let's touch the much needed perspectives:
- True Range : For TR of vortex , we have to do some calculations and of those calculations, the one that is higher is the actual value of TR. The calculations are :
Value 1 = Current high minus current low
Value 2 = Current high minus previous close
Value 3 = Current low minus previous close
Whichever value of theae theee is higher, will be the TR.
Uptrend Movement(VM+) : The path traversed by VM+ is based on some value obtained by subtracting prior low from current hugh.
**Downtrend Movement (VM-) **: The path traversed by VM - is based on values obtained by subtracting prior high from current low.
Parameter Length : we have two oscillating waves, VM+ and VM- for which we set up period over which they are calculated, let's say 14 or 30. Here the concept is just like moving averages, we know that shorter the period of moving averages, closer will be the moving average to the price line and therefore more the chances of price movement across the line .On the contrary, longer the period of moving average, more obedient is the price action. Same holds true for vortex indicator length too. Longer period has advantage over shorter in high volatility market.
- VI+ trendine : To calculate vI+ trend line, we will make use of above mentioned calculations as
VI + = VM+/ TR ( period is same for borh)
Vi - = VM-/ TR ( period is same for both)
Please note that longer periods are preferred over shoerer periods in choppy markets.
Is the vortex indicator reliable? Explain?
Nothing is absolute in this universe and same holds true for indicators too . We have gone through so many indicators in the cryptoacademy so far and none of the indicators is without any short coming, it holds true for vortex indicator too. Vortex indicator is as reliable as any other indicator. However, it is not absolute. It sometimes gives false signals. Let's take examples from cryptocharts .
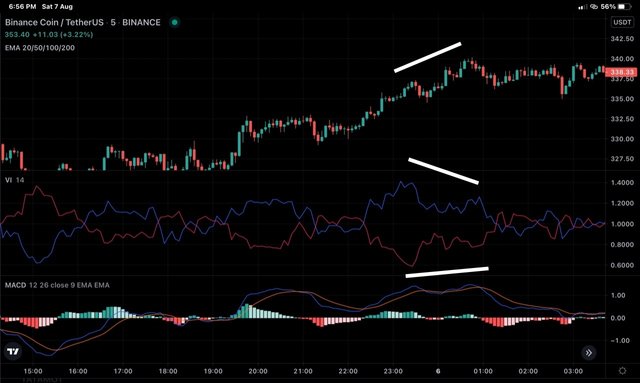
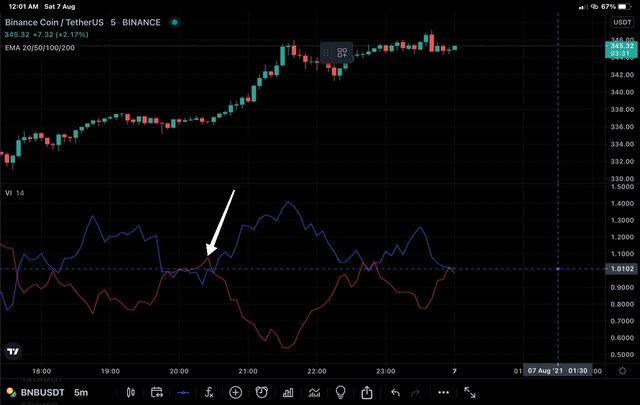
In the chart above, we can see the price of BNB going up but vortex indicator is showing downtrend while MACD shows slight variation. So here we would have missed a part of bullish trend if vortex indicator was used alone.
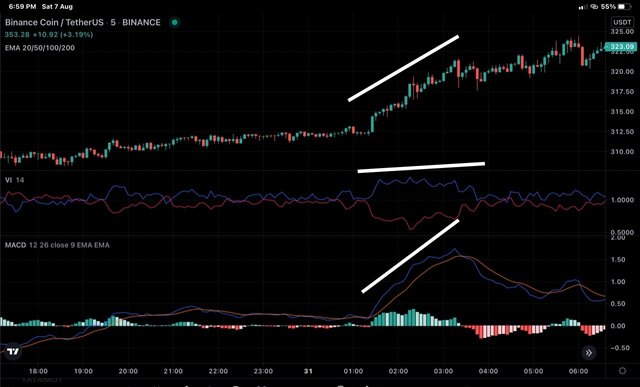
Again look at the chart above , we can see that the price of BNB going up but vortex indicator shows flatline for the corresponding time interval while as MACD signal synchronises with that of the price action. So vortex indicator alone can sometimes be misleading but is working fine otherwise all the time.
How is the vortex indicator added to a chart and what are the recommended parameters? (Screenshot required)
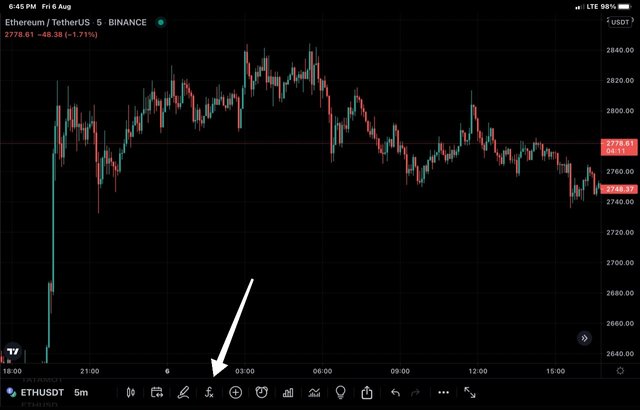
For this I'll be using trading view app. You can do it from official website of trading view too. I launched trading view app.
Select any trading pair. Chart of the pair will load.
Click on indicators from the top menu. In my case, i have Iniecators option at bottom of the chart.
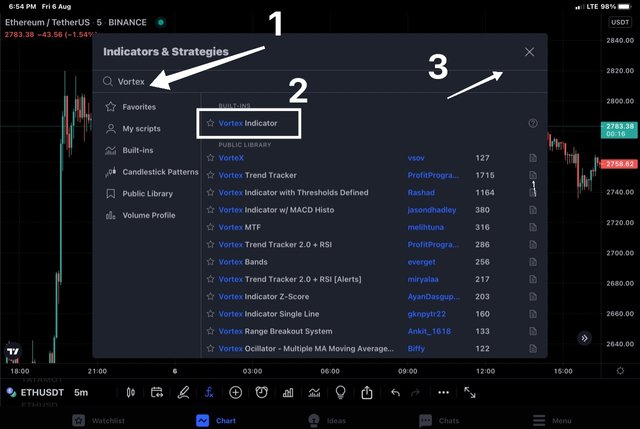
- Next we type vortex in the search box provided and select Vortex Indicator from the suggestions.
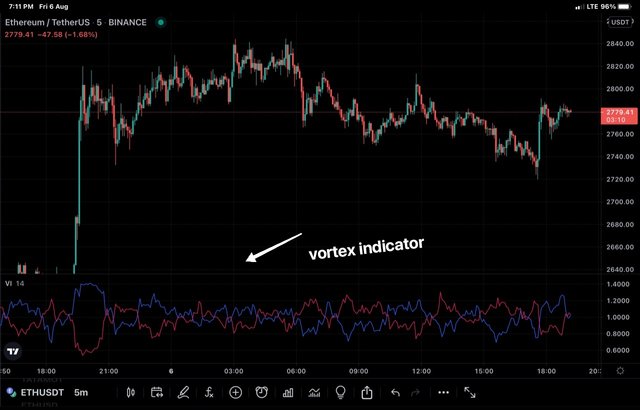
- Go back to your chart and you will find indicator loaded at bottom of your chart.
Configuration of the vortex indicator.
- Double click on vortex Indicator and chart settings will load.
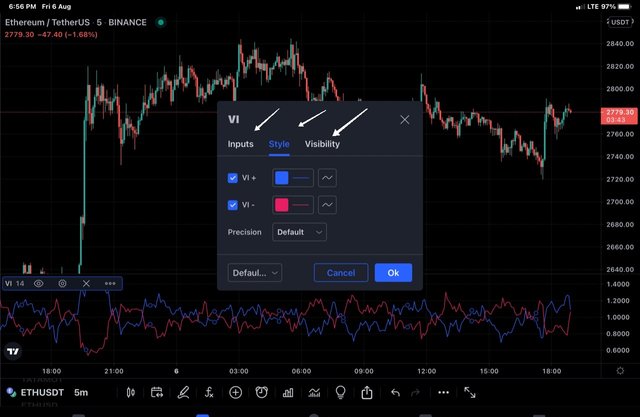
- Style settings -
Here we can choose color and precision of vortex, let's keep default settings viz positive VI as blue, negative VI as red, and precision as default. We can change these settings too.
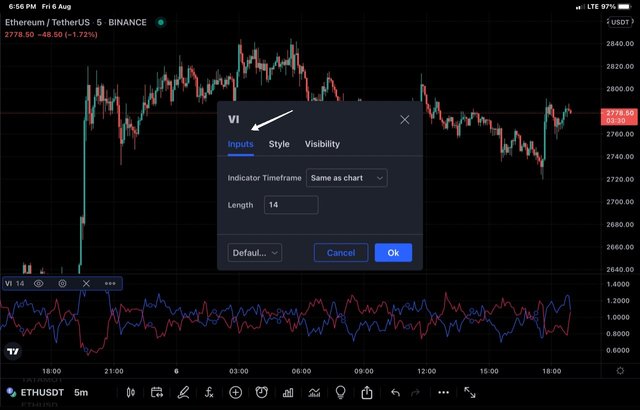
In the Inputs settings, we have indicator timeframe and length. We have to make timeframe sync with that of chart and length by default is 14. We can change it too.
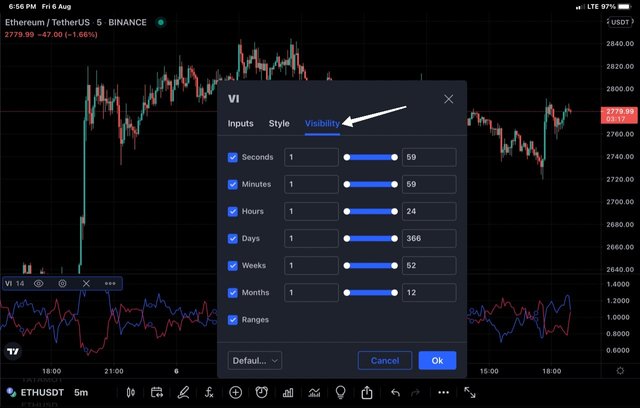
in the visibility, we have seconds , minutes, hours, days, weeks, months. Let's keep default settings for visibility.
Explain in your own words the concept of vortex indicator divergence with examples. (Screenshot required)
Two types of divergences are seen, bullish divergence and bearish divergence.
- Bullish divergence : When price of an asset is bearish but vortex indicator uptrend line shows bullish trend. Such a phenomenon is known as bullish divergence.
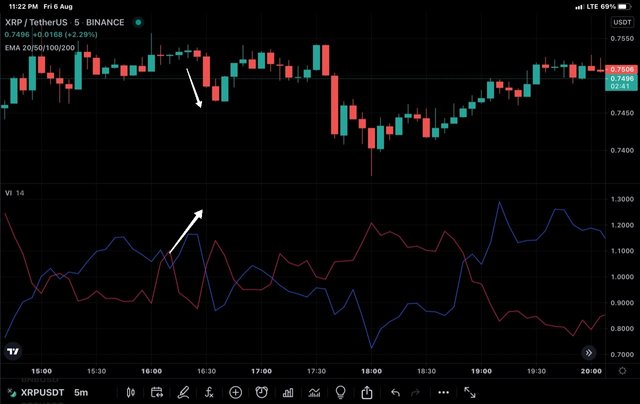
In the above chart of XRP/USDT, we can see for that marked section of chart, two bearish candles but when we look at subsequent VI+ , that is bullish for that section, therefore it is bullish divergence.
- Bearish divergence : When price of an asset is bullish but vortex indicator downtrend line shows bearish trend. Such a phenomenon is known as bearish divergence.
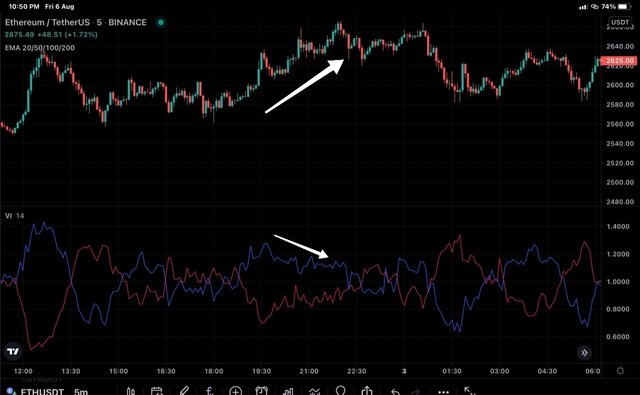
In the ETH/USDT chart above, we can see that the price of an asset is going up while as VI+ is showing downward movement and is therefore known as bearish divergence.
Use the signals of VI to buy and sell any two cryptocurrencies. (Screenshot required)
For this task , I'll be using tradingview to spot signals but I'll be placing trade from my wazirx account. So let me begin.
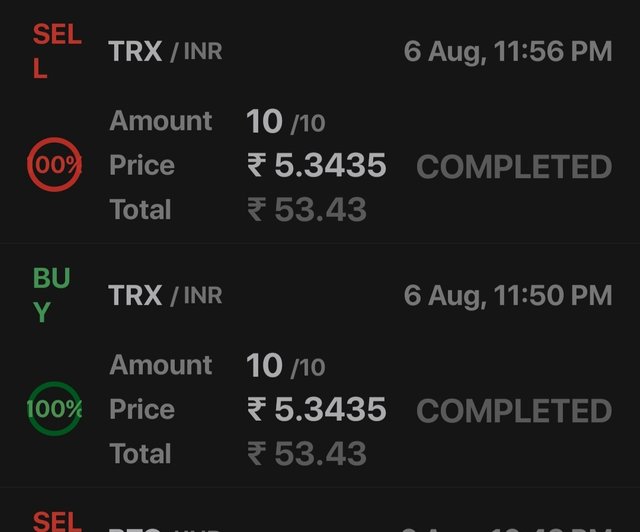
Trade 1 : TRX/INR
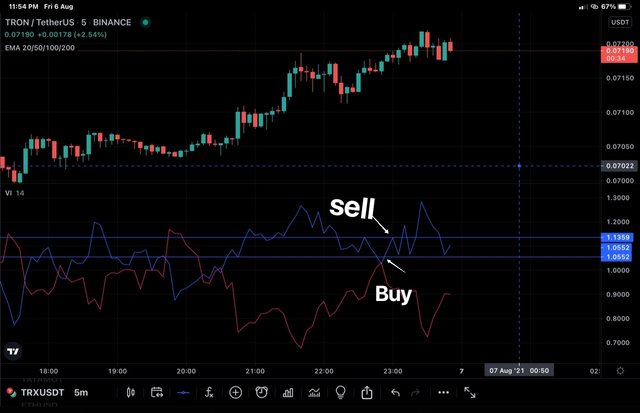
In the chart above, VI + has taken pull back after coming in contact with VI-, it is equivalent to crossover and so i placed trade and later sold the same within 10 mins for the sake of completing this task, although i could have wait and booked more profit. Although there was some price movement up but it was negligibly small, so was not reflected in actual , while selling.
Trade 2 : BNB/INR.
Although analysis and signals are spot on trading view using BNB/USDT pair, but trade is placed from wazirx account using BNB/INR pair.
 .
.
From the chart above, i have marked the level where i placed trade on 06/07/2021 . I bought BNB Worth 997 INR (15$) . Later i got busy and today on 07/08 , i sold it at marked point and got profit of 17INR.
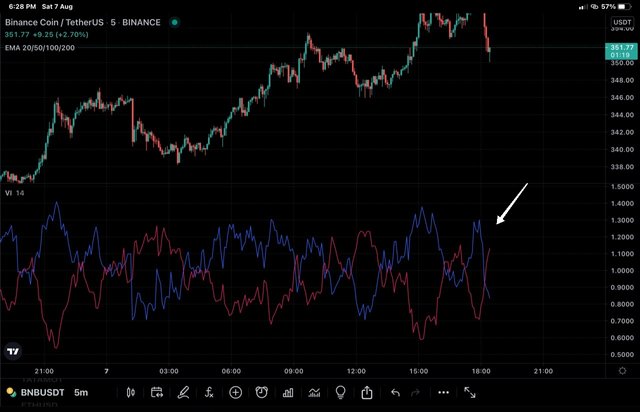
Sold BNB - marked point.
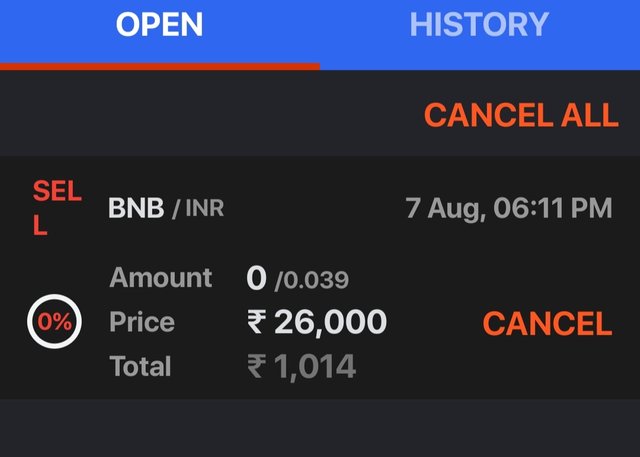
Order placed, awaiting execution.
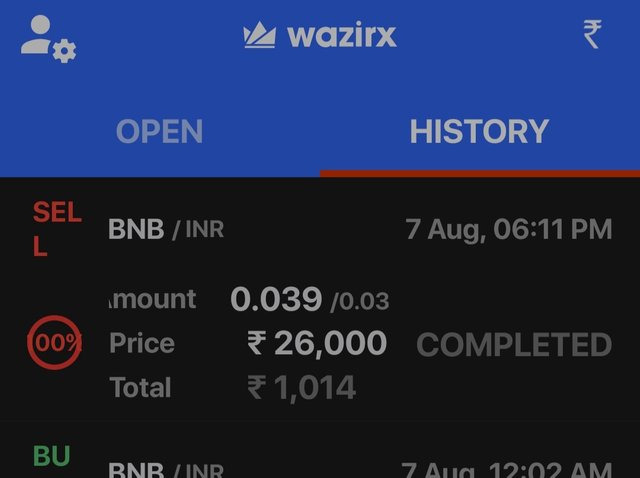
Order executed
Conclusion
Vortex indicator is a trend following indicator, simple and reliable to use. Like all other indictors, it has short comings too. So it is better to use it with other indicators like MACD etc for acquiring better results.
Superb performance @drqamu!
Thanks for performing the above task in the sixth week of Steemit Crypto Academy Season 3. The time and effort put into this work is appreciated. Hence, you have scored 8 out of 10. Here are the details:
Remarks
You displayed a good understanding of the topic.