Crypto Academy Season 03 - Week 08 | Homework post for [ @cryptokraze| |Advanced Course - Trading Sharkfin Pattern.
What is your understanding of Sharkfin Patterns. Give Examples (Clear Charts Needed)
We know that markets don't move linearly in either direction, instead they make certain patterns like double top pattern, double bottom pattern, Head and Shoulder pattern, falling wedge pattern etc. One similar pattern that we are going to learn today is known as "Sharkfin" pattern.
Sharkfin pattern can be seen in an uptrending as well as downtrending market . In sharkfin pattern , there is rapid movement in the price of an asset followed by an eqully rapid move in opposite direction. In an uptrending market, it can be seen as rapid movement of the price up followed by by an equally rapid reverse move, resulting in formation of a "inverted V pattern" or "Sharkfin pattern". Similarly in case of a downtrending market, it is represented by a rapidly declining price move that is followed by an equally Rapid correction in opposite direction resulting in formation of a pattern resembling alphabet V. This V pattern represent the sharpfin pattern in a downtrending market.
Example of sharkfin patrern.
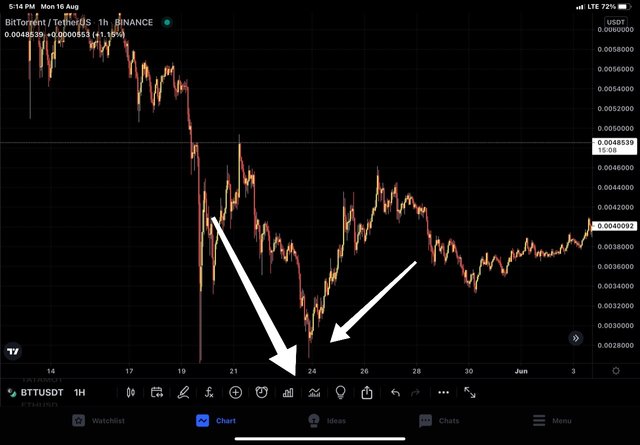
In the BTT/USDT chart above on 1h time frame, we can see price of BTT showing a steep decline which is followed by an equally rapid correction resulting in formation of a V patteen or sharkfin patrern.
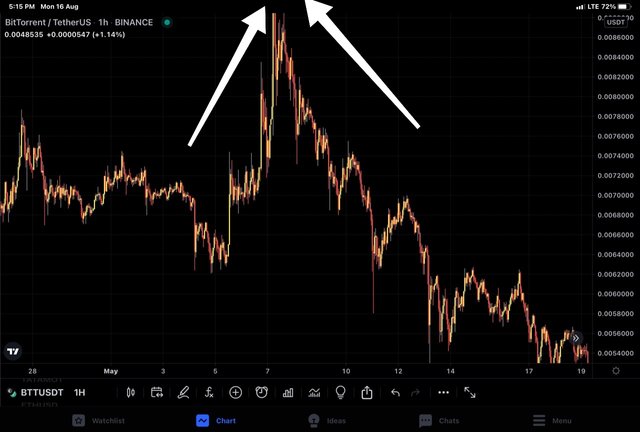
In the chart above, BTT/USDT on 1h time frame, we can see that the price of BTT moving up rapidly which is followed by an equally rapid correction in reverse direction resulting in formation of an inverted V pattern or sharkfin pattern.
The purpose of highlighting this pattern is to avoid falling in trap . One may be misled by initial phase of V or inverted V and may emter into trade and suffer loss due to imminent price reversal. So it is prudent to spot these patterns by whatsoever means and avoid being caught.
Implement RSI indicator to spot sharkfin patterns. (Clear Charts Needed)
Indicators are used to support traders in spotting signals. Of the various trading indicators, we will be using "Relative strength imdex" to spot sharkfin pattern. We will keep configuration of RSI default at 14 periods. And the RSI values that we will be looking for are 30 and 70. We know RSI value of greater than 70 indicates overbought asset and forthcoming fall in price and RSI value less than 30 indicates oversold asset and forthcoming rise in price. We are extrapolating same concept here.
Downtrend.
In a downtrending market, sharkfin pattern on a price chart looks like V and when we add RSI, it will also form V patrern but we will also have to consider the RSI value. For the
initial phase or limb of sharfin (V) , RSI must be below 30 and for the corrective phase of sharkfin, RSI must go above 30 towards the end of phase.
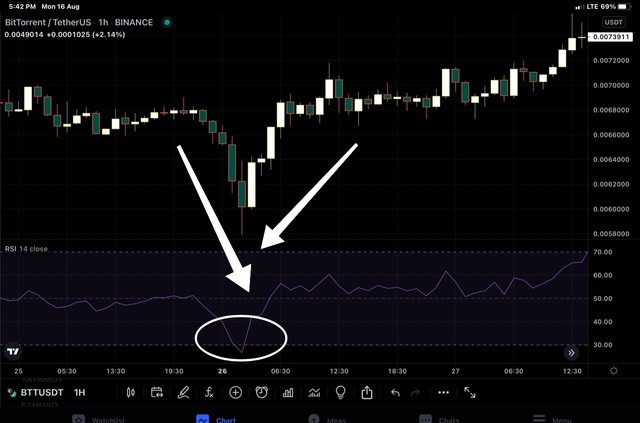
In the BTT/USDT chart on 1h timeframe, we can see that RSI value dips down below 30 for the first phase (limb moving down) and than makes a sharp pull back above 30 ( for upgoing limb) . So RSI confirmation is valid.
Uptrend
In an uptrending market, sharkfin pattern on a price chart looks like inverted V and when we add RSI, it will also form inverted V patrern but we will also have to consider the RSI value. For the
initiatial phase or limb of sharkfin (V) , RSI must be above 70 and for the corrective phase of sharkfin, RSI must go below 70.
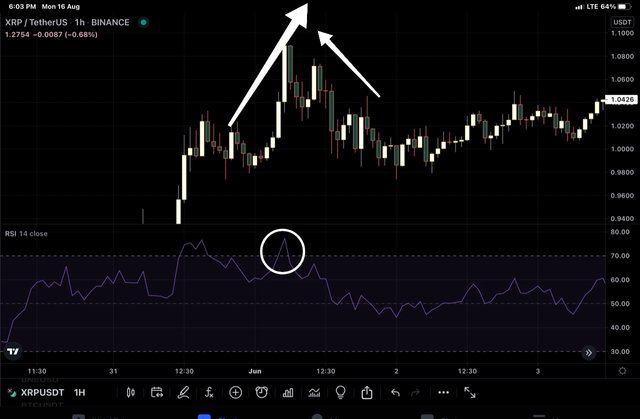
In the XRP/USDT chart on 1h timeframe, we can see that RSI value is above 70 for the first phase (limb moving up) and than makes a sharp pull back below 70 ( for down projecting limb) . So RSI confirmation is valid.
Write the trade entry and exit criteria to trade sharkfin pattern (Clear Charts Needed)
Entry Criteria for Buy Position
Look for a chart on appropriate time frame for emtry. We know that, smaller time frames are required to enter into the market.
Add RSI indicator with default settings to the chart of target trading pair.
in a downtrendig market, look for the price to make a clear downward projecting move and then an equally quick corrective move in upward direction forming a V pattern.
Look for RSI value. For valid confirmation, RSI value must be below 30 and then reverse back to value more than 30 quickly making a V shaped pattern on RSI line too.
Place Buy order when RSI is back to above 30 zone to avoid falling in down projecting trap.
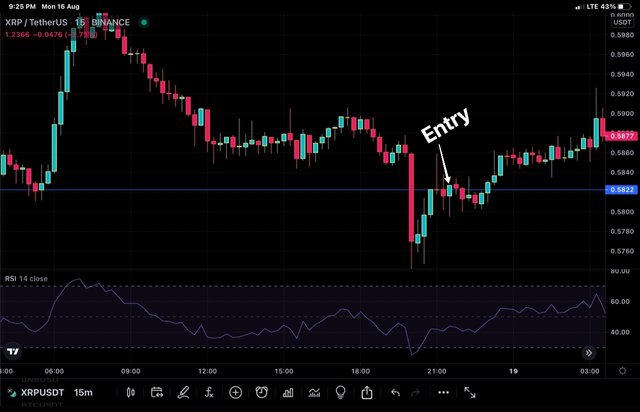
XRP/USDT on 15 min timeframe showing entry for buy position
Entry Criteria for Sell Position
Look for a chart on appropriate time frame for sell emtry. We know that, smaller time frames are required to enter into the market.
Add RSI indicator with default settings to the chart of target trading pair.
in an uptrendig market, look for the price to make a clear upward projecting move and then an equally quick corrective move in downward direction forming inverted V pattern.
Look for RSI value. For valid confirmation, RSI value must be be above 70 and then reverse back to value less than 70 quickly making an inverted V shaped pattern on RSI line too.
Place sell order when RSI is back to below 70 zone to avoid falling in upward projecting trap.
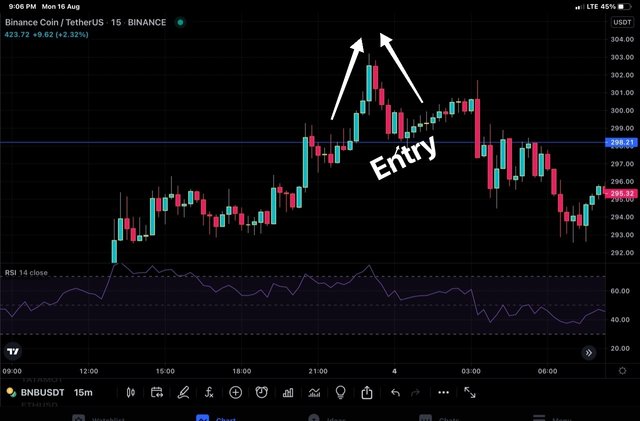
BNB/USDT on 15 min timeframe showing entry for sell position.
Trade Exit Criteria
Exit Criteria for Buy Position
As part of risk management strategy to avoid heavy loss in case of trade movement in opposite direction, setting stoploss is a good tool to follow.
Set Stop Loss below the swing low point of the sharkfin pattern.
In case trade goes in opposite direction to that of anticipated before entering, our stoploss will be hit and we will exit by default at expected loss.
in case trade goes as anticipated, we should Set Take Profit level to book the profit because no trend continues forever in one directon.
Take profit level would depend upon your risk aversion strategy. To begin with risk : reward ratio of 1:1 would suffice. However, it isn't any mandatory rule.
in case of trade going in favourable direction, take profit level will be hit and we will exit with profit.
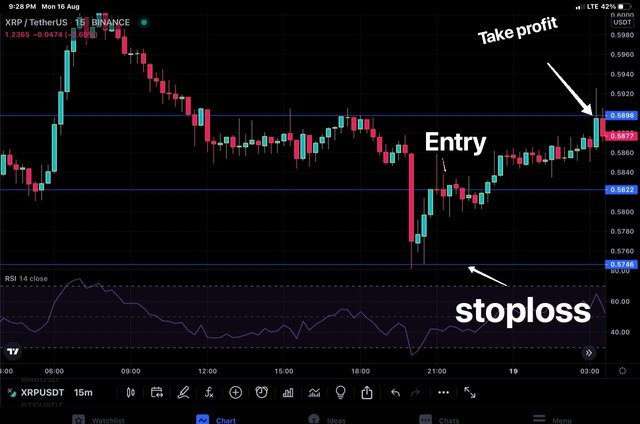
XRP/USDT ON 15 MIN TIME FRAME.
ENTRY at 0.5822USDT
Stoploss 0. 5746 USDT
Take profit at 0.5898 USDT
Risk = 0.5822 - 0. 5745 = 0. 0077
Reward = 0. 5898 - 0. 5746 = 0.0152
Risk/Reward = 1/2
Exit Criteria for Sell Position
As part of risk management strategy to avoid heavy loss in case of trade movement in opposite direction, setting stoploss is a good tool to follow.
Set Stop Loss above the swing high point of the sharkfin pattern.
In case trade goes in opposite direction to that of anticipated before entering, our stoploss will be hit and we will exit by default at expected loss.
In case trade goes as anticipated, we should Set Take Profit level to book the profit because no trend continues forever in one directon.
Take profit level would depend upon your risk aversion strategy. To begin with risk : reward ratio of 1:1 would suffice. However, it isn't any mandatory rule.
In case of trade going in favourable direction, take profit level will be hit and we will exit with profit.
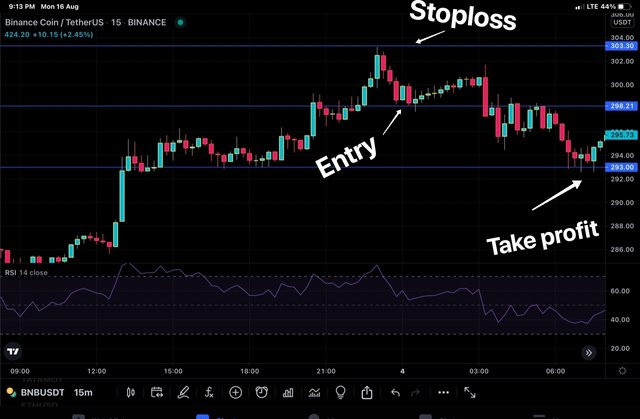
XRP/USDT on 15 min timeframe showing exit for sell position.
Entry = 298
Stop loss = 303
Take profit = 293
Risk = 5
Reward= 5
Risk/Reward = 1/1
Place at least 2 trades based on sharkfin pattern strategy (Need to actually place trades along with Clear Charts)
Trade 1 = IOTX/USDT
Analysis will be done on trading view and real trade will be placed on WasirX.
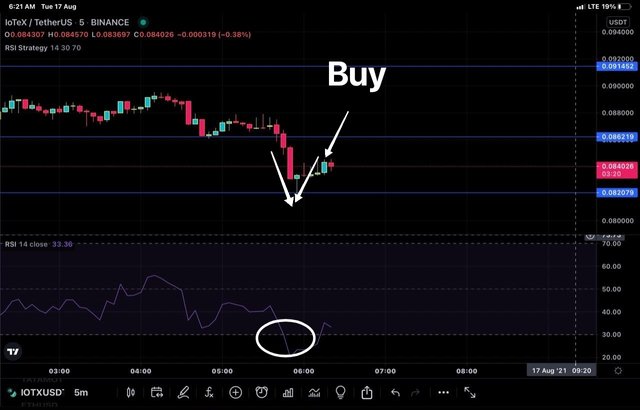
In the IOTX/USDT chart above, sharkfin pattern is formed and i placed trade as shown above at IOTX/USDT price of 0.082 USDT. Actually i placed three trades in the same range. For all three RSI was above 30 . I bought 5k +1k+1k coins as shown below.
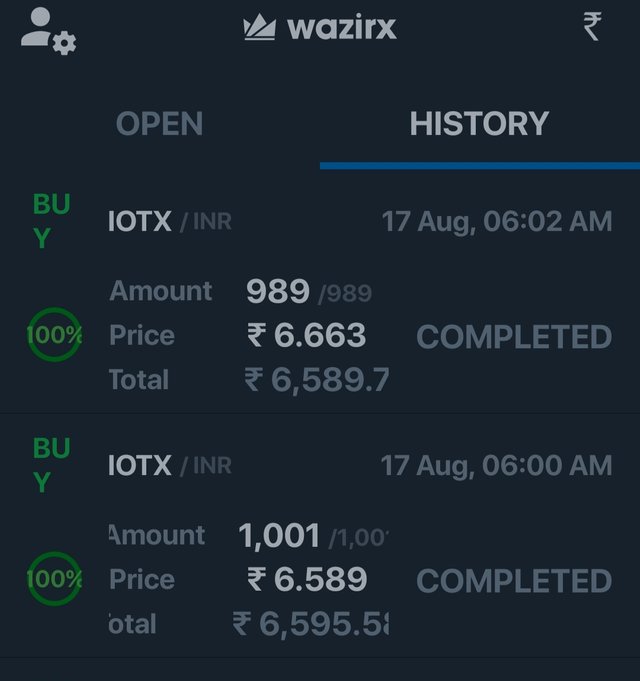
I sold all 7000 coins at 0.086 USDT. Stop loss was set at 0.082. So risk here was 0.002 and profit also is 0.002 making it a risk ratio of 1:1.
Trade 2 : DATA/USDT
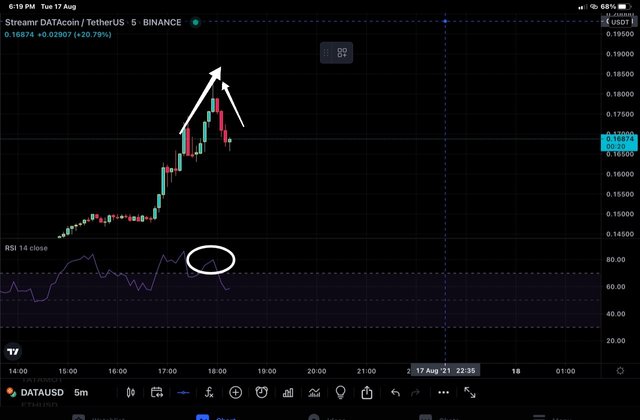
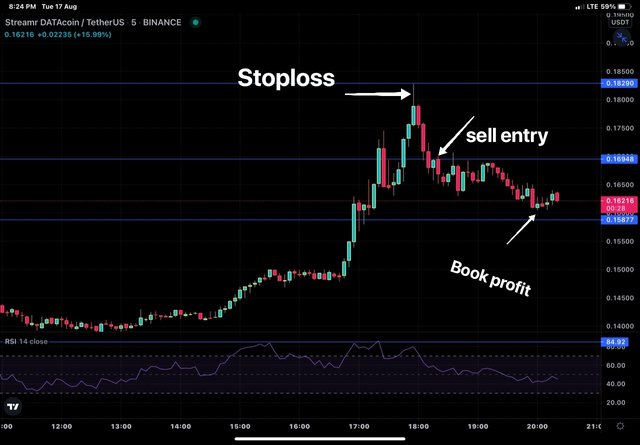
In the DATA/USDT chart above, sharkfin pattern is formed and i placed trade as shown above at DATA/USDT price of 0.169 USDT. To begin RSI value was above 70 and than it went back to below 70 zone.
Entry at 0.169 USDT.
Book profit at 0.158 UsDT and stoploss at 0.182 USDT. Here Risk : Reward = 1:1.
Conclusion
Price action patterns have been througly studied by analysts and have come up with strategies to avoid loss and maximise profit. One such pattern is sharkfim pattern of trading reversal. If property followed , it would not only prevent falling in trap but would also help in gaining profit from market.