Crypto Academy Season 03 - Week 06 | Homework post for professor [ @cryptokraze] - Trading Liquidity Levels The Right Way
What is your understanding of the Liquidity Level. Give Examples (Clear Charts Needed)
As we are supposed to talk about liquidity levels, we should understand meaning of liquidity first . Liquidity of a market refers to ease with which you can comvert an asset that you possess into cash without affecting price of your asset. Suppose In tradional markets, if you want to sell an asset that you have and in market you do not easily get a buyer for your asset. You can adopt one tactic, that is to lower the price of asset then its worth. You will find that scores of buyers would be ready to buy but that doesn't mean the market has a good liquidity, because you had to sell your asset at a lower price than its worth. On the contrary, had you been able to sell your asset at its set price then we could have called that the market has good liquidity.
Applying the same concept to the cryptocurrency market, liquidity would mean that how quickly you are able to make transaction between cryptocurrencies without affecting the price of either asset in a pair. More the trading volume of a crypto token, more is the liquidity
Liquidity levels refer to the price levels where maximum exchange of hands ( trade) takes place between buyers and sellers. Applying our basic trading knowledge, we know that most of the traders who enter into the market have at least basic understanding of market movememt and therefore they set stoploss and take profit points at different levels as per their risk reward strategies and based on previous market behavior . As market behaves same for all , therefore certain levels are formed within the market where maximum exchange of hands take place , these levels are formed on both upper and lower side and interesting finding is that price action is seen respecting these levels unless any major interference by financial institutions take place that turn the table and disrupt these levels. Let me show these levels on crypto charts.
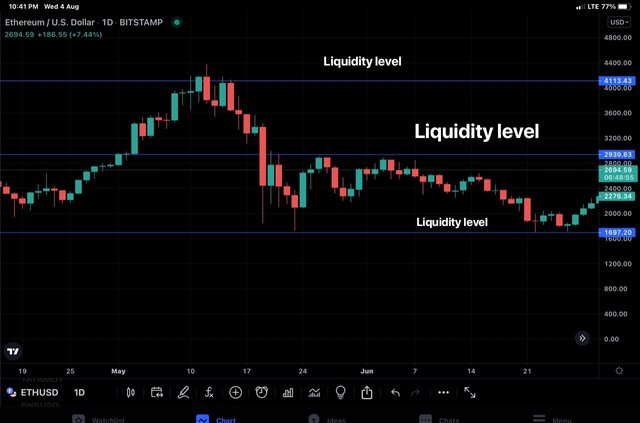
Liquidity levels labelled as horizontal lines on ETH/USDT chart.
Explain the reasons why traders got trapped in Fakeouts. Provide at least 2 charts showing clear fakeout.
Price action is seen to respect the liquidity levels , be they in the form of support or resistance. The breakout is said to have occurred, when the price of an asset moves across the established liquidity level and continues in that direction. In case of an uptrending market, breakouts tend to move across the established resistance level and in case of a downtrending market the breakout tend to move the price below the established support level . Sometimes price of an asset moves above the established liquidity level for a short period but fails to continue in the direction of trend and reverts back and these breakouts are known as fake breakout or failed breakouts or fakeouts.
Some traders on spotting these fakeouts start trading them and when the price reverts back, they get trapped and end up in loss. Reasons for getting trapped are , due to improper analysis of market by retail traders and greed of making more money. As true breakouts usually give good profit to the breakout traders, so greed of making more makes some traders enter into fakeouts and land in loss once price takes pullback.
Examples from crypto charts
BTC/USDT
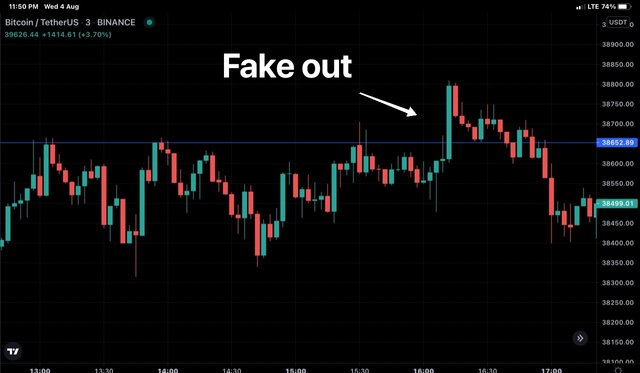
In the chart above, i have marked an important liquidity level at BTC price of 38652.89 USDT and we can see at around this price level BTC has met resistance several times. And than a fakeout marked by arrow pointing to a long billish candle. Soon the price retracted its way back and than reversed. Those traders who entered at fakeout are caught.
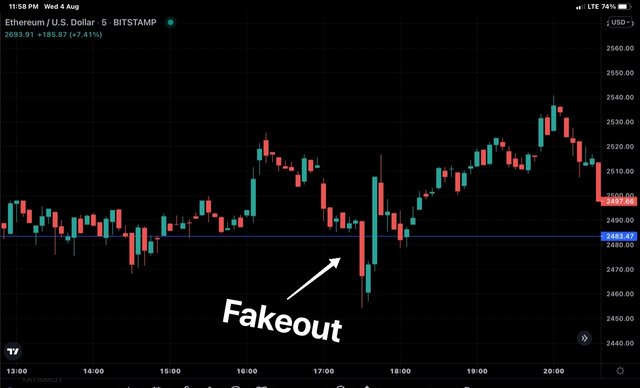
In the chart above, i have marked an important liquidity level at ETH price of 2483.47 USDT and we can see at around this price level ETH has met support several times. And than a fakeout marked by arrow pointing to a long bearish candle. Soon the price retracted its way back and than reversed. Those traders who entered at fakeout are caught.
How you can trade the Liquidity Levels the right way? Write the trade criteria for Liquidity Levels Trading (Clear Charts Needed)
We have already been provided two classic trading strategies which we could make use of this time for trading liquidity level and two stratgies are market structure break (MSB) and break retest break (BRB). Depending upon the situation created at a particular liquidity level, we had to choose a strategy. If a market follows trend continuation , then we have to use break retest break strategy to trade , on the other hand if the market price action reverses from the liquidity level then we will have to follow market structure break strategy . Let's try to understand the concept with the help of Crypto charts.
Trading liquidity levels by following BRB strategy for buy position.
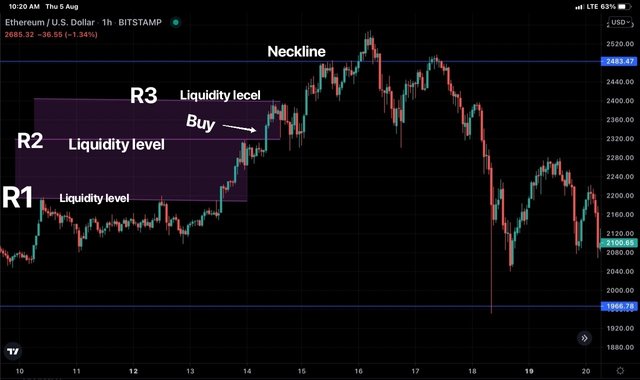
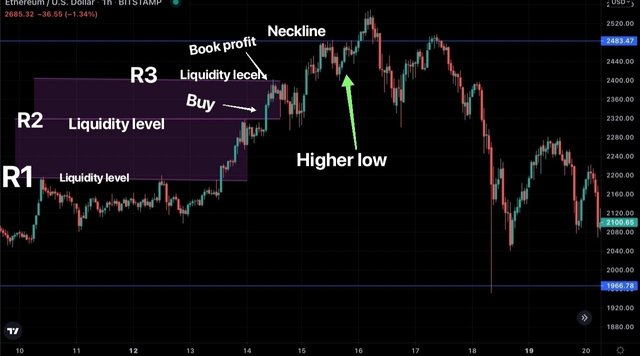
In the above chart, we are in uptrend in market and the price action of ETH goes on breaking resistance levels and follows the continuation pattern, so we know the strategy that we have to follow is Break Resistance Break to enter into buy position. I have marked different liquidity levels that correlate with resistance levels in this case . So trading strategy includes:
First we need to mark a liquidity level which is resistance (R1) level in this case and than wait for price to break that liquidity level.
Than we will wait for price to reach a new liquidity or resistance level ( R2) and than retest towards R1.
Wait for price to break above R2 just to validate the breakout and avoid falling in fakeouts .
We will than place buy order just above second liquidity level (R2) .
Since we have entered, we should have exit plan in mind too because no trend continues forever. So we will set stoploss below the R1 and take profit as per our risk reward strategy. Let's say 1:2 . It means that, take profit level has to be twice that of stoploss. Some traders may use liquidity level 3 as take profit but it is not any hard and fast rule. We can exit as per our risk reward strategy.
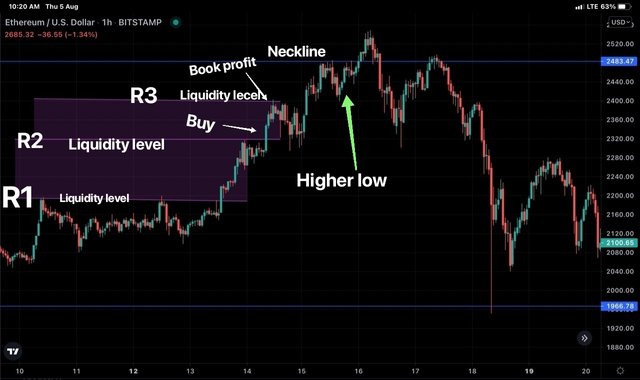
Here we have taken R3 as book profit level. However we can make use of trailing stoploss and wait for higher low formation above neckline and than exit our position.
Trading liquidity levels by following BRB strategy for sell position.
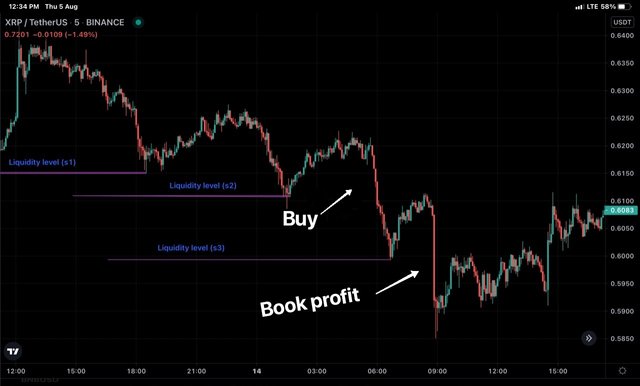
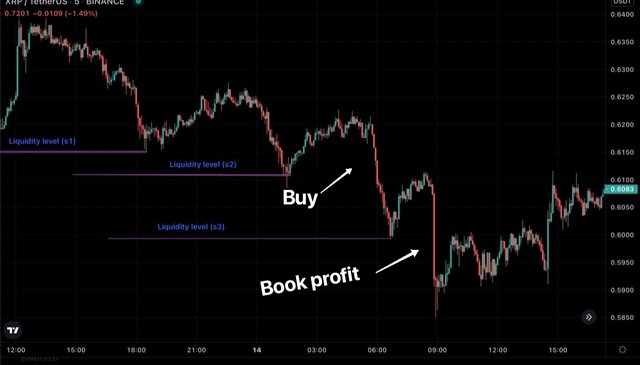
In the above chart, we are in downtrend market and the price action of XRP goes on breaking support levels and follows the continuation pattern, so we know the strategy that we have to follow is Break Resistance Break to enter into sell position. I have marked different liquidity levels that correlate with support levels in this case . Let's spot entry and exit points :
First we need to mark a liquidity level which is support (S1) level in this case and than wait for price to break that liquidity level.
Than we will wait for price to reach a new liquidity or support level ( S2) and than retest towards S1.
Wait for price to break below S2 just to validate the breakout and avoid falling in fakeouts .
We will than place sell order just below second liquidity level (S2) .
Since we have entered, we should have exit plan in mind too because no trend continues forever. So we will set stoploss above the S2 and take profit as per our risk reward strategy. Let's say 1:2 . It means that, take profit level has to be twice that of stoploss. Some traders may use liquidity level 3 as take profit but it is not any hard and fast rule. We can exit as per our risk reward strategy. In the above chart, we have taken S3 as book profit level.
Trading liquidity levels by following MSB strategy for Buy position.
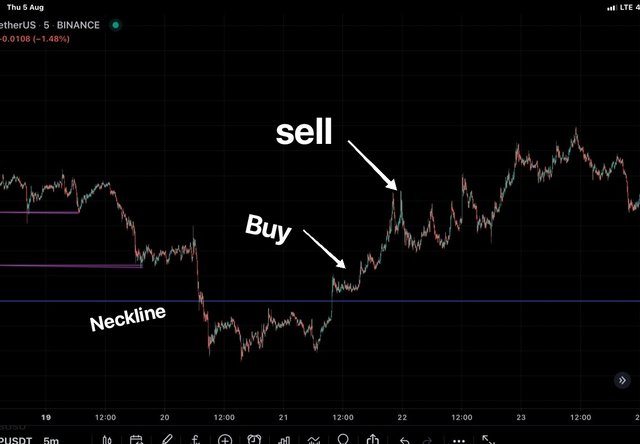
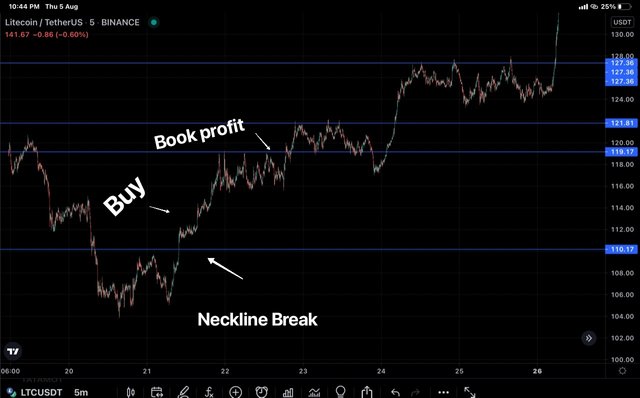
In the above chart, we can see series of price rallys down forming multiple lower lows. To enter into the market we will have to draw a neckline at the bottom of downtrend as shown above.
Wait for break of neckline . Break of neckline would be clear by formation of bearish candle closing above neckline.
Now wait for formation of bullish candle which breaks neckline and enter.
Place stoploss below the neckline and take profit as first resistance level or as per your risk reward strategy.
MSB for sell entry and exit.
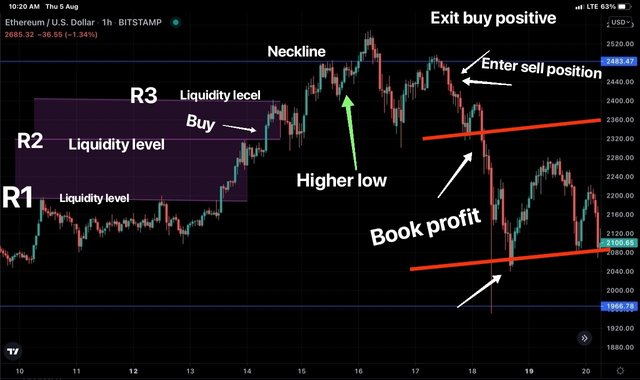
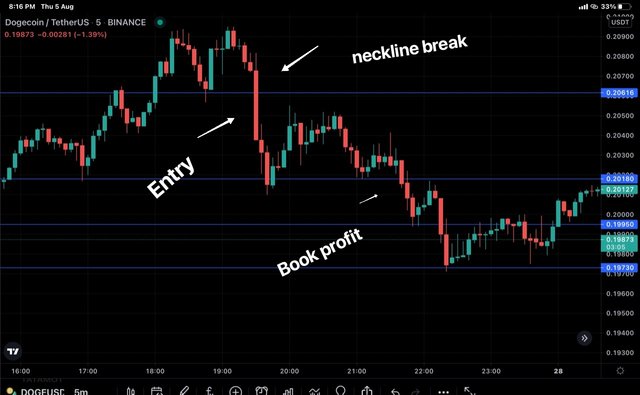
In the above chart, we can see series of price rallys moving up forming multiple higher highs. To enter into the market we will have to draw a neckline at the top of uptrend as shown above.
Wait for break of neckline . Break of neckline would be clear by formation of lower high above the neckline.
Now wait for formation of bearish candle which breaks neckline towards downside and enter.
Place stoploss above the neckline and take profit at first support level or as per your risk reward strategy.
Draw Liquidity levels trade setups on 4 Crypto Assets (Clear Charts Needed)
For this part of task, I'll be showing trade set up on four crypto assets, two of the set ups will be as per BRB and two as per MSB.
ETH/USDT - as per BRB
XRP/USDT - as per BRB
LtC/USDT- as per MSB
Dogecoin/Tether - as per MsB
You have been upvoted by @sapwood, a Country Representative from INDIA. We are voting with the Steemit Community Curator @steemcurator07 account to support the newcomers coming into Steemit.
Engagement is essential to foster a sense of community. Therefore we would request our members to visit each other's post and make insightful comments.
Thank you