Crypto Academy Season 03 - Week 04 | Advanced Course | Homework task for [@cryptokraze] - Trading The Dynamic Support & Resistance
What do you understand about the Concept of Dynamic Support and Resistance? Give Chart Examples from Crypto Assets. (Clear Charts Needed)
From the basic knowledge of support and resistance, we know that support and resistance are important levels in trading because they give us some definite information about the anticipated price action. The support represents a horizontal price level from where price of an asset is expected to rise and can be correlated to a buy signal. Resistance represent a price level from where price of an asset is expected to come down. We know that these levels are static at particular price level and price action of asset does obey these levels. But sometimes we see price level moving up continuously without even touching the static support level and at times we see market moving down continuously without even touching static resistance level. That is where concept of dynamic support and resistance comes into play.
Dynamic support and resistance levels are flexible moving lines ( not necessarily horizontal) that follow the price action of an asset and represent support and resistance at different levels. In technical analysts, special indicators have been designed to represent these levels and they are called exponential moving averages (EMAs) . Let's look at crypto charts and analyse this concept.
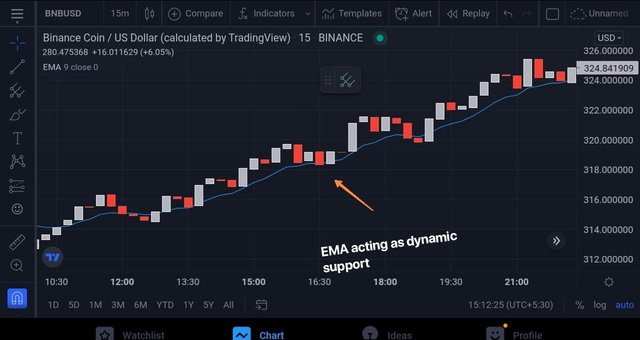 BNB/USD dynamic support
In BNB /USD chart above, arrow shows where BNB/USD has dynamic support on 15 min time frame.
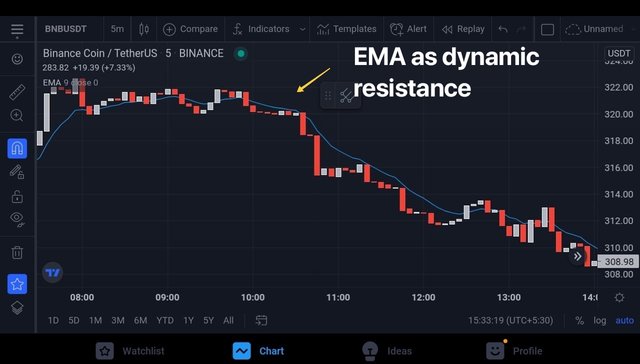
BNB/USDT dynamic resistance chart
In BNB/USDT chart , arrow shows where is dynamic resistance on 5 minutes chart as per EMA and we saw price line respected the level.
Make a combination of Two different EMAs other than 50 and 100 and show them on Crypto charts as Support and Resistance. (Clear Charts Needed)
For this section of task, let me use 20 and 50 period EMA and plot them on crypro chart to see how they behave in correlation to price action.
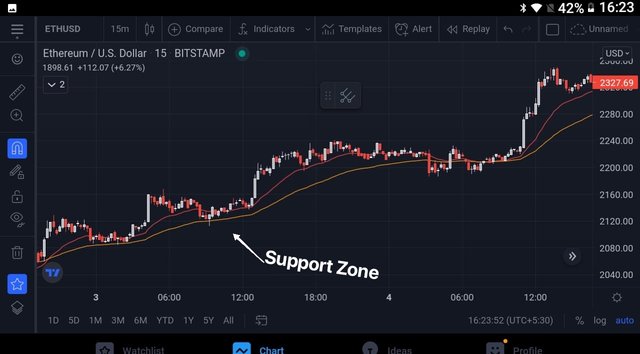
ETH/ USD 15 min chart
Look at the ETH/USDT 15 min chart, i have marked dynamic support zone with arrow. We can see that price level pierced EMA 20 but not EMA 50. So these two EMAs combined together form a support zone. At a valid support level , price line cannot cross the support zone. So we can say combination of 2 EMAs acts as a strong support level than either of them used individually.
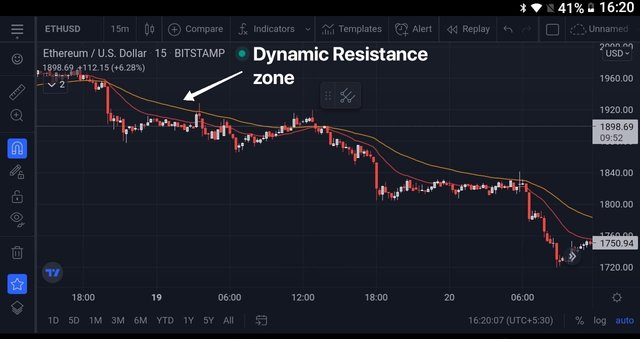
ETH/USDT dynamic resistance on 15 min chart.
Look at the ETH/USDT 15 min chart above, i have marked dynamic resistance zone with arrow. We can see that price level pierced EMA 20 but not EMA 50. So these two EMAs combined together form a resistance zone. At a valid resistance level , price line cannot cross the resistance zone, even if it does, it returns immediately back to the zone. . So we can say combination of 2 EMAs acts as a strong resistance level than either of them used individually.
Explain Trade Entry and Exit Criteria for both Buy and Sell Positions using dynamic support and resistance on any Crypto Asset using any time frame of your choice (Clear Charts Needed)
For this task I'll continue with 50 and 100 EMAs to spot buy and sell criteria for entry and exit points
Entry Criteria for Buy Position.
Firstly market should be in uptrend to place any buy order and where to place buy order, let's spot that.
After spotting trend, we need to apply two EMAs (50 amd 100 period) .
As we are spotting entry criteria for buy position, price must be above both EMAs ( 50 amd 100) for valid buy position.
Find point where price level touches 50 EMA but that doesn't suffice. As 50 EMAs is towards support, price may break the EMAs and continue going down to make new support level/zone. So pullback away from 50 EMAs is mandatory to validate the entty.
As price correction away from EMAs begin, buy order can be placed.
it is matter of common understanding, the earlier we are able to spot the trend and longer the trend goes, more will be profit.
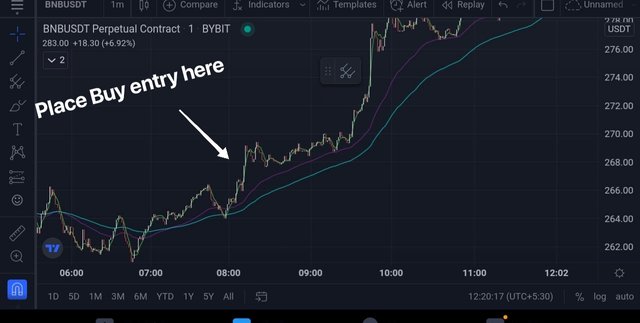
BNB/USDT buy entry point on 1 minute time frame
In the above example, i have taken BNB/USDT chart on 1 min time frame and we can see clear buy entry point amd than bull run that followed would have been very profitable.
Entry Criteria for Sell Position.
Firstly market should be in downtrend to place any sell order and where to place sell order, let's spot that.
After spotting downtrend, we need to apply two EMAs ( example, 50 amd 100 period ) .
As we are spotting entry criteria for sell position, price must be below both EMAs ( 50 amd 100) for valid sell position.
Find point where price level touches 50 EMA but that doesn't suffice. As 50 EMAs is towards resistance , price may break the EMAs and continue going up to make new lower high. So pullback away from 50 EMAs is mandatory to validate the entty.
As price correction away from EMAs begin, sell order can be placed.
it is a matter of common understanding, the earlier we are able to spot the trend and longer the trend goes, more will be profit.
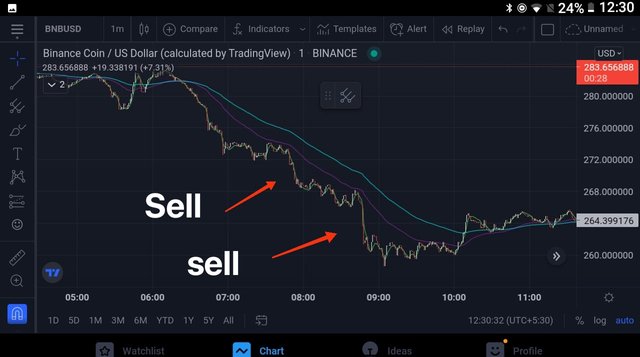
BNB/USDT sell entry point on 1 minute time frame
In the above example, i have taken BNB/USDT chart on 1 min time frame and we can see two clear entry points and it is more profitable to emter at first to ride the trend amd than bear run that followed would have been very profitable.
Exit Criteria for Buy Position
The basic necessity of every intraday trader is to set stoploss at the time of entry into the trade. In case the trade doesn't go the way we anticipated, stoploss may be hit and we may exit by default with minimum anticipatd loss.
As we are making use of EMAs, so here we need to set Stoploss just below the 100 Exponential Moving Average (EMA).
Another important parameter along with satoploss is "Take profit level". To begin with, general strategy for "Take profit level" should be 1:1 RR (Risk:Reward) . However, with experiance these parameters become flexible for you.
Purpose of setting "take profit level" Is to book the profit at that level and exit from trade.
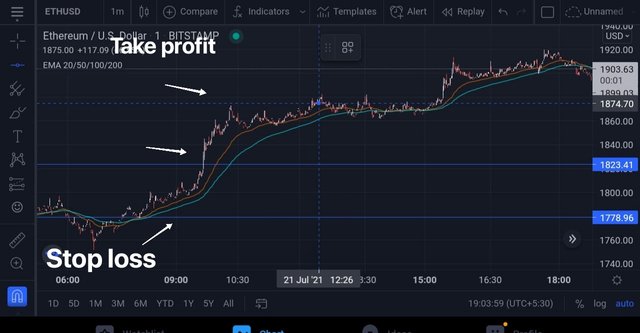
ETH/USD on 1 min time frame
The above chart shows exit criteria for buy position on 1 min time frame of ETH/USD. Take profit amd stop loss are set keeping Risk:Reward ratio of 1:1 under consideration.
Exit Criteria for Sell Position
The basic necessity of every intraday trader is to set stoploss at the time of entry into the trade. In case the trade doesn't go the way we anticipated, stoploss may be hit and we may exit by default with minimum anticipatd loss.
As we are making use of EMAs, so here we need to set Stoploss just below the 100 Exponential Moving Average (EMA).
Another important parameter along with stoploss is "Take profit level". To begin with, general strategy for "Take profit level" should be 1:1 RR (Risk:Reward) . However, with experiance these parameters become flexible for you.
Purpose of setting "take profit level" Is to book the profit at that level and exit from trade.
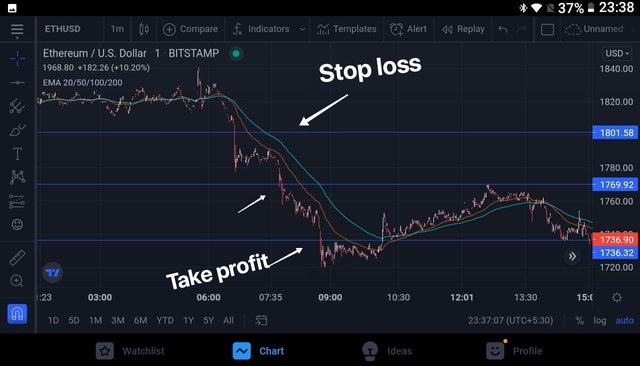
ETH/USD on 1 min time frame
The above chart shows exit criteria for sell position on 1 min time frame of ETH/USD. Take profit amd stop loss are set, keeping Risk:Reward ratio of 1:1 under consideration.
Place 2 demo trades on crypto assets using Dynamic Support and Resistance strategy. You can use lower timeframe for these demo trades (Clear Charts and Actual Trades Needed)
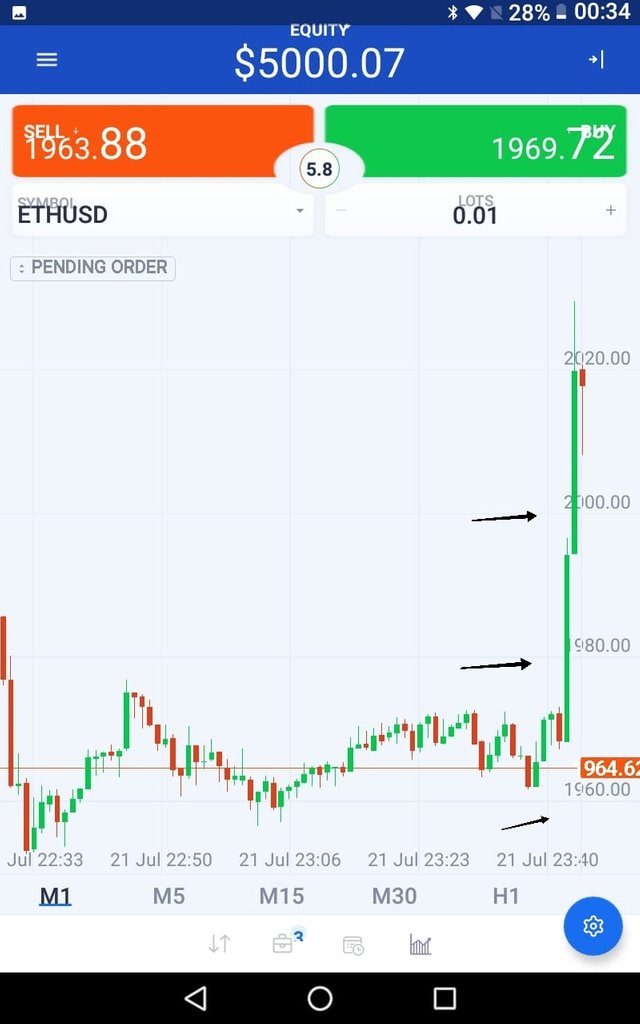
Trade 1 : ETH/USD
To spot the entry exit points analysis will be done on trading view but the demo trade will be placed on my OctaFx account, although differences in prices does exost between two platforms.
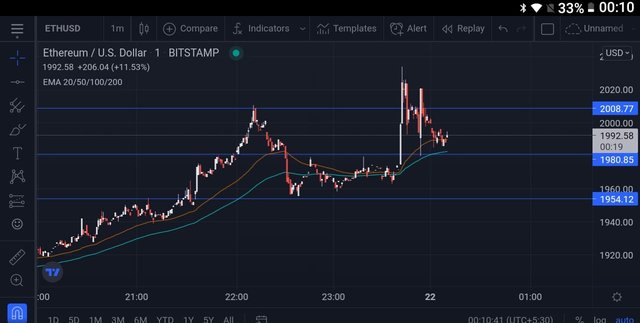 EETH/USD strategy to enter, take profit and exit .
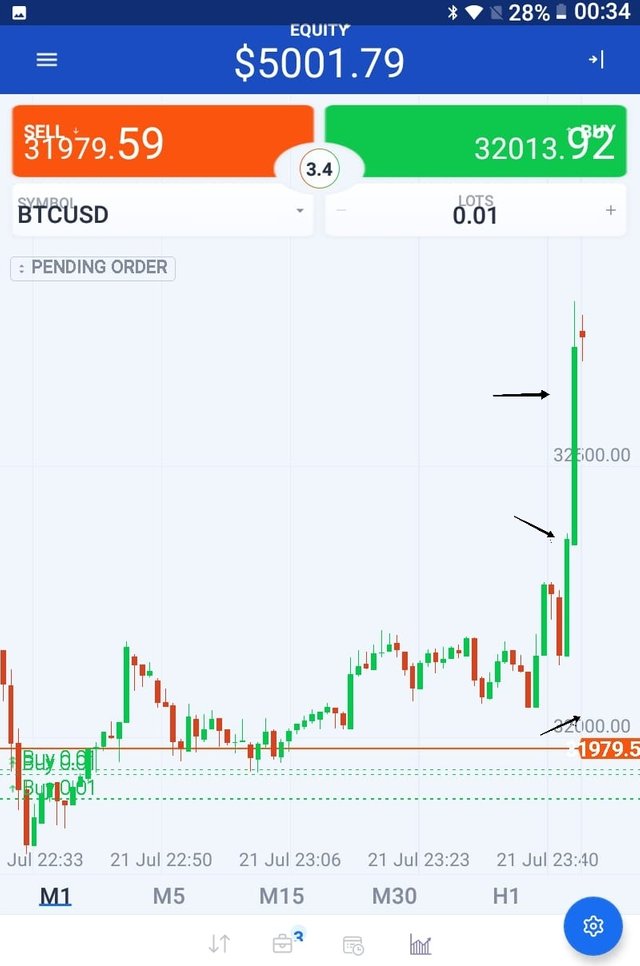
Trade 2 : BTC/USDT
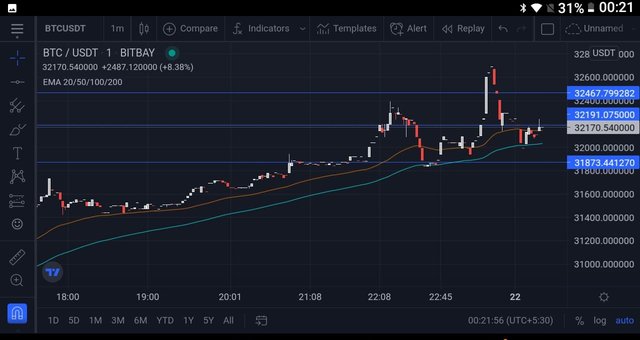
Entry point, take profit and stop loss level are shown above on trading view and demo order will be placed on OctaFx as shown below. Due to differences in price, values are different.
Seem worked hard on this task, All the best to score high
Dear @drqamu
Thank you for participating in Steemit Crypto Academy Season 03 and making efforts to complete the homework task. You got 8.5/10 Grade Points according to the following Scale;
Key Notes:
We appreciate your efforts in Crypto academy and look forward for your next homework tasks.
Regards
@cryptokraze
You have been upvoted by @sapwood, a Country Representative from INDIA. We are voting with the Steemit Community Curator @steemcurator07 account to support the newcomers coming into Steemit.
Engagement is essential to foster a sense of community. Therefore we would request our members to visit each other's post and make insightful comments.
Thank you