[Average True Range (ATR) Indicator]- Crypto Academy /S5W1-Homework Post for kouba01
Hope you are all doing well. We are in season 5 of cryptoacademy and learning process is anticipated to continue harmoniously like other seasons. Today i am writing homework task for @kouba01 which is about ATR indicator.

Discuss your
understanding of the ATR indicator and how it is calculated? Give a clear example of calculation
ATR is a technical analysis tool that was developed by J. Welles Wilder Jr to measure volatility of an asset under consideration over a specified period of time and therby aid traders in making decisions . To begin from commodity market, versatility of the indicator influencesd traders of stock market, Forex and Crypto markets too and traders are taking advantage from this indicator in all these markets. The indicator measures how much price moves on an average during a particular time period and therefore helps to determine volatility. ATR doesn't indicate forthcoming trend but help traders to determine some important parameters like stop loss and take profit levels.
We say markets are volatile, when price makes rapid up and down movements over short period of time. On the chart below, we can see that ATR shows significant movement with the movement of price.
ATR stands for average true range. So we can say that, it is average of True Range. Therefore, to calculate the ATR, we will first have to calculate the true range and then take the average of the true range values over a specified period of time and that will give ATR for that period. True Range : For TR , we have to do some calculations and of those calculations, the one that is higher is the actual value of TR. The calculations are : Current high minus current low From the above calculations, we would get different values and whichever value of theae three is higher, that will be the TR. Suppose the period of observation is 14 days, we need to calculate TR for each period as per above formulae, than take average of those values and that would be ATR for that period. Once the above calculation is made, further calculations are simplified by using following formula. Current ATR = ((Prior ATR x 13) + Current TR) / 141 In the BNB/USDT chart, set over 1D time frame and ATR of 14 periods is used. Let's calculate ATR for the day highlighted with arrow. Prior ATR = 32. 3 Current TR = ( 32.3 x 13) + 89.7 / 14 = 419.9 + 89.7/14 = 509.7/ 14 = 36.4 That is exactly there on ATR indicator. The default setting of ATR is 14 periods. However, it is not fixed and can be altered. ATR indicator period can be increased or decreased depending on trading style. The general statement to be kept in mind is that, decreasing time period leads to increase in number of false signals and generates noise . On the other hand, increase in time period decreases false signals by decreasing sensitivity of the indicator . At the same time , number of signals generated is also reduced. I think the best setting would be determined by trading style. For example, an Intraday trader would prefer using smaller time frame and a swing trader would prefer longer time period. To be specific, for short term trading 10 periods is best and for long term trading 50 periods is working best for me. ATR indicator measures volatility of the asset on the basis of variation in price over particular time frame. We know that, an asset is said to be volatile when there is significant variation (up /down) in price over short time interval. The volatility is therefore reflected on the ATR by significant up and down moves corresponding to the moves on price chart. In the BNB/USDT chart above, I have highlighted two zones on price chart and corresponding two zones on ATR. Zone A on price chart and zone A' on ATR marks a huge bearish move on price chart and corresponding spike on ATR. Zone B on price chart is shown as bearsh move lesser than zone A and is therefore shown by a spike B' lesser in height than spike A'. No indicator is absolute and same holds true for ATR. It has to be supplemented by other indicators like parabolic SAR, CCI, RSI or some other strategy that a trader is confident in using with. Let me showing how parabolic SAR is helpful. In the chart above, we can see that a phase of consolidation is followed by rapid upward movememt of price and a spike on ATR and parabolic SAR is below price line. Buy position can be taken and exit can be taken where a parabolic SAR is above price line as shown by arrow and same is seen on ATR spike and down move thereafter. So parabolic SAR and ATR when used together can prove better than either of them alone. Having already mentioned that volatility is indicated by rapid moves on the price action and corresponding spikes on the ATR indicator. It has been exemplified above that as prices moves up or down, ATR also makes spikes. However, this general principal may not hold true always. When there is strong bullish or bearish dominant force, that is definitely reflected on ATR indicator by making spikes. However, if the driving force is not strong, such Spikes on ATR would not be seen. BNB/USDT chart taken from trading view In the BNB/USDT chart above, I have marked two candles with two vertical lines and labelled them as A and B. We can see that, at point A, bearish candle formed is not able to produce spike on ATR indicator and therefore indicate that the dominant force is not strongly bearish . On the other hand, at point B a strong bearish candle is followed by strong spike on the ATR indicator and therefore indicates strong bearish dominant force and that can be seen on the price chart. Same can be seen in case of bullish dominant forces. Risk management is one of the most important factors of trading system. It involves multitude of factors like quantity of token to be traded, amount of funds to be used, stop loss, number of trades to be taken per day, take profit strategy, holding of winning trades, and other psychological factors like FOMO etc. I believe all these parameters are equally important to be a successful trader. But the two important parameters that can be derrived from ATR indicator are stop loss and take profit levels. For these two parameters, there are multiple ways to determine these levels. Some traders make use of definite mathematical ratios like 1:2 and 1:3 and some make use of exponential moving averages like EMA 200. Let's discuss how these levels are determined on the basis of ATR. Stop loss : The price point at which a trade is anticipated to exit in case it doesn't go in favourable direction. It is extremely important to avoid loss ( so called stop loss) because no trader has a win rate of 100% and market manipulation by financial institutions can at times turn the table. I have myself been victim of not setting stop loss and I ended up in blowing my account of 1200$ with loss of 1k$. On the basis of ATR, stop loss is calculated as : SL= Entry price +/- 3 ATR ( + sign in case of short position and - sign for long position) In the above chart, the entry price for sell position is 1.2150 and ATR is 0. 0125. SL= 1.2150+ 3x 0.0125 = 1.2525 However, stoploss actually depends on trading style and risk bearing potential of trader and vary from subject to subject. Take profit : The price point at which a trade is anticipated to close in case of trade going in favourable direction. It is important to set this level to book profit at a certain pre specified level for several reasons. Firstly, to save time and energy that would otherwise be consumed by sticking to screen. Secondly, in case of reversal of market , if TP is not set, one may end up in lesser profit or even loss. On the basis of ATR, TP can be calculated by using formula for SL with opposite sign in case we want to set SL/TP to 1:1 . Otherwise, it will keep on changing as per traders SL/TP ratio. In the above case, if i presume SL/TP to be 1:1 , i would be calculating it as, TP= Entry price - 3xATR ( for sell position) Entry price is 1.2150 TP = 1.2150 - 3 x 0.0125 = 1.1775 The strength of trend is highlighted when movement of price in the direction of trend is reflected on ATR as strong impulse. If a bullish price rally breaks resistance and ATR shows higher peak of oscillatory waves, it confirms strength in uptrend. Similarly, if a bearish rally of price breaks support and ATR also shows higher oscillatory peaks, it confirms strong downtrend . ATR doesn't nullify the basic breakout criterias like good volume and breakout with powerful candle etc. So ATR would supplement but not substitute the basic and fundamental trading rules. So this discussion is about continuous pattern. As for reversal is concerned, basic funda will remain same. Trend reversal is indicated when price rally change its direction from some important level and that is syncing with the oscillatiory move on ATR indicator, that would indicate trend reversal. For example, an up going price really meets resistance at some point and reverse its direction toward the support. When the change in direction from bullish to bearish is followed by an impulsive peak on ATR , that indicates the trend reversal and same holds true for a bearish going raliy too. A bearish rally of price turning back from the support and ATR showing a higher peak confirms reversal. ATR is simple to use and interpret , as it is represented by a single line below the chart making up/down movements with the movement of price It can be used on any time frame as per trader's convienene and trading style. When used with other indicators, it can generate valid signals and therefore facilitate ease of doing trade. It helps in better risk management by allowing users to set more logical SL and TP levels. It doesn't obscure the price chart as it is not an overlay indicator. ATR helps in calculation of supertrend indicator. The biggest drawback is that, ATR doesn't provide any entry signal. It does give a fair idea of volatility but no input signal to be materialised. ATR gives no signal about forthcoming market trend. There is no absolute value to determine volatility. It is based on comperative study . Like other indicators, ATR is not100% acccurate and needs support of other indicators. ATR is a technical analysis indicator that is used to measure volatility of the market and is non directional in nature . In addition, it helps in risk management by providing logical SL and TP levels. Although, it is a simple tool but it has certain limitations like other technical indicators and need support of other indicators to confirm signal generation.
BAT/USDT
Calculation of ATR.
Current high minus previous close
Current low minus previous close
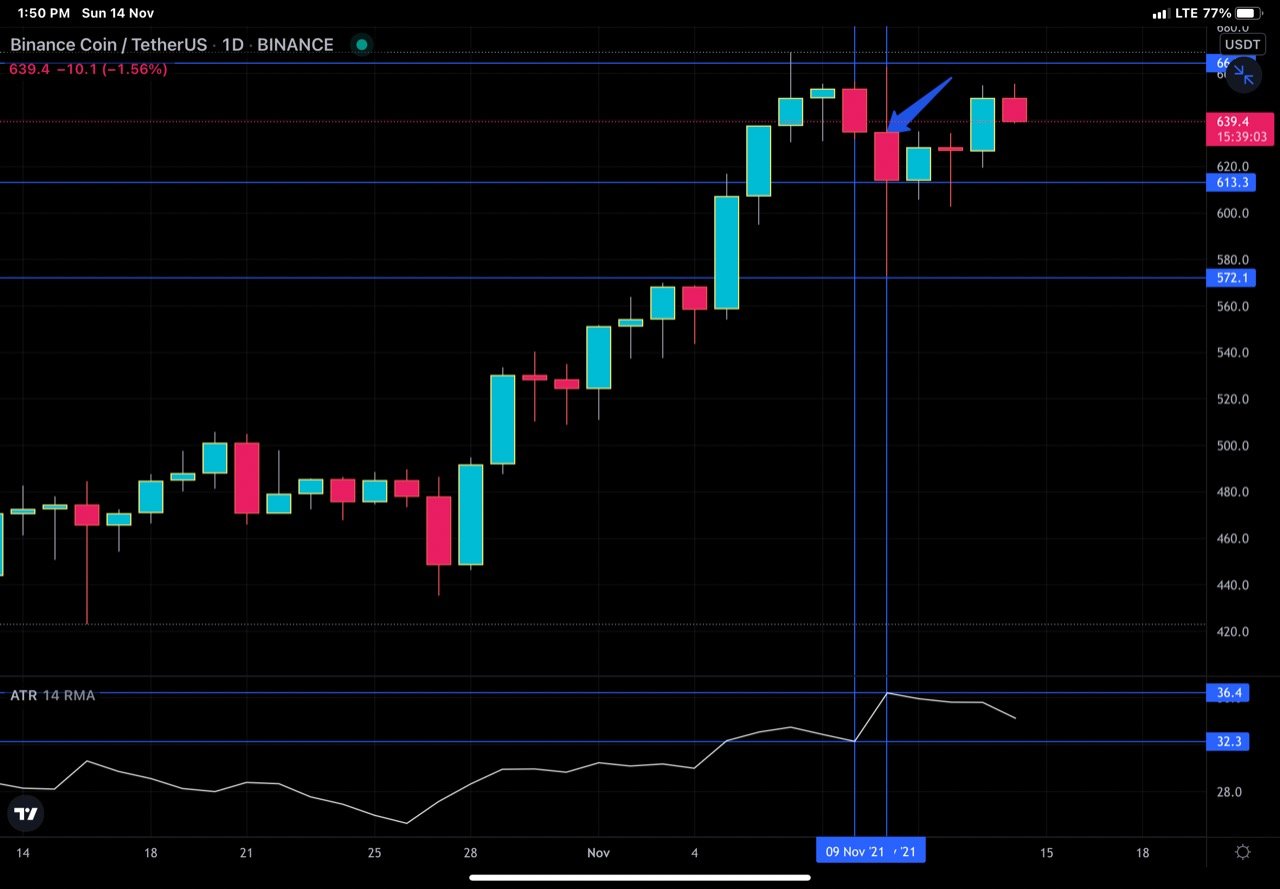
BNB/USDT chart from trading view app
Current TR = 89.7 (calculation done Sepeately)What do you think is the best setting of the ATR indicator period?
How to read the ATR indicator? And is it better to read it alone or with other tools? If so, show the importance. (Screenshot required)
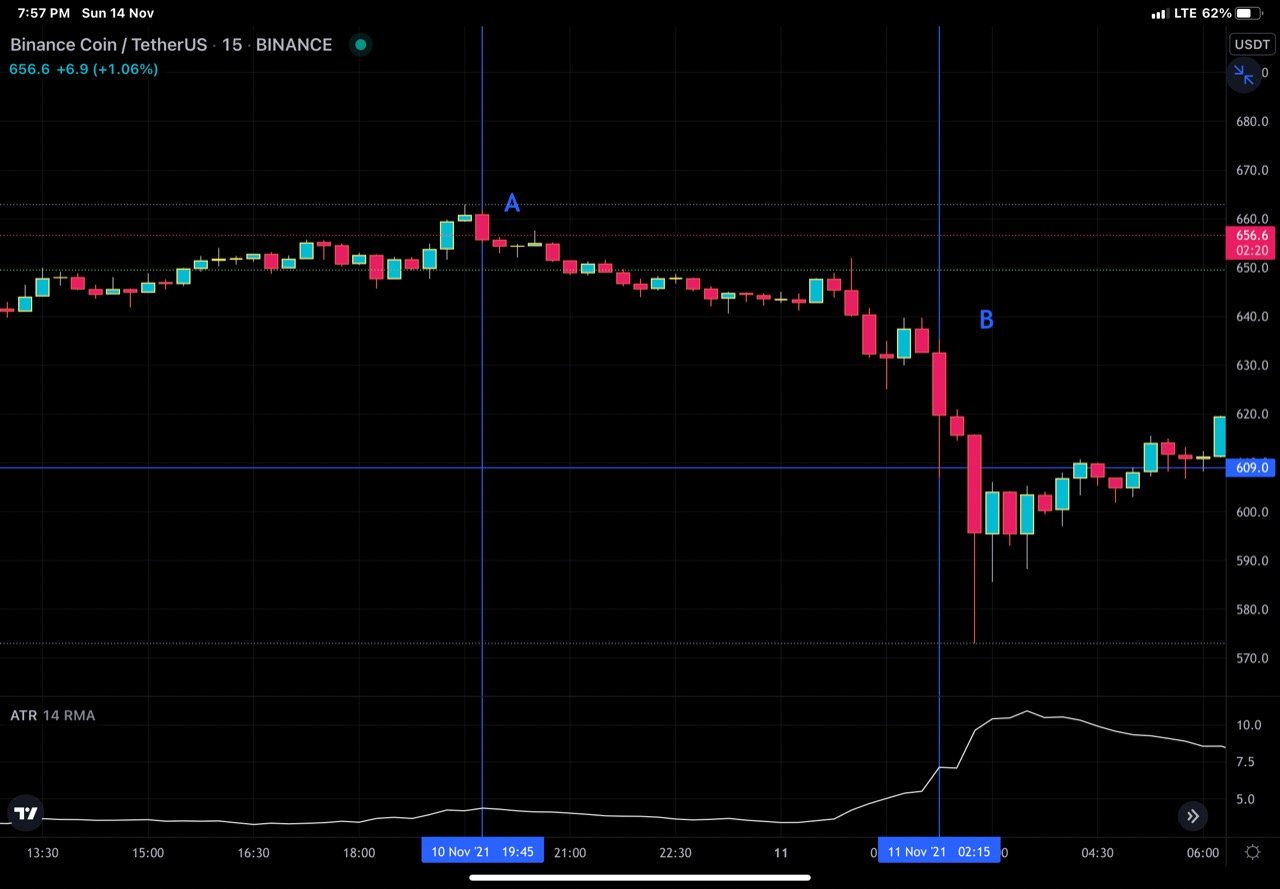
BNB/USDT chart taken from trading view app

BAT/USDT chart from trading viewHow to know the price volatility and how one can determine the dominant price force using the ATR indicator? (Screenshot required)
How to use the ATR indicator to manage trading risk ?(screenshot required)

<BAT/USDT chart taken from trading view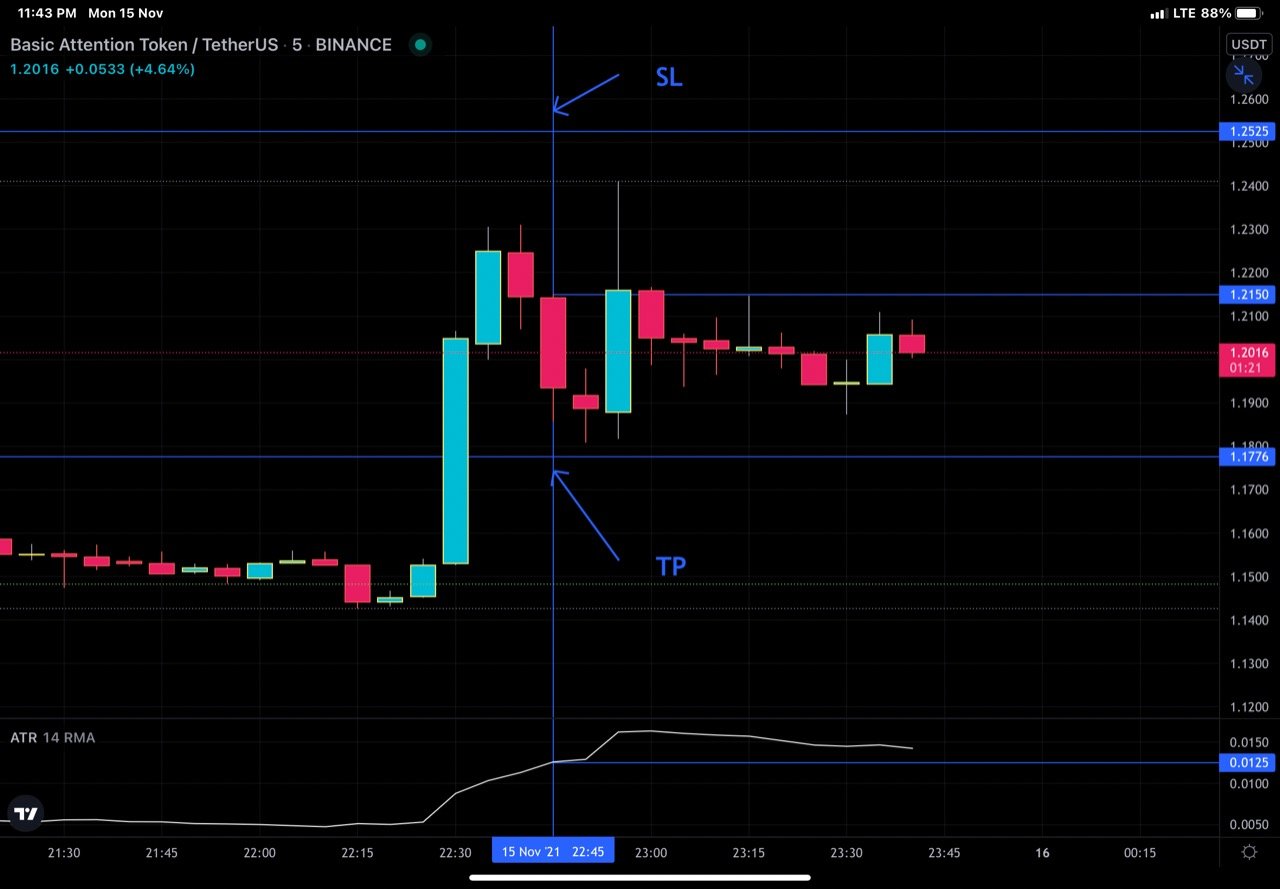
BAT/USDT Chart from trading view
ATR is 0.0125How does this indicator allow us to highlight the strength of a trend and identify any signs of change in the trend itself? (Screenshot required)

ETH/USDT Chart showing breaking up of resistance by upgoing price rally and spike on ATR that indicates strong uptrend 
ETH/USDT chart showing trend reversal after taking support and same is reflected on ATR as sharp spike up showing strength in uptrend after reversal of downtrend. List the advantages and disadvantages of this indicator:
Advantages
Disadvantages
Conclusion
Good post Dr. But I think Question 4 needs your attention. In this question you mention that A and B bearish candles that represents the dominant price force.
But there are no bearish candles in the figure that is placed in Q4. I think you need to update your figure.
May be I made a mistake to figure out. But you should check it again. Thank you 😊.
Thank you very much. You are right. Actually wrong image was posted there. Now I edited it.
I guess you'd make a good Professor. :)