[Alligator Indicator ]- Crypto Academy /S5W3-Homework Post for kouba01
Hope your are all doing well. We are in week 3 of season 5 of cryptoacademy and today I am writing homework task for professor @kouba01 , which is about Alligator Indicator. Let's begin .
Discuss your understanding of the use of the Alligator indicator and show how it is calculated?
Alligator indicator was developed by Bill williams in 1995. The metaphor Alligator has been used to correlate behavior of market with that of Alligator. The indicator is composed of three lines colored differently . These lines are actually the smoothed moving averages of different periods and have been named as per different parts of the alligator. Below I'll tabulate three different lines, color, time frame and offset.
| Line (color) | Period | Offset |
|---|---|---|
| Jaw line ( Blue) | 13 | 8 |
| Teeth line(Red) | 8 | 5 |
| Lip line (Green) | 5 | 3 |
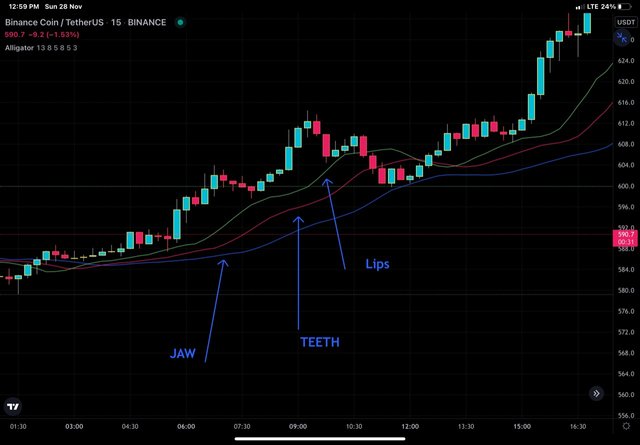
Alligator indicator Labelled
Bill Williams believed that about 70% of the times market is not in trend and only about 15 to 30% of times, market is in trend and it is the trending market where traders make huge money. So it is necessary to spot these trends and ride them to make good money.
The alligator indicator is used to spot begining and strength of trend in merket. In addition, it also helps in detecting trend reversal and choppiness of the market. The ultimate goal of any indicator to provide buy and sell signals is fairly served by alligator indicator too.
As for metaphor alligator is concerned, Bill Williams correlated sleep of alligator with indecision in market. As alligator after waking from sleep looks for prey, the indecision in market is followed by trend . After having meals , the alligator again goes for sleep and so does a market because a trend won't continue forever. So during awake phase, a trader should book profit ( meals) before market goes the other way around.
Calculations of Alligator indicator.
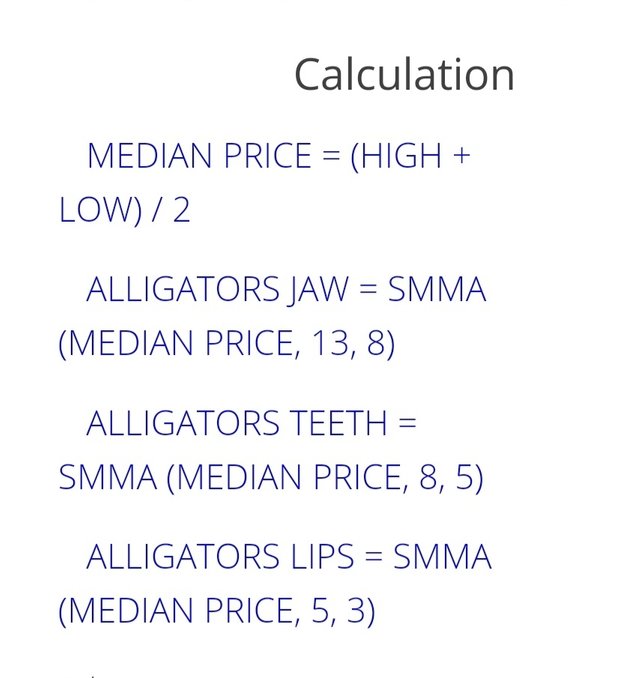
Source
MEDIAN PRICE = (HIGH + LOW) / 2
ALLIGATORS JAW = SMMA (MEDIAN PRICE, 13, 8)
ALLIGATORS TEETH = SMMA (MEDIAN PRICE, 8, 5)
ALLIGATORS LIPS = SMMA (MEDIAN PRICE, 5, 3)
Where, SMMA is smoothed moving average . Smoothed moving average is the exponential moving average that doesn't ignore older data but give due consideration to historical data as well. In SMMA only longer period takes effect and it is different from SMA and EMA.
Show how to add the indicator to the chart, How to configure the Alligator indicator and is it advisable to change its default settings ?. (Screenshot required)
I'll be using trading view app. You can do it from official website of trading view too. I launched trading view app.
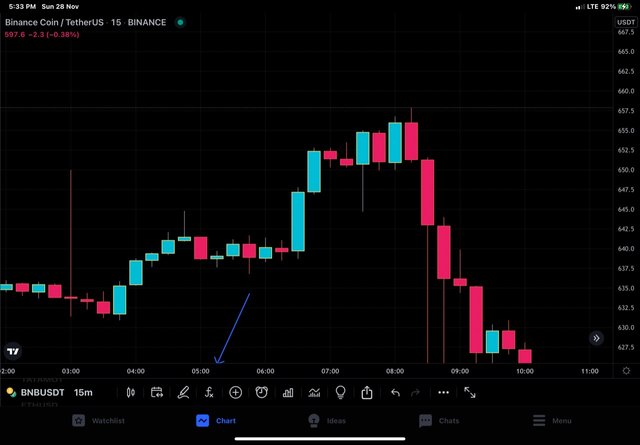
Select any trading pair. Chart of the pair will load.
Click on indicators from the top menu. In my case, i have Indicators option at bottom of the chart.
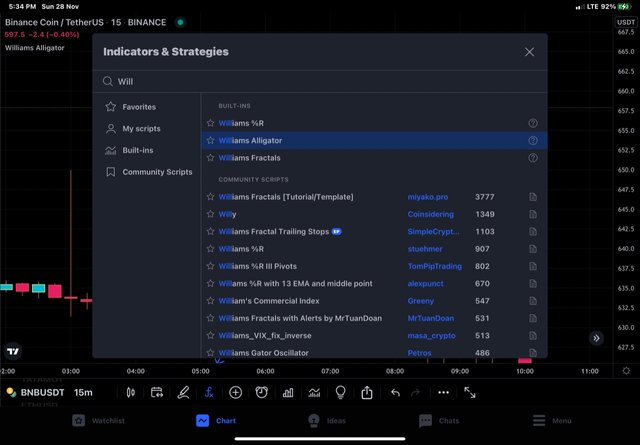
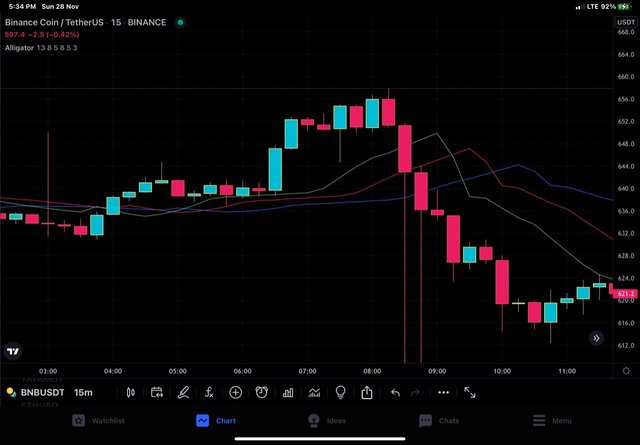
Next we type "William's Alligator" in the search box provided and select same Indicator from the suggestions. Go back to your chart and you will find indicator loaded to the chart.
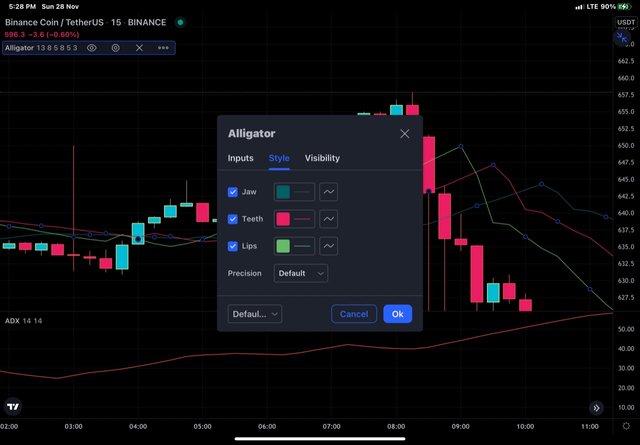
Configuration of the Alligator Indicator.
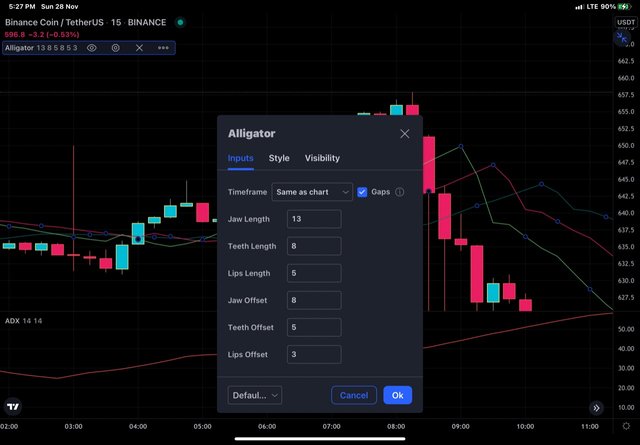
Double click on Indicator and chart settings will load.
Style settings: Here we can choose color and precision of indicator, : Here we can choose color and precision of indicator, we can choose any color for three lines.
In the Inputs settings, we have indicator timeframe and onset. We have Jaw length, teeth length, lip length, jaw offset, teeth offset,, lip offset .
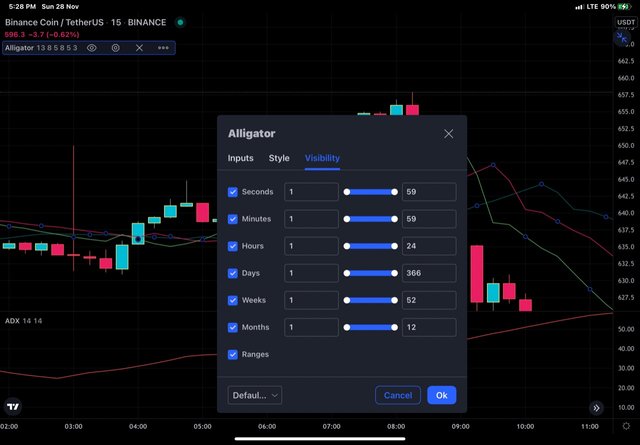
In the visibility, we have seconds , minutes, hours, days, weeks, months. Let's keep default settings for visibility.
The default settings of allegator indicator have been suggested by Bill Williams and it is not advisable to change the default settings. It may be due to several reasons like , we cannot challange inventors wisdom as the indicator settings have been developed based on his long expertise and not coincidentally. Secondly, the numbers 3 , 5 and 8 are part of Fibonacci series and we know the Fibonacci numbers form important levels from which price takes supporr and resistance.
The periods can be changed to increase or decrease the sensitivity of the indicator. Increase in length of period of the indicator will decrease the sensitivity and decrease in length will increase sensitivity. Increase in sensitivity leads to the generation of more false signals and decrease in sensitivity will lead to missing out of some valid signals.
How do we interpret this indicator from its 3 phases: the period of rest(or sleep), awakening, and the meal phase?(Screenshot required)
The three phases of the indicator can be understood by drawing its analogy to the different parts of the alligator during different phases.
As the name implies, during rest an alligator sleeps with the three parts ( jaw, lips and teeth) together and shows no movement. its analogy to the market can be understood by togetherness of lines representing jaw, lips and teeth. So the rest phase of indicator refers to consolidating or choppy market. We know that during consolidating phase, market moves in a zone also known as no trading zone. So it is advisable not to take any position during rest phase of the alligator indicator.
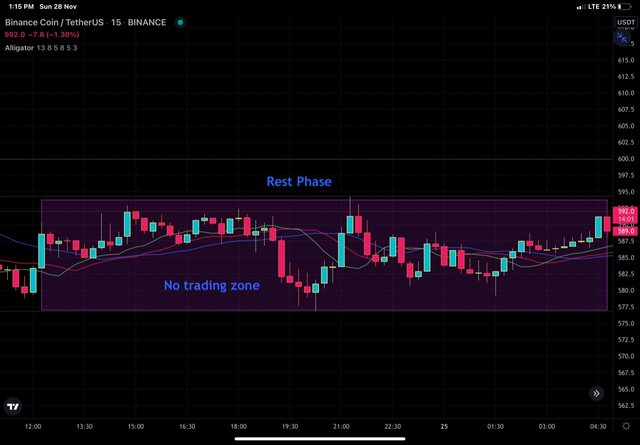
BNB/USDT Chart from trading view showing sleep phase
In the chart above, we can see that three lines of the alligator indicator are close together and the market is in consolidating phase . From the basic knowledge of price action, we know that a consolidation phase is followed by a trending market in either bullish or bearish direction. So it is also a potential zone to track so as to ride the forthcoming trend.
When the alligator wakes up, he has to quench his thirst or hunger by looking for prey and for that an alligator has to open his mouth wide apart. So the three parts of the alligators mouth will be wide apart to hunt. After having meals, alligator will go back to sleep.
At technical level we can say that, during awake phase the three lines of the indicator are wide apart, contrary to the sleeping phase where they were close together. So it is during this awake phase that the trader has to follow the trend and book the profit ( meal phase) .
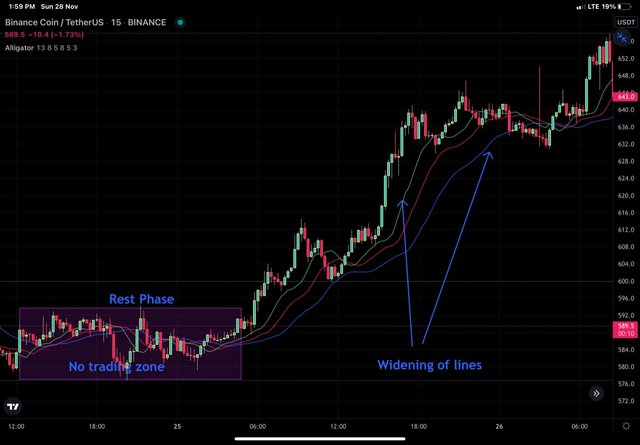
BNB/USDT Chart from trading view showing awake and meal phase
In the chart above, we can see that sleep phase culminated into an uptrend phase and the lines of the alligator indicator are wide apart.
Based on the layout of its three moving averages that make up the Alligator indicator, how can one predict whether the trend will be bullish or bearish (Screenshot required)
It is possible to predict the nature of trend , whether the trend is going to be bullish or bearish after the sleep phase of alligator indicator by noticing the behaviour of 3 moving average used in the indicator.
As mentioned above, during sleep phase the three lines are close to each other and during trending phase lines are wide apart. So the beginning of trend would be marked by movement of lines away from each other and the weakening or fading away of trend would be noticed by coming together of lines that were diverged during trend.
As we are in position to identify begining and fading of trend, now to identify type of trend, we should look at orientation of three colored lines. The principle is simple, if blue line is at bottom and green line is at top- it marks the beginning of bullish trend. On the other hand, if green line is at top and blue line is at bottom, it marks the beginning of downtrend or bearish trend.
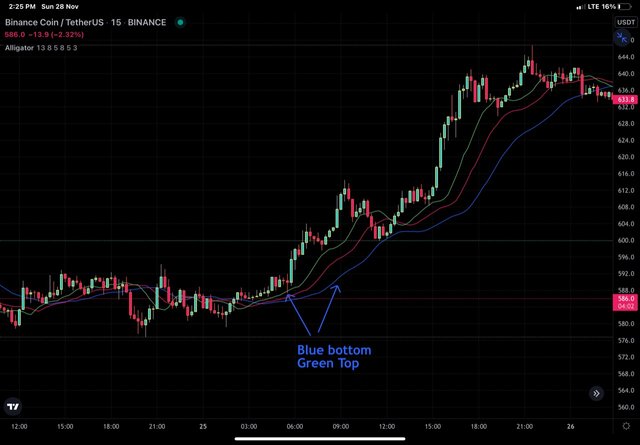
BNB/USDT chart showing begining of bullish trend by orientation of lines as blue line at bottom and green line at top
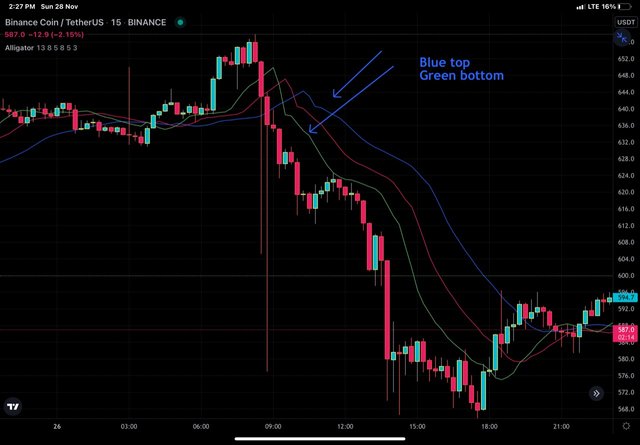
BNB/USDT chart showing begining of bearish trend by orientation of lines as blue line at top and green line at bottom
Explain how the Alligator indicator is also used to understand sell / buy signals, by analyzing its different movements.(screenshot required)
The purpose of using any indicator is to support a trader's judgement of entry or exit from the market. Having understood the basic working of alligator indicator, we are in better position now to understand the buy and sell signal generated by the alligator indicator. If we carefully analyse the beginning of bearish and bullish trend, we will be able to get it from there. Just to make things clear, I'll put it out as :
A buy or sell signal is generated by looking at orientation of three lines with respect to each other.
Buy signal would be materialized by spotting it at begining of bullish trend and a sell signal by spotting it either at end of bullish trend for those having taken buy position or at the begining of bearish trend for those trying to short the market.
Buy signal is generated when blue line is at bottom, red in the middle and green at the top.
Sell signal is generated when blue line is at top, red in the middle and green at the bottom.
The exact price point to enter the market would be determined after confirmation of trend. For trend confirmation, a trader can make use of either the price action like breaking up of an important level by strong bullish or bearish candle or waiting for 3/4 of period uses kn indicator.
Closing of buy or sell position can be done by various ways . To begin with, a trader can close position as per SL/TP ratio but for traders having gained expertise from market, trailing stoploss is better to use because trending markers are expected to yield good profit that way. On the bais of alligator indicator, coming together of lines can be taken as signal to close the position by some while other may wait for actual touching of lines . However, these are subjectove observations and cannot be generalised.
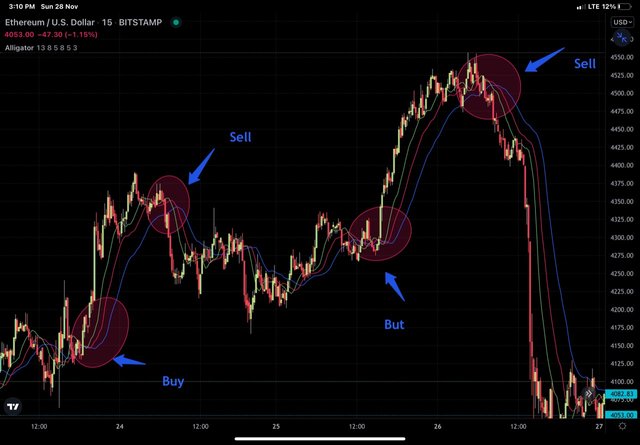
ETH/USDT CHART SHOWING BUY AND SELL SIGNALS
Do you see the effectiveness of using the Alligator indicator in scalping trading style? Explain this based on a clear example.(Screenshot required)
Scalping is a subtype of intraday trading style where a trader carries out numerous trades in a day, each trade lasts for only seconds to minutes. Trader earn small profit from each trade and so place multiple trades to collectively make it a good sum. As traders do not expose their position to the market long, they are subjected to less risk too. Owing to the number of trades performed, scalpers need to stick to the screen throughout the trading sessions.
As for use of alligator indicator in case of scalping is concerned, it can prove quite profitable. Let's have a look below :
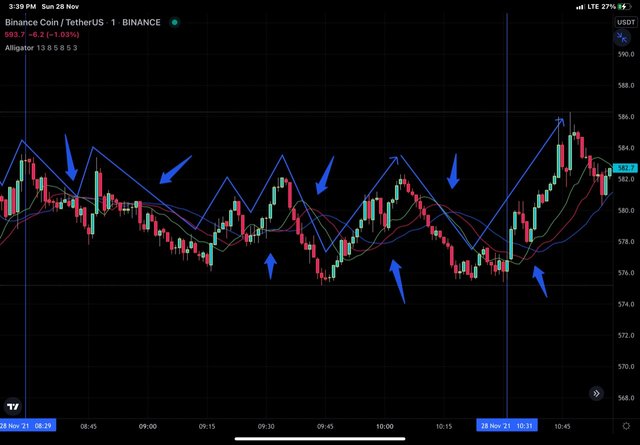
BNB/USDT multiple scalping positions
In BNB/USDT chart set over 1 minute time frame over a period of 2 hours , a scalper can take 10 positions and we can see that the market is choppy Or sideways. The alligator indicators has shown multiple crossovers and signals thereby although a bit late everytime. So alligator indicator along with price action can prove profitable for a scalper.
Is it necessary to add another indicator in order for the indicator to work better as a filter and help get rid of unnecessary and false signals? Use a graph to support your answer.
We know that, no indicator is 100% accurate and same holds true for alligator indicator too. It does generate some erroneous and unnecessary signals like other indicators. So it is necessary to supplement alligator indicator with some other indicator to filter out erroneous signals and therefore increase the chances of taking winning positions . I'll use Alligator indicator with the help of another indicator named average directional index (ADX) . As alligator help in detecting trending by orientation of different lines, ADX helps in detecting strength of trend. Please note that, ADX is a non directional indicator.
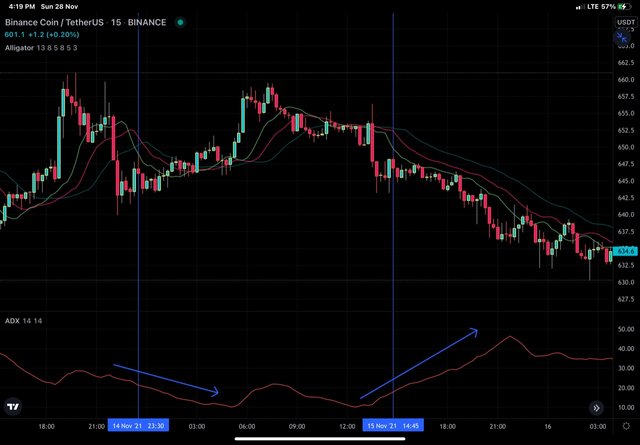
BNB/USDT chart with Allegaror indicator and ADX indicator
I have marked two vertical lines corresponding to two sell signals generated by alligator indicator (color changed). Look at left vertical line , the alligator indicator generates sell signal which cannot be materialised as per price action. Having taken this position on the basis of alligator indicator, one would gain nothing from the market. If we look at ADX, we can see that there is no strong trend corresponding to first sell signal, so it can be avoided.
Next look at right vertical line, it also gives sell signal. If we look at ADX indicator, it shows increasing strength of trend. Being non-directional , it moves up for both uptrend and downtrend. So it is valid signal as confirmed by both the indicators. We can see that, it can be materialised well.
List the advantages and disadvantages of the Alligator indicator:
Advantages of Alligator Indicator.
Alligator indicator is simple to use and understand. It provides visual recognition of trend and other signals.
It makes use of three different moving averages and therefore signals are generated based on inferences drawn from these lines.
Number of false signals generated is comparatively lesser than that of single or two moving averages.
It works wel in all the markets and over all time frames.
Disadvantages of Alligator indicator
Signals generared are always a bit late than actual movement of price owing to lagging nature of moving averages.
Indicator does generate false signals although fewer.
It has limited utility in choppy markets.
Conclusion:
Alligator indicator is a simple technical analysis tool to detect trend in the market and generate buy and sell signals so as to aid traders in taking right decisions. It makes use of three different moving averages and generates signals on those basis. Jist like other indicators, it has to be used with other indicators to filter out erroneous signals and increase validity of generated signals
amigo creo que se te escapo algo, es que en el titulo de la configuracion del indicador colocaste arron. @drqamu
Hi @drqamu
I think you've done a little mistake on table.
Red line is teeth
Thank you for pointing it out.