[ Advanced Technical Analysis Using Fractals ]-Steemit Crypto Academy | S5W8 | Homework Post for @reddileep
Hello guys, hope you are all doing well. We are probably in last week of season 5 and it has been very fruitful like other seasons. Today I am writing homework task for professor @reddileep which is about Trading with fractals.

Define Fractals in your own words.
From the basic knowledge of price action that we have by now, we have studied certain chart patterns like Head and Shoulder pattern, inverse Head and Shoulder pattern, flag and pole pattern, Cup with handle etc. We have also learned about some candlestick patterns like morning star, evening star, hanging man etc. These chart patterns and candlestick patterns have been delineated by analysts over a period of time as price action was found repeating these patterns.
The concept that we are going to learn today is somewhat similar to these chart patterns and candlestick patterns but the difference here is that the chart patterns take large number of candles to manifest whereas candlestick patterns are often formed by two to three candles only. Fractals are reversal patterns of price action for which number of candlesticks have been arbitrarily set to five. To put it simply, we can say that fractals are five bar price patterns , where a bar refers to a candle. Fractals can be bullish or bearish. Formation of a fractal indicates forthcoming trend reversal and can therefore be materialized. But fractals can't be traded on their own . Fractals have to be used with other indicators to generate and valodate the signals together.
With the advancement in the trading tools, fractals based indicators have been developed like William's fractals. The fractals are shown as bullish and bearish arrows on the chart. Bullish fractal will be seen as a down arrow below the fractal and bearish fractals will be shown as an up arrow above the fractal. The direction and location of arrow should not be confused with the price direction. An up arrow doesn't mean price will go up but it indicates forthcoming bearish price action.
Explain major rules for identifying fractals. (Screenshots required)
Purpose of finding any chart pattern or candle pattern is to be able to gain advantage from it. So to benefit from fractals, we should be in a position to spot the fractals. As mentioned above, there are two types of fractals, bullish and bearish fractals. For either of the two types of fractals to be valid there must be five bars (candles).
Bearish fractal should have highest high in the middle and two lower highs on either side. it is analogous to a continuation pattern of price action resulting in formation of higher highs and higher lows. In continuation pattern of price action, reversal is spotted on the same lines aa fractal reversal, that is, highest high followed by higher low.
Bullish fractal should have lowest low in the middle and two lower highs on either side. it is analogous to a continuation pattern of price action resulting in formation of lower lows and lower highs In continuation pattern of price action, reversal is spotted on the same lines aa fractal reversal, that is, lowest low followed by lower high .
Five bar fractal is an ideal pattern. Even lesser bars can form fractals but their authenticity is lesser compared to standard five bar fractals. Let's look at ideal animated fractals below for the sake of clarification of concept and subsequently I'll move on to real charts.
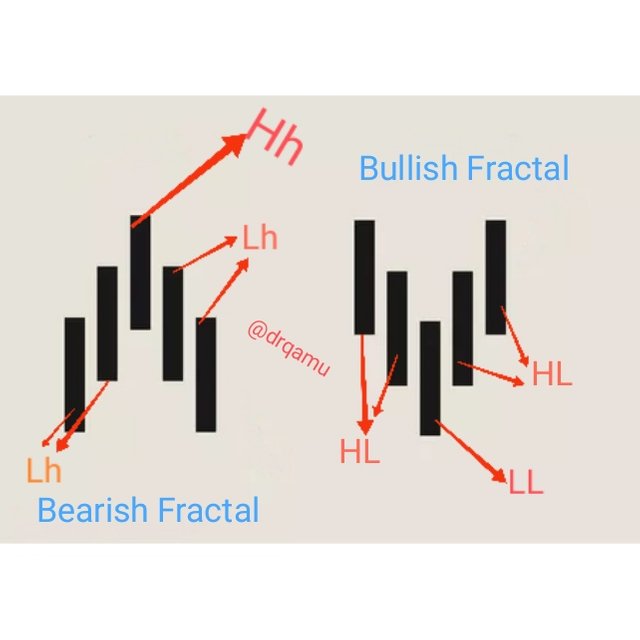
Self designed fractals
Look at real chart of BNB/USDT . I have identified bullish and bearish fractals and highlighted them with the help of rectangular boxes. We can clearly see on the charts that, price action respects this fractals fully
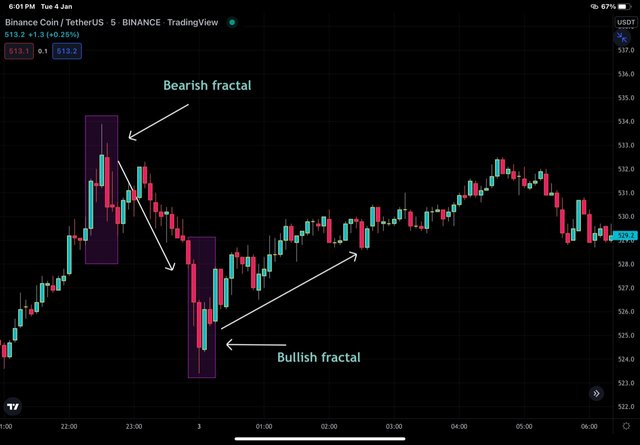
BNB/USDT Chart showing bullish and bearish fractals -taken from tradingview app
We can see that price falls following bullish fractal and increases afterbearish fractal.
What are the different Indicators that we can use for identifying Fractals easily? (Screenshots required)
We have understood the meaning of fractals. With the technological advancement, fractal based indicators have been developed like William's fractal indicators, fractal support and resistance, fractal hugh and lows, fractal breakout, fractal regression bands etc. Let's begin by William's fractal indicator.
William's Fractal Indicator
William's fractal indicator is shown by red and green arrows on the chart. The green Arrow represents bearish fractal and is projecting up and loacted on upper side of price action chart and signals forthcoming bearish move
The red Arrow represents bullish fractal and is projecting down and loacted on lower side of price action chart and signals forthcoming bullish move
These fractals appear so frequently on the chart that they are confusing and are more suitable for scalpers. However, use of other indicator with fractals can aid in taking position for swing traders as well but every other fractal can't be teken as an exit /entry signal.
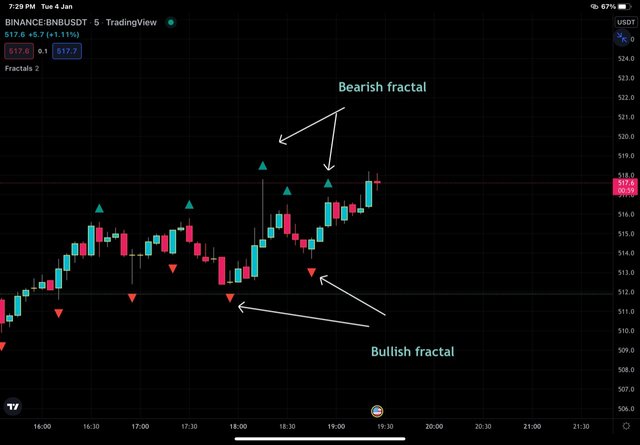
William's fractal indicator applied over chart - trading view app
In the above chart, we can look at orientation and location of fractals arrows as described above.
Fractal Support and Resistance
Now, let's talk about fractal support and resistance along with fractals breakout strategy. We know that, support represents price level where decreasing price of an asset is expected to pause and bounce back towards bullish direction. On the other hand , resistance represens level where increasing price of an asset is expected to pause and bounce back towards bearish direction. Fractal support and resistance uphold the same principle and are represented as Red and Green lines. Red lines represent the support and green lines represent the resistance.
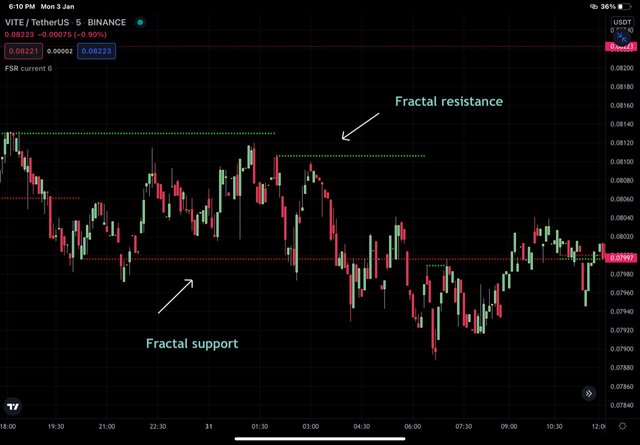
Chart showing fractal support and resistance
Fractal Breakout strategy is based on the principle that, if the fractal resistance is broken, the price is expected to go further bullish and a trader can materialise a signal by taking buy position. on the other hand , if fractal support is broken, the price is expected to go bearish and can be materialized by taking cell position.
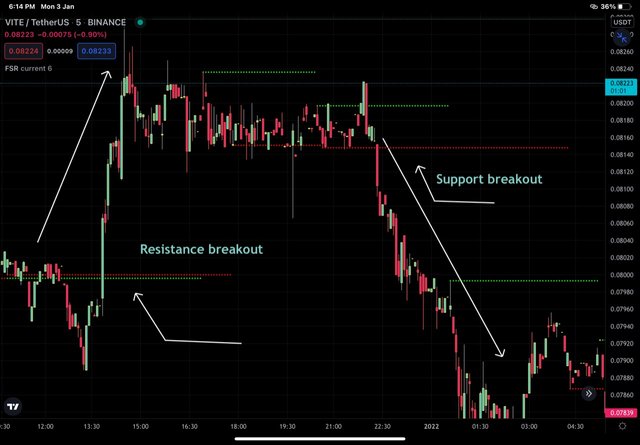
Vite/USDT chart from trading view
In the chart above, I have labeled bearish and bullish breakout and it can be seen that price action is respecting these levels as mentioned.
Graphically explore Fractals through charts. (Screenshots required
By now, we learned about fractals, bullish and bearish fractals, their appearance on charts, fractal indicator etc. Now we will explore fractals on charts by identifying fractals with the help of trading tools. Let's make use of tradingview software.
From the "Bars Pattern" Option provided in trading view, I'll select the fractals from the chart and try to find out other patterns on the price action of same chart else where as well.
DOT/USDT
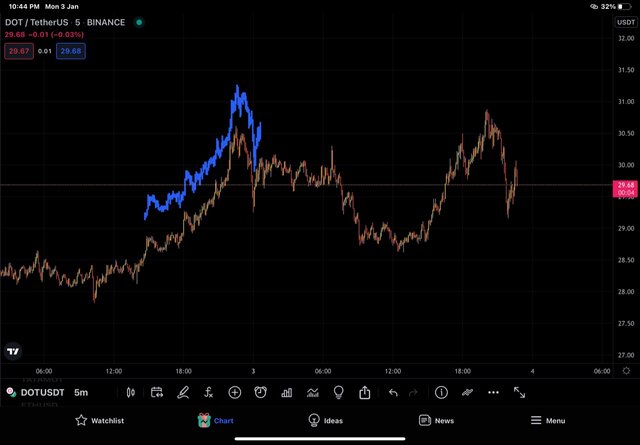
DOT/USDT chart showing fractal
From the DOT/USDT chart above, I have selected a portion of uptrend followed by pullback. In the next part of chart, I'll use the same fractal and try to find if it is repeated. In the chart below, I have copy pasted the chart and found that the pattern is almost repeated. Please note that, fractals are not be taken as 5 bars only. But the concept of fractals is used but more data has been taken into account.
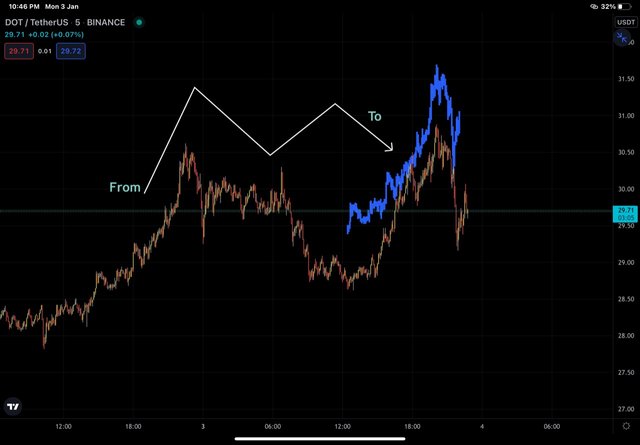
Fractal repeated
RUNE/USDT chart
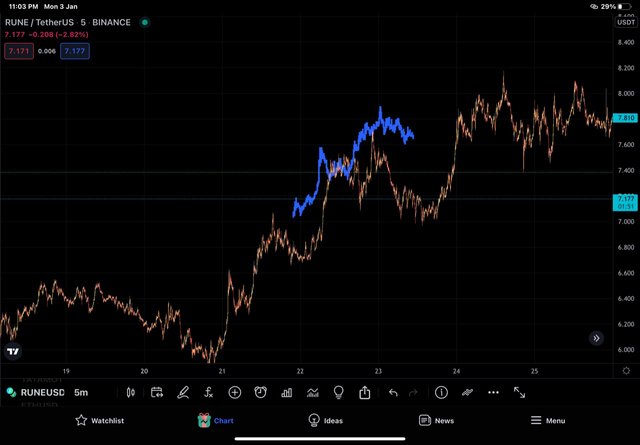
RUNE/USDT Chart showing fractal
In the RUNE/USDT Chart above, I have selected a continue pattern of bullish trend and selected a fractal involving swing high and one higher high. In the subsequent part of the same phase of marker cycle, the fractal is being repeated as shown below.
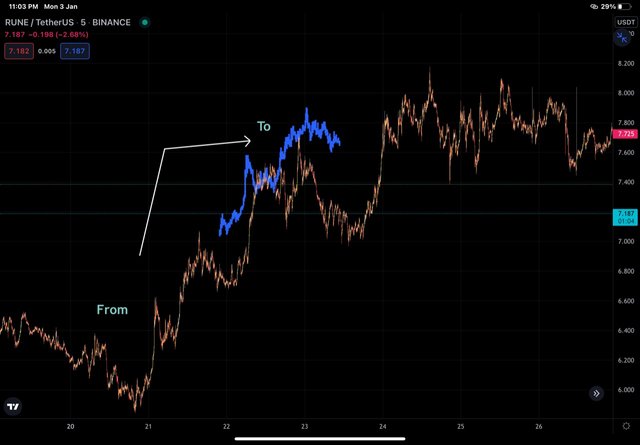
Fractal repeated
Do a better Technical Analysis identifying Fractals and make a real purchase of a coin at a suitable entry point. Then sell that purchased coin before the next resistance line. Here you can use any other suitable indicator to find the correct entry point in addition to the fractal. (Usually, You should demonstrate all the relevant details including entry point, exit point, resistance lines, support lines or any other trading pattern
I'll be making real purchase of RUNE tiken from my Wazirx exchange. I'll making use of multiple indicatora to place my entray. I'll use William's fractals, fractal support and resistance, Alligator indicator as well as price action. We have already discussed fractals and major rules. I'll mention Alligator indicator buy signal rules.
The principle is simple, if blue line is at bottom and green line (change rontelllw) is at top- it marks the beginning of bullish trend. On the other hand, if green line ( yellow here) is at top and blue line is at bottom, it marks the beginning of downtrend or bearish trend.
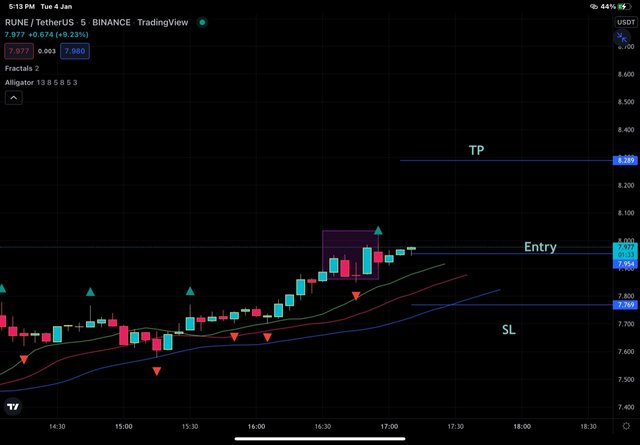
Entry made into RUNE/USDT Chart
In the chart above, a bullish fractal is formed and rules for bullish fractal are obeyed as there is formation of lower low and two higher lows on each side of lower low ( Within rectangle) . Alligator indicator has already opened mouth and has given buy signal. But i still waited for next candle to be bullish and i entered at 3rd candle after bearish fractal.
I entered at RUNE price of 7.954 USDT, set SL just below middle line of Alligator indicator at RUNE price of 7.769 USDT amd TP at 8.2 USDT . So SL/TP is > 1/1 and multiple indicators are involved. We can see that TP was hit.
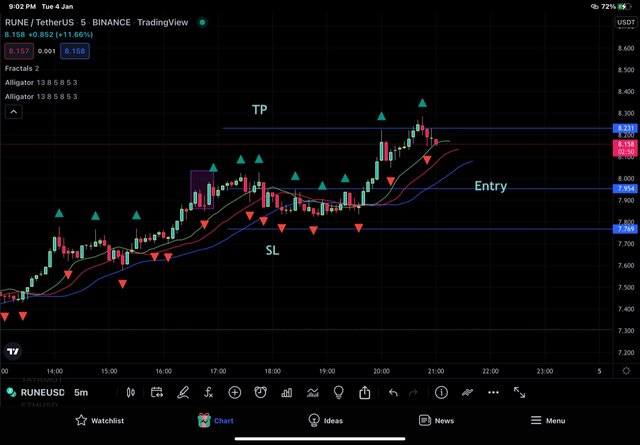
Order executed
Wazirx order details
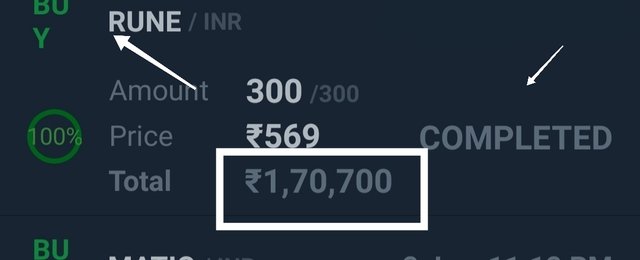
Buy order completed
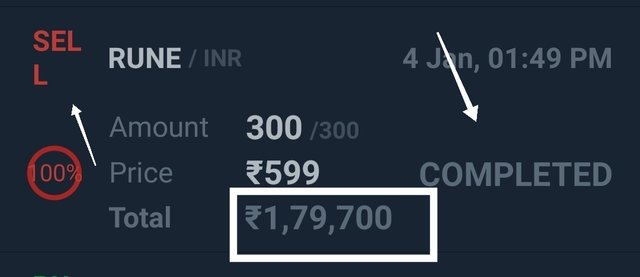
Sell order completed
Conclusion
Fractals is a five bar recurring price action patrern that points towards forthcoming price move and when identified correctly by traders can be materialized with rhe help of other indicatoTs and price action study to gain advantage from market. Fractals can be bullish or bearish and have different orientation and location as discussed.