Steemit Crypto Academy Season 3 Week 2 ||Beginners Course| introduction to charts
Explain the Japanese Candlestick Chart? (Chart screenshot required)

Source
The Japanese Candlestick Chart was developed by a man known as Hamma Muneshisa a popular rice trader in Japan. He developed the candlestick chart when notices that the market price for rice was influenced by traders emotions. Traders make use of the candlestick chart to determine the movement of price using with the help past partten. The Japanese candlestick chart show how price is move in four ways Open, Close,High, and Low within the period of time a trader set. The Japanese candlestick chart work by providing information about the movements of price and providing information about demand and supply in a graphical form.
The Components of the Japanese Candlestick Chart and How it Work

Source
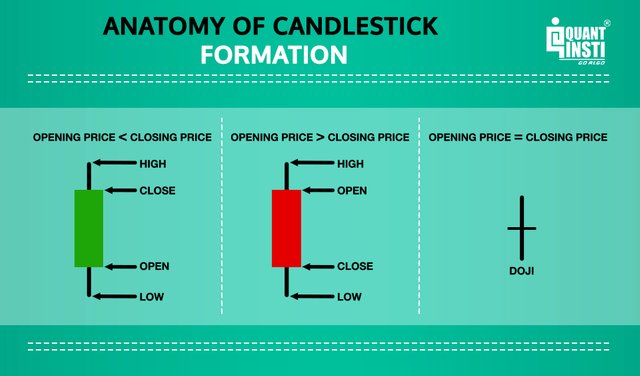
The candlestick chart has a wide portion, which is called the body. The body shows the point between the open and close of the assets that is being traded. When the body become black, it means the open was above the close. And in a case when the body become empty, it simply means that the close was greater than the open. The closing price of the asset that is being traded will tell if the candlestick is bearish or bullish. The Close price is at the top of the body why that of the Open price is at the bottom of the body. If the assets that is being traded is closed at a lower price than it open price for that day or the time frame, that is when the body will be filled up or become black in color as I early say.
Describe any other two types of charts? (Screenshot required)
The two types of chart that I have listed here are Line Chart and Point/figure charts
Line Chart:

Source
Line Chart is the type of chart that displays the closing price that is trading at at a particular point in time. The line chart is recommendable for daily trader because it is very easy for one to understand and comprehen.
Point/Figure Chart:

This is the type of chart that long term traders make use of because they already knows how to determine entry and exit point when trading. It also help traders in the aspect of demand and supply in the market with a rising in price indicated by Xs and the Falling in price indicated by Os axis.
In your own words, explain why the Japanese Candlestick chart is mostly used by traders.
To me, the reasons why the Japanese Candlestick Chart is mostly used by trader is that, the Japanese Candlestick Chart shows graphically the force of demand and supply that contribute in every timeframe price is being move. Also traders traders used it because it shows the four price points which are the open,close, high and low throughout the period of time that is being specifies by the trader.
Describe a bullish candle and a bearish candle identifying its anatomy? (Screenshot is required)
The Bullish candle is describe as;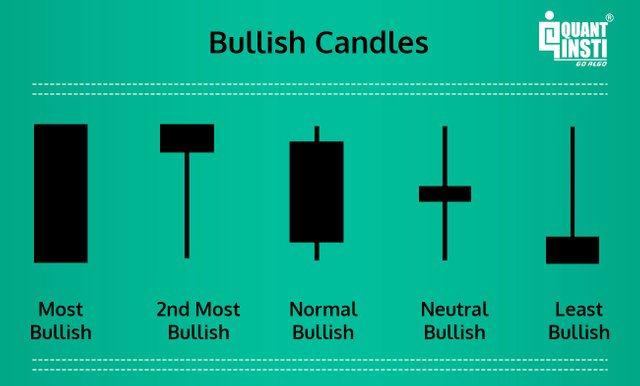
Source
- Most Bullish
- Second Most Bullish
- Moderate Bullish
- Neutral Bullish and
- Least Bullish
As for the Bearish Candle it's describe as:
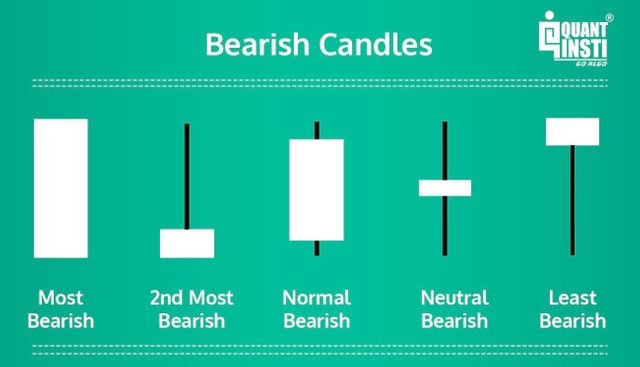
- Most Bearish
- Second Most Bearish
- Moderate Bullish
- Neutral Bearish
- Least Bearish
Source
The anatomy of the bullish candle is identify with green whereas the bearish is identify as the red candle. They both have open, closed, big and low end. They are both like bar chart and line chart each bar stands for all the four information.
The Long Body: Shows high trading in one direction and heavy buying or selling.
The Small Body: Shows low trading and little selling or buying.
The Shadow: This is the thine long lines that is below and above the body.
The Upper Shadow: this part is indicate at the top upper shadow.
The Lower Shadow: Is mark by the bottom at the lower shadow.
Hello @drmax1 , I’m glad you participated in the 2nd week of the Beginner’s class at the Steemit Crypto Academy. Your grades in this task are as follows:
Observations:
This statement is totally wrong.
Recommendation / Feedback:
Thank you for submitting your homework.