Crypto Academy Season 3 Week 4 | Homework Post for Professor @reminiscence01 | Candlestick Patterns
1. In your own words, explain the psychology behind the formation of the following candlestick patterns.
• Bullish engulfing Candlestick pattern
• Doji Candlestick pattern
• The Hammer candlestick pattern
• The morning star candlestick pattern
• The evening star candlestick pattern.
Bullish engulfing Candlestick pattern
Bullish engulfing candlestick pattern, is the type of Candlestick pattern that occur when buyers go faster than sellers. It's indicated in the chart by a long green real body engulfing a small red real body. This type of Candlestick pattern is indicate in a downtrend and is a of a red candle that is followed by a large hallow candle. When it gets to the next day or the candlestick pattern,the price will then opens lower than that of the previous low,still the pressure of buying will pushes the price up to what is higher than the previous high, for the buyers.
Below is an image of the Bullish engulfing Candlestick pattern

The psychology behind the formation of the bullish engulfing candlestick pattern is that buyers or seller should enter a long position whenever price goes higher than the high of the second engulfing candlestick pattern.also for the engulfing pattern to take place, the asset must open at a lower price on the day 2 of trading instead it closing at the 1 day.
Doji Candlestick Pattern
Doji candlestick pattern is one of the Vital candlestick pattern,that traders make use of when trading. The candlestick pattern is a continuation or reversal pattern. The Doji Candlestick pattern occur when buying and selling are battling for price. In this case the buyer want to pushes the price of the asset up whereas the seller want to pushes the price down.
Below is the image of the Doji Candlestick Pattern

In the Doji Candlestick pattern both the opening and closing price are of similarities.Sometimes the candle forms assived the opening and closing price are close together or the price is high. The forms takes place when the opening and closing price of is at the middle point, where both the upper and lower Shadow of the Candlestick are of similar point. From the above screenshot, the Doji has two different candle such as; Dragonfly Doji which is a bullish reversal pattern that when it forms in the downtrend, it signals a reversal in price. Also the **Gravestone Doji is the bearish reversal pattern that signals a reversal in price when it forms in an uptrend.
The Hammer candlestick pattern
The hammer candlestick pattern is very crucial when it turn out to be at the support and resistance levels. It's is indicate that both the opening and closing price is almost at the same price. At the candlestick there is a long wick in it which shows how strong the buyers has rejected price.
.jpeg)
The hammer candlestick pattern is just like a long tail which shows at when the candlestick begin price is pushed down by sellers. But after a while, buyers came in and took control of the price by closing above the open of the candle.
The morning Star candlestick pattern
The morning Candlestick pattern is of 3 three candlesticks with a strong bullish reversal candlestick pattern.
The three candlesticks are as follows;
The Strong Bearish which point out that sellers are in total control of price.
Small Doji Candlestick; this indicates the weakness and the incapability of sellers to make price go down the more. In a case where such things occurs it shows how the trend is weak and a possible reversal is about to take place.
Bullish engulfing the second candle. This shows that buyers are in total control of the market to make sure price go high.
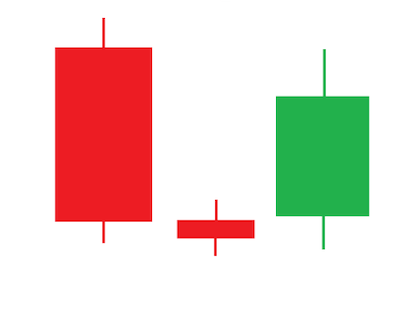
Here i can says that the phycology behind the morning star is that seller were in total control of the price before buyers now came in and take control of the market which makes sellers to lose they control.
The evening star candlestick pattern
The evening candlestick pattern, is just like the morning star but in opposite. The candlestick pattern is comprise of three candles just like that of the morning star, it's also a strong bearish reversal pattern.
Below is the image of the evening star candlestick.
.jpg)
As early say, the evening candlestick comprises of; the bullish candle which shows buyers are in total control of price,the small Doji candle shows how weak the buyers is and the incapability of the buyers to make sure price go high, and finally,the bearish candle engulfing shows that sellers are in total control of price from the buyers.
Looking at the psychology behind the evening star it shows how buyers are in control of price before sellers then took over from the buyers.
2.Identify these candlestick patterns listed in question one on any cryptocurrency pair chart and explain how price reacted after the formation. (Screenshot your own chart for this exercise)
In indentifying these candlestick patterns listed in question one, I have make make use of different pair on TradingView.
Identification of Bullish Engulfing Candlestick Pattern

From the above chart we can see that the trend is about reverse from the Downtrend to up trend.
Identification of the Doji Candlestick pattern

You can see from the chart above is a chart of Bitcoin/Dollar where I have identify Doji in an uptrend, showing that the market is at equilibrium level that need to rest. It's likely to have higher since it's at the resistance path.
Identification of the Hammer candlestick pattern
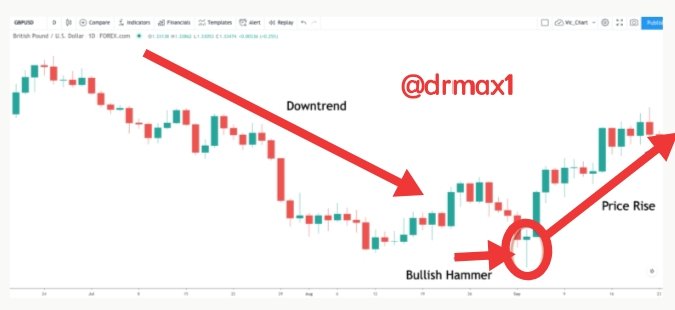
Above is the candlestick chart for the GBP/USD currency pair shown on the daily timeframe. Now from the left side the price chart, you can see that the price action is carving out a downtrend. After the hammer candle finish a price reversal occurs in the market, and the prices began to increase.
Identification of The morning star candlestick pattern

The above is a chart of GPB/USD pair from the above it means a signal for traders that the price will rise up again.
Identification of the evening star candlestick pattern

Price is on the verge of rising up.
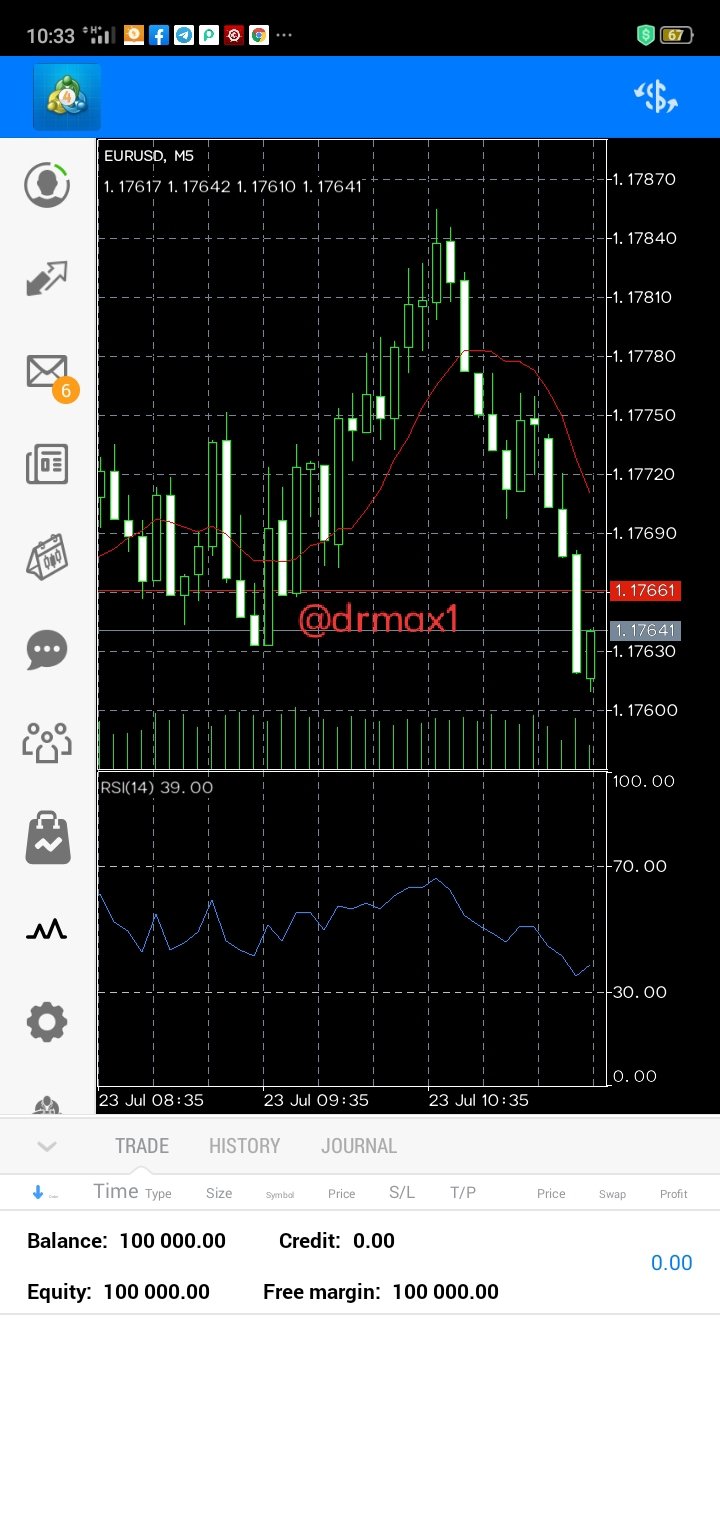
3. Using a demo account, open a trade using any of the Candlestick pattern on any cryptocurrency pair. You can use a lower timeframe for this exercise.(Screenshot your own chart for this exercise).
I open my demo account and use the Candlestick pattern on EUR/USD using M5 as my timeframe. The only thing I do is to place a sell order.