Crypto Academy /S5W1-Homework Post for kouba01
Thank you very much Professor for your wonderful teaching this week. In this my post, I will answer the homework questions asked by you after your class.
Question 1. Discuss your understanding of the ATR indicator and how it is calculated? Give a clear example of calculation
The average true range indicator (ATR indicator) is abbreviated as ATR. The ATR indicator is one of numerous technical analysis indicators used by asset traders (such as stock, commodity, currency, and cryptocurrency traders) to measure price changes. It's a volatility indicator since it shows how much an asset's price has moved over a specific period of time.
John Welles Wilder jr., a well-known mechanical engineer turned market analyst, created the average true range. ATR was first published by Welles Wilder in his 1978 book "New Concepts in Technical Trading Systems."
ATR was developed by John Welles primarily for the commodity market, but it may also be used in other financial markets such as cryptocurrencies, forex, stocks, and so on.
The average true range is essentially a volatility indicator; it does not reflect the market momentum or asset price direction. It expresses an asset's level of volatility in order to assist traders in determining when the price of an asset is about to become more erratic or less irregular.
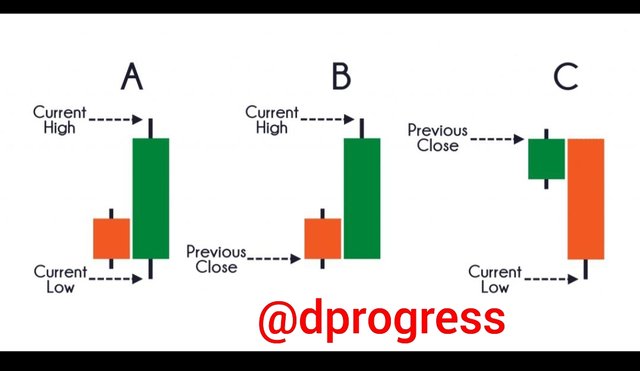
It is essential to understand the true range of the specified timeframe while calculating ATR. The true range can be calculated in three different ways.
- Current high minus the current low
- Current high minus the previous close
- Current low minus the previous close
When the current candle range closes lower than the previous candle, you'll less previous close from current low.
When the current candle’s price is larger than the previous candle price, you'll less current low from current high.
When the current candle closes higher than the previous candle, you'll less previous close from current high.
(The important point is that the longer the candlestick's range, the higher the average true range value; conversely, the smaller the candlestick's range, the lower the average true range value.)
The highest value produced from the above three numbered methods is used to calculate the true range for the timeframe. It barely matters whether the absolute value is positive or negative because it is taken into account. The average true value is calculated from the records for each period, which on most chart platforms is 14 periods by default, but you can use longer or shorter periods as needed. ATR is calculated using the formula: ATR = (Previous ATR * (n - 1) + TR) / n.
If you're using 14 periods, the formula is ; ATR = [(Previous ATR x 13) + Current TR] / 14.
Question 2. What do you think is the best setting of the ATR indicator period?
Short term traders prefer shorter timeframes, which makes the ATR sensitive to all signals and price movement, while long term traders use longer timeframes, which are less sensitive to trading alerts.
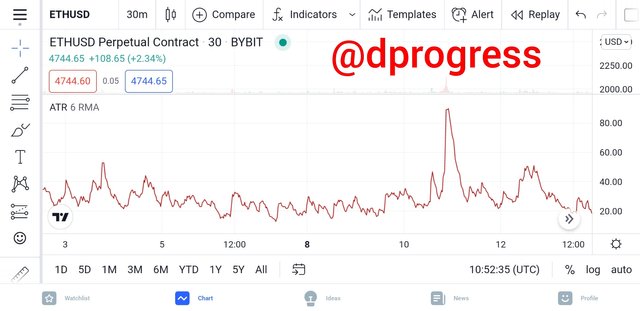
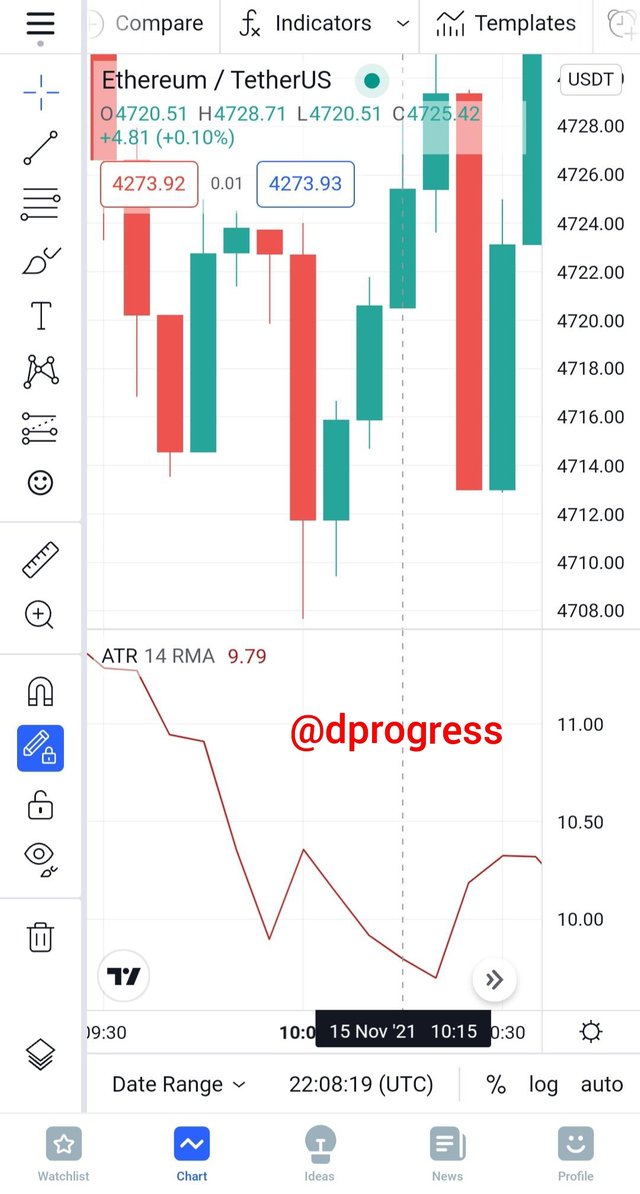
The ATR chart of ETHUSD is shown above. The chart has 6 periods, and the zigzag lines that reflect the level of volatility for each period are easily noticeable. The image below is of the same asset, however it is from a different time period (14). When contrasted to the 6 periods alone, you can observe how the lines are less reactive to price movement.
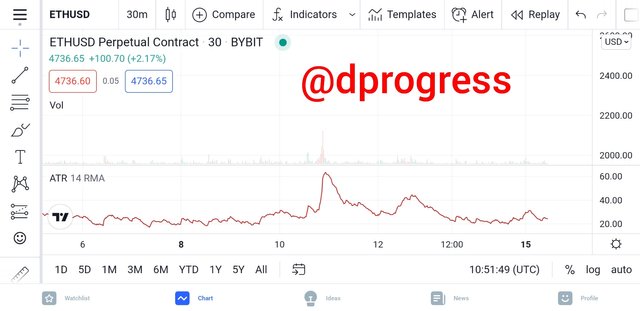
The following image is of the same asset, but this time I chose the 36 period, which is clearly less sensitive to trade alerts than the previous two periods.
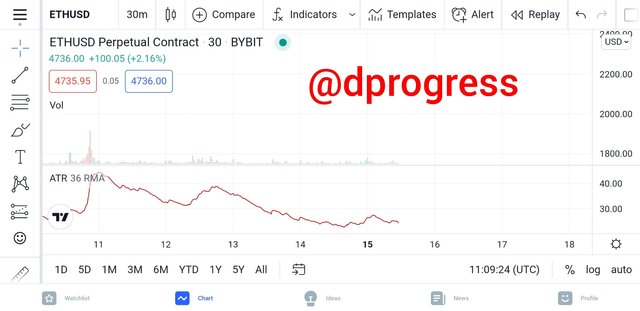
As a result, I believe that the ideal setting is defined by the type of trade you want to make, with short periods for short-term trading and long periods for long-term trading. The 14 period is my favorite.
Question 3. How to read the ATR indicator? And is it better to read it alone or with other tools? If so, show the importance. (Screenshot required)
As I previously stated, the major role of average true range is to measure volatility. Markets fluctuate between periods of high and low volatility, and average true range assists traders in tracking these swings and making trading decisions.
When the ATR line rises, it indicates that the asset's volatility is rising; when the ATR line falls, it indicates that the asset's volatility is reducing. We can see how jagged the ATR line is in the image below; it is nudging higher and drifting lower when the price fluctuates.
It is preferable to use the average true range indicator to examine other indicators in order to get the best trading experience. Combining additional technical indicators assists in the spotting of trading opportunities in the market. There are a variety of indicators that can be combined, including parabolic SAR, stochastic, elliot wave, and keltner channels, pivot points, CCI, among others.
Combining average true range with parabolic SAR would be my main emphasis.
The parabolic stop and reverse, also known as the parabolic SAR, is another key technical indicator for spotting market trends and when they stop and reverse. The parabolas are like continuous dots on the asset chart lines or candles, and they were also designed by John Welles Wilder, Jr.
Traders primarily use it to trade trending markets, and when applied in combination with the average TRUE range, it makes it simple to make trading decisions because you can set conclusive stop loss and take profit price orders, ensuring that you capitalize on a trending market with the least amount of risk possible.
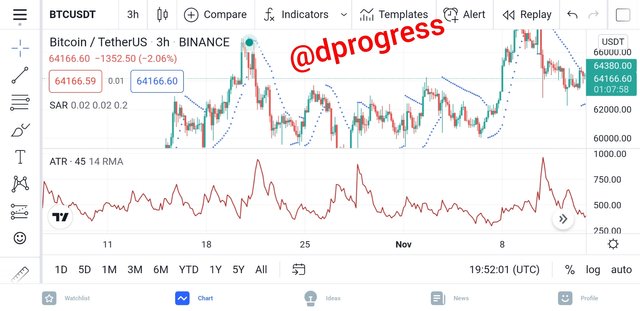
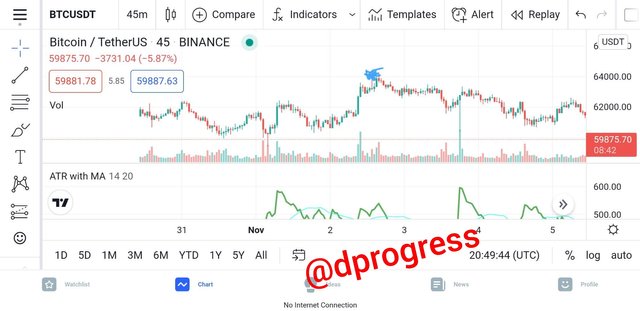
In the image below, for the crypto pair BTCUSDT, I added the parabolic SAR indicator with the ATR indicator to confirm the trend and strength of this crypto pair. The part where the dots break is where the trend stops and another trend sets in. These fluctuations are also reflected on the ATR, so I can calmly sit down to study it further and think about where to take my next course of action.
Question 4. How to know the price volatility and how one can determine the dominant price force using the ATR indicator? (Screenshot required)
The market's volatility is continually shifting; today's low volatility could turn into high volatility tomorrow.
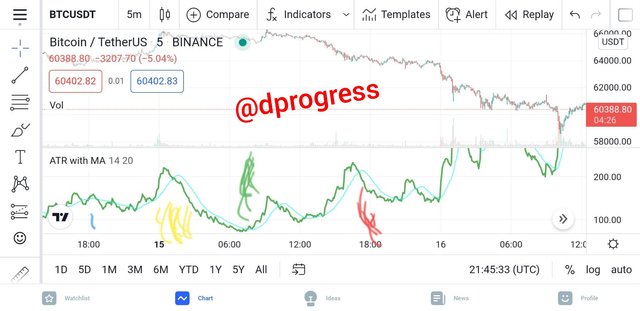
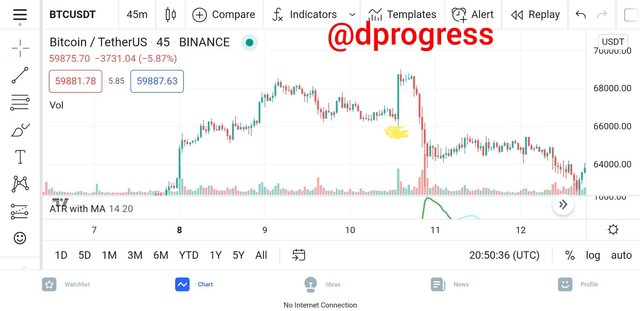
When the line rises higher, it indicates that the market is experiencing high volatility, as seen at the beginning (blue dot) of the BTCUSDT chart image above. When the line is sloping around the high and low, it indicates that the market is experiencing low volatility. Later on (the yellow part), when the line rose higher, the volatility increased, signaling the start of a trend reversal, as the market direction had previously been bullish but had quickly shifted to bearish. The volatility remained high at the (red part), and the market trend remained bullish; this clearly demonstrates that the ATR indicator does not move with the market trend, as it rarely reflects market direction.
Question 5. How to use the ATR indicator to manage trading risk ?(screenshot required)
We all know there are risks associated when trading cryptocurrency or other financial assets; the market may not move as expected at times, and you must act swiftly to avoid losing all of your money. To reduce this risk, some brokers offer limit orders, which allow you to place a stop loss order, a take profit order, a buy order, or a sell order. Using these orders can be difficult because you need technical analysis to know where to place your orders. However, by using the average true range indicator, you can effectively know where to place your stop loss and take profit orders, allowing you to better manage your risk.
When you place a stop-loss order, you're telling your broker how much you're willing to risk with your transaction.
For example, if BTC is now trading at $100 and I believe it will rise to $200 in the near future, I can ask my broker to close my transaction if BTC falls to $80. It means that I'm only willing to lose $20.
When you place a take profit order, you're telling your broker how much profit you're willing to make on a single trade. In the same way that I set my stop loss at $80, I may set my take profit at $180, indicating that I'm only interested in making $80.
It is preferable to combine the average true range indication with other indicators to get the most out of it. The moving average is one of my favorite indicators.
When I see the ATR line above the 20 EMA, I assume asset volatility is about to surge and a new trend is about to emerge. Here's an example:
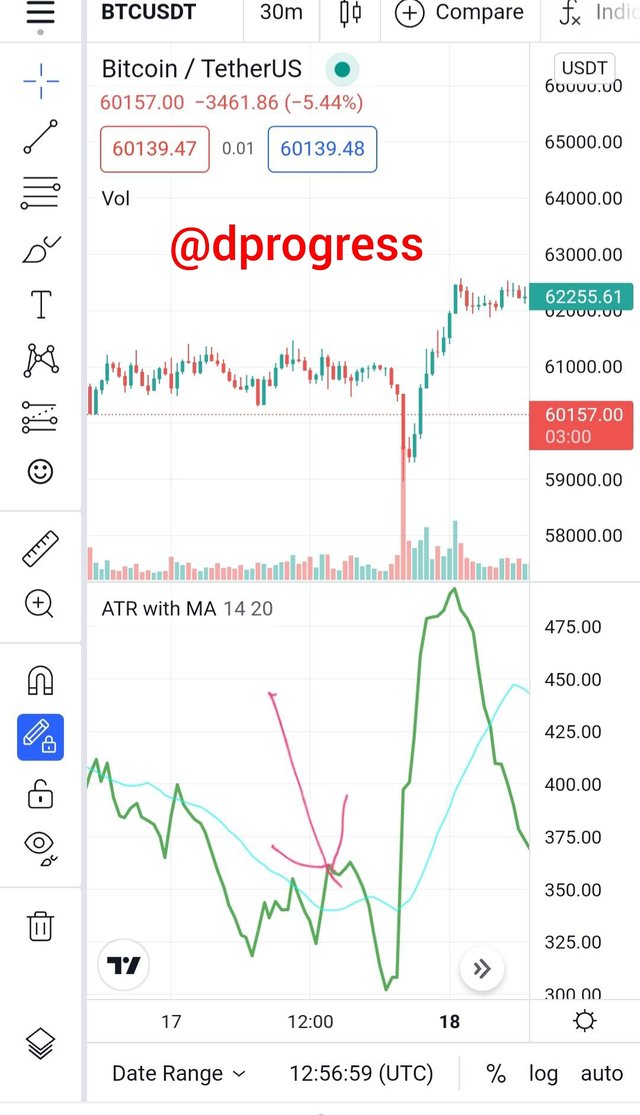
Next, I prepare to enter a trade by looking for a price breakout, which should include the appearance of a large bullish candlestick, indicating that the market is ready to surge upward. After that, I open a long position and set a profit target. My take profit is placed at the same level as my ATR indicator, but you can raise it if you like.
The next step is to set my stop loss. I set my stop loss just below the candlestick low of the breakout to limit my losses if things don't go as planned.
Question 6. How does this indicator allow us to highlight the strength of a trend and identify any signs of change in the trend itself? (Screenshot required)
According to my research, I don't believe the indicator can be used to assess the strength of a trend; instead, it merely represents volatility. It can be used to determine trend strength when paired with other indicators.
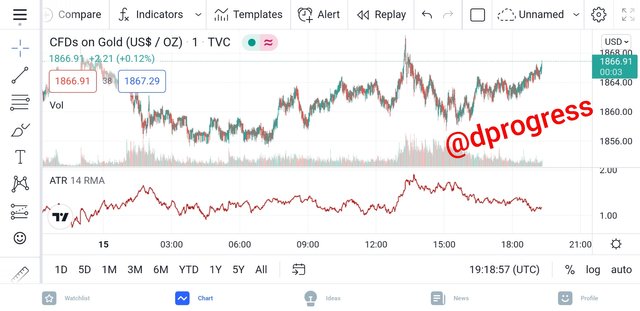
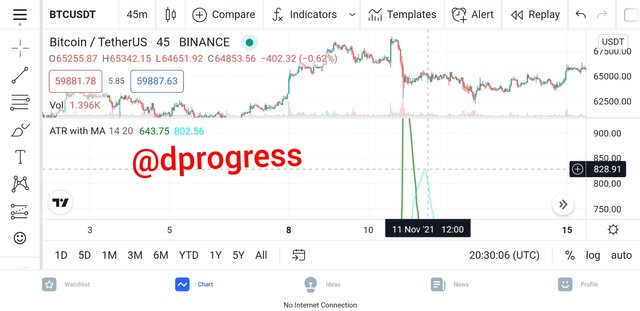
When a trend reversals happens, the ATR line develops a peak, which I believe can be utilized to identify trend reversals. The graphic below shows the cryptocurrency pair ETHUSDT as an example.
Question 7. List the advantages and disadvantages of this indicator:
There are numerous benefits to using the ATR indicator
- It works well and adapts to all market trends conditions, so you can use it effectively whether the market is bullish or bearish.
- The indicator identifies an asset market's cycle turn by detecting price movement that consistently returns to the average.
- It is one of the most effective indicators for predicting market volatility; it can be used to detect both high and low volatility markets, which is why traders use it.
Despite the numerous advantages this indicator provides, there are some drawbacks associated with its use, which are
- Average true range does not really talk about market direction.
- It only provides information about price volatility, not the asset's bullish or bearish trend.
- The ATR indicator is not sufficient to make trading decisions; other indicators are required to confirm market movements.
Conclusion
The ATR indicator is a crucial indicator. When used correctly, it can help you increase your profits while lowering your losses. The most common misunderstanding about the ATR indicator is that traders assume that a rising ATR value indicates a bullish trend and a lower ATR value indicates a bearish trend. This is incorrect and inaccurate. To get the greatest results, it's recommended to utilize this indicator in conjunction with others.
Hello @dprogress,
Thank you for participating in the 1st Week Crypto Course in its 5th season and for your efforts to complete the suggested tasks, you deserve a Total|5.5/10 rating, according to the following scale:
My review :
An Average post in which your answers lack depth of analysis and variety in the examples used.
A brief definition of the ATR indicator followed by a calculation of its value, it was possible to rely on a graph to confirm the results obtained in calculating the value of the indicator at the instant t.
It would have been possible to go in more depth to explain the difference between an increase or decrease in the value of a period and to have clearly stated your personal choice.
A superficial answer to the fourth question, you did not deepen your analyzes. The same is true for how to manage trading risk, highlighting the strength of a trend and identifing any signs of change.
Thanks again for your effort, and we look forward to reading your next work.
Sincerely,@kouba01