Repost of Bitcoin's Trajectory - Crypto Academy S4W7 - Homework Post for @imagen because it wasn't upvoted
There are two major things that are considered when it comes to entering the financial market or considering going into the financial market, they are both needed yet they are of different directions. All those who wish to trade or invest in the market uses both of this principle to predict the future price of an asset with both having it's usefulness and limitations.
What are the differences between Fundamental Analysis and Technical Analysis? Which one is used most often?
These principles are called the Fundamental or Technical analysis, they give a better prediction when used together.

FUNDAMENTAL ANALYSIS
The fundamental is one of the principles used to analyze the market, it is basically the study of all the available informations of the asset or stock market to determine the value of the possible future value of the asset and also to look at past value and the recent value to get a good entry of the asset.
Anyone carrying out a fundamental analysis looks at everything possible from the economy, to the company financial strength and management, the earnings, expenses, assets etc.
In the aspect of crypto, it might be a little different as the informations looked at are quite different and presently there a rw numerous types of crypto assets that has been launched with each having it's own uniqueness and alot of technicalities which can be overwhelming to investors especially those that are just starting up, which makes alot of them confuse about knowing which one to invest in.
Alot of people are always asking which coin is the best to ape into or how do we determine a good project, how do we know if it is going to do excellent, all this questions can be answer by a fundamental analyst.
In crypto this principles uses both internal and external factors to determine the value of a cryptocurrency by comparing it's current value with previous one and checking if it's currently undervalued or overvalued. If the price is currently undervalued which means it's price is way below it's real price then an investor can invest in the project in aim of profit.
The informations that are looked into in fundamental analysis can be categories into 3 aspects which are the
Project Analysis:
this focuses on the use case of the token, under which section does it fall either a gamefi, defi project etc. This also help us know it's advantage over other project in the same section, also looking into the whitepaper of the team and also the team itself if they are strong enough.
Financial Metrics Analysis:
this is the evaluation of quantitative metrics, here the liquidity, circukationg supply, total supply, market cap, circulating supply and the trading volume of the asset is considered and looked into.
On chain metric:
this analysis the blockchain, in that it looks at the activity in the blockchain by checking the number of holders, the trànsactions carried out, last time transaction was carried out and so on.
TECHNICAL ANALYSIS
Technical analysis which is acronym is TA is a variety of tools used together to check and know the future price of an asset. It makes use of the price movement, trend, price and volume of an asset to know the next movement of the asset, basically it makes use of chart to predict the price of an aseet.
In a more explanatory way it is a tool that used to study the price pattern of an asset, which alot of traders and investors use to predict the future price of the asset and also reduce the risk involved in trading. It is basically the analysing of the past price history of an asset in order to know the next movement of the price.
Even with the high volatility of cryptocurrency one can still analyse the market with the use of TA to know when to enter it exit the trade.
The technical analysis tools varies from moving average, to price actions, to volume and so many more indicators been used to aanalyse the market.
DIFFERENCES BETWEEN TECHNICAL ANALYSIS AND FUNDAMENTAL ANALYSIS
- Fundamental analysis according to definition is the determination of intrinsic value of an asset while technical analysis is the use of an asset chart to determine the future price of an asset by identifying pattern and trend on the chart.
- Fundamental analysis is mostly used by long term investors and it's more efficient for long term investments while technical analysis is used by short term investors and for short term investments
- Fundamental analysis is majorly for investment while technical analysis is used for trading majorly.
- Technical analysis is used to know when to enter or exit a trade while fundamental analysis is used to get intrinsic value.
- Fundamental analysis decisions are based on information provided while technical analysis is based on the market trend and price pattern
- Technical analysis uses past data for analysing while fundamental analysis uses both past and present data.
- Fundamental analysis is basically news, events and details about the project while technical analysis is basically chatting.
Choose one of the following crypto assets and perform a Fundamental Analysis indicating the objective of the Project, Financial Metrics and On-Chain Metrics.
Cardano (ADA)
Solana (SOL)
Earth (MOON)
Chiliz (CHZ)
Polkadot (DOT)
CARDANO (ADA)
We will be doing a fundamental analysis on the project Cardano, we will be looking at the objective of the project, financial metrics and on chain metrics.
CARDANO is a blockchain project that is designed for changemakers, innovative and visionary people with technology and tools that is needed to create possibility for alot of people and bring about a chnage globally. It is a platform designed to help secure the data of billions of people around the world.
FINANCIAL METRIC
CARDANO has a native token which is called ADA it's current price as at the time of writing is $2.10 with a market capitalization of $69,194,780,373. It is ranked #4 in the coinmarketcap ranking and has a trading volume of $2,915,768,398.
ADA has a circulating supply of 32,899,071,908 ADA and a Max supply of 45,000,000,000 ADA. ADA has seen rise swiftly since it's launch in 2017 and has a dominance of 2.75%, it has an all time.low of $0.01735 as at October 2017 and has an all time.high of $3.10 as at Sept. 2021. Other details can be found in the screenshot below.
.


ON CHAIN METRIC
The on chain metrics of the coin was gotten from the explorer which is explorer.cardano.org where we were able to see the transactions carried out per epoch, the amount of transaction done and the amount of ADA and blocks that was created during the epoch.

According to the explorer the coin is on the 297 Epoch which hasn't been completed yet, in the last epoch 296 a total of 20848 blocks was created during that particular epoch. Let us expand the latest epoch and see the details it has in it.

In this new epoch 8267 blocks only has been created so far and the time at which it started was written also the amount of transactions done was also indicated with some other details. This on chain metric shows that the token is widely used by alot of people with the number of ADA that is been used in the blocks.
Make a purchase from your verified account of at least 10 USD of the currency selected in the previous point. Describe the process. (Show Screenshots
HOW TO BUY ADA
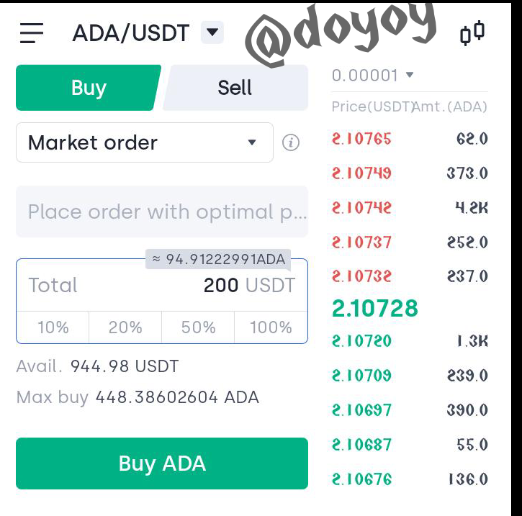
To buy the ADA token it can be bought on various exchanges both decentralized and a centralized exchange, for this lesson I will be using the Okex platform to buy the token. First we launch the app and navigate to the trade section then we choose the Ada token and input the amount of token we wish to buy.
I will be buying with the market price, after inputting the amount we click buy and then confirm the trànsaction.

Apply Fibonacci retracements to the previously selected asset with a 4 hour time frame on the platform of your choice. Observe the evolution of the price at 24 and 48 hours, did it go up or down in value? Look to identify resistance and support levels. (Show Screenshots at 0, 24 and 48 hours of purchase where the date and time are observed).
USING FIBONNACI TO CHECK FOR PRICE EVOLUTION
The fibonnaci is a technical analysis tool that we have discussed about in some of our previous lessons, so I won't be going much into what it is. We will be using the tool to get the evolution of the price of the asset we bought which is ADA checking the movement from 0 to 24 hours to 48 hours using the 4 hours time frame.

The screenshot above is the begining of the study which will makry the 0 hour. From the screenshot above we find out that the price of the asset is currently approaching the support level of the market and it's tend to be on the 0 line of the fibonnaci signifying the support area. Note that the upper yellow.line signifies resistance.

At the end of the 24 hours we can see a reversal in the price of the asset from the support level moving towards the resistance level. The price has gone up which means there is profit for my trade after 24 hours.

Finally after 48 hour we saw a rise of the price towards the resistance which it broke but reversed immediately and now the price of the asset is going down towards the support line again. If it wasn't for the lesson the best time to have taken profit as a trader is when the price has hit the resistance and broken it and when we saw an imminent reversal of the price. The price if the asset went up after 24 hours and came down back after 48 hours.
What are Bollinger Bands? How do they apply to Crypto Technical Analysis? With which other tool or indicator do you combine Bollinger Bands to analyze a Crypto? Justify your answer.
BOLLINGER BAND
Bollinger band is another technical analysis tool that is created by John Bollinger which is used to isn't overbought and oversold region. It consists of 3 lines which the middle line is the simple moving average and it has upper and lower line that constrict and expand depending on the volume of the market.
The upper and lower lines are 2 standard deviations from a simple moving average.wheneveer the candlestick touches and crosses the upper band it means an overbought region and when the price touches and crosses the lower it means and over sold region.

The other indicator that can be used with this tool is the RSI which also indicates the overbought and oversold region of an asset.
Hello professor @imagen, my post was not verified and it expires. This is the link to the previous post that was not verified
https://steemit.com/hive-108451/@doyoy/introduction-to-the-principles-of-crypto-analysis-crypto-academy-s4w7-homework-post-for-imagen
Now I have reposted it.
Please professor my post have not yet been verified
@imagen
@imagen
@imagen
This is the new post I posted concerning that
https://steemit.com/hive-108451/@doyoy/repost-of-bitcoin-s-trajectory-crypto-academy-s4w7-homework-post-for-imagen-because-it-wasn-t-upvoted
Gracias por participar en la Cuarta Temporada de la Steemit Crypto Academy y mis sinceras disculpas por las molestias ocasionadas.
Continua esforzandote, espero seguir corrigiendo tus asignaciones.