Crypto Academy / Season 3 / Week 1 - Ichimoku-kinko-hyo Indicator - Part 1. Homework Post for [@kouba01]
CRYPTO TRADING WITH ICHIMOKU
What is the Ichimoku Kinko Hyo indicator? What are the different lines that make it up?
Created by Goichi Hosoda, a journalist specializing in stock issues, the main idea was to create an indicator that could interpret the structure of the market and its main trend at a glance.
Its full name is Ichimoku which means glance, kinko which means balance and Hyo which means bar graph, Ichimoku Kinko Hyo.
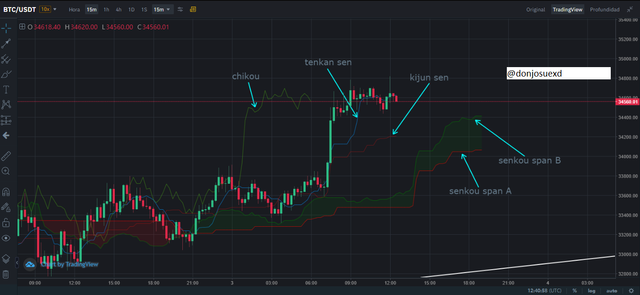
The Ichimoku is composed of 5 elements and they are generally plotted on Japanese candles, and are broken down below:
First we have the Tenkan-Sen (return line) is the midpoint between the maximum and minimum of 9 periods, then we have the Kijun-Sen, this takes the midpoint of the last 26 periods, a moving average slower than previous.
Then we have Senkou Span A and Senkou Span B (it becomes the cloud): Span A is an intermediate point between the tenkan and the kijun and is shifted 26 periods forward. span B is the price, average of the last 52 days,
and finally we have the Chikou which is the linear graph of the price but behind 26 periods.
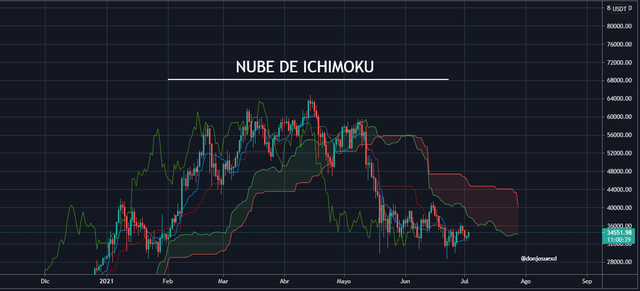
Here in the graph we can see the different lines and moving averages that compose it.
How to add the Ichimoku indicator to the chart? What are its default settings? And should it be changed or not?
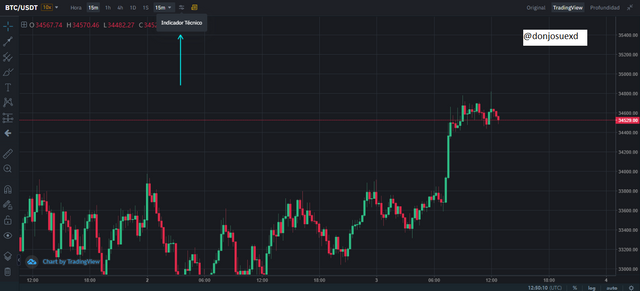
Here we have a simple chart of Japanese candles without any type of indicators, here I am managing within the Binance exchange, what we have to do next is click on the button where it indicates the date on the chart, here we will be able to find all the indicators available.
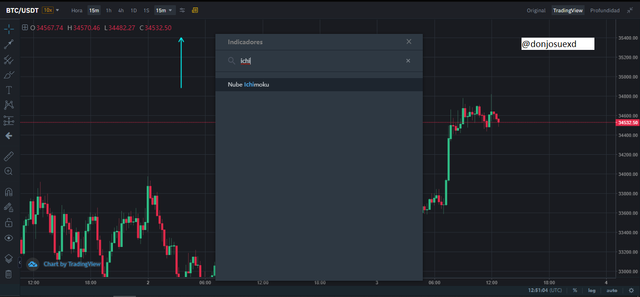
Once we click on it, this window will appear where we can write the name of the indicator we are looking for, we only have to put ichimoku and the option to put it on the graph will appear.
Here we can also see the parameters that we mentioned above and this can also help us to identify the elements by color.
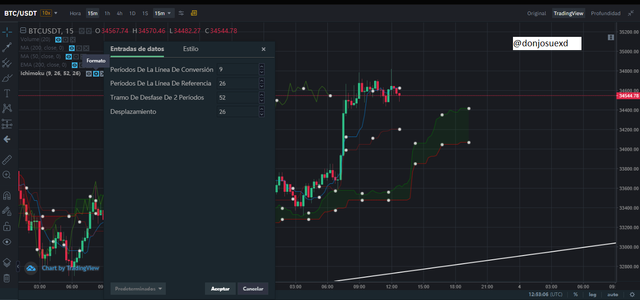
These parameters should not be changed since they have already gone through a long testing and functional process as they are predefined.
How to use the Tenkan Sen line? How to use the Kijun Sen line? And How to use them simultaneously?
when the price touches the tenkan (which is a fast average), there the price is likely to make a small stop.
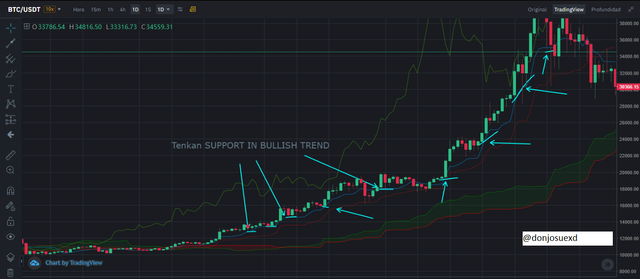
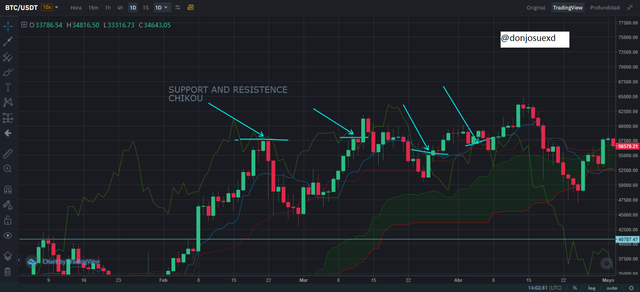
This is the BITCOIN chart in 1D frame, the beginning of an uptrend, look at how the price each time it touches the tenkan, stops and uses it as support, this gives us an idea of where the price is going to stop before following its trend. , is very useful to define support and resistance zones.
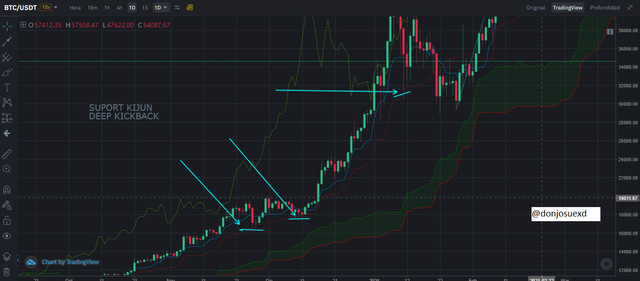
The kijun also serves as an important stop zone, but it corresponds to deeper setbacks, it is like a second line of defense of the price, it is a support of greater strength than the tenkan.
When the Tenkan line intersects the Kijun line, it indicates a change in the direction of prices and therefore there is a close relationship between them.
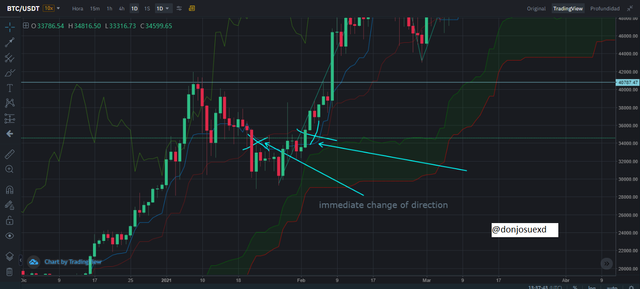
In this graph we can see the immediate change of direction when crossing the lines, only in this case it did not affect the macro bullish direction, and days later they crossed again to resume the bullish direction.
What is the chikou span line? And how to use it? And Why is it often neglected?
The chikou is the price chart traced in lines on the closing and retracted 16 periods, this is used in the following way, when the chokou meets the price when going up or down it will find a support or resistance since it will be touching the price level that was 26 periods ago, also if the chikou touches the tenkan, the kijun or the cloud it will also act as support or resistance as we can see in the following image, we can also use it to detect hidden support or resistance areas which helps us to take profit or put a stop loss, this is usually ignored because it is the most difficult part to understand.
What's the best time frame to use Ichimoku? And what is the best indicator to use with it? (screenshots required)
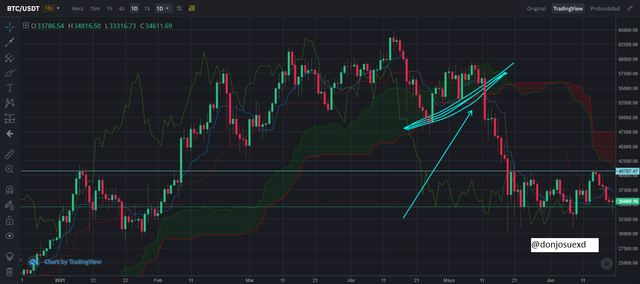
To have a clear view of the direction of the market at 1 day is a very good time, because it is an overview that can be used for trend movements from weeks to months.
Let us observe that when the price of Bitcoin crossed the Span Line zone, it corresponds to the change of direction in the price and the end of the upward movement, turned downward, let us also see how the span line lines were crossed.
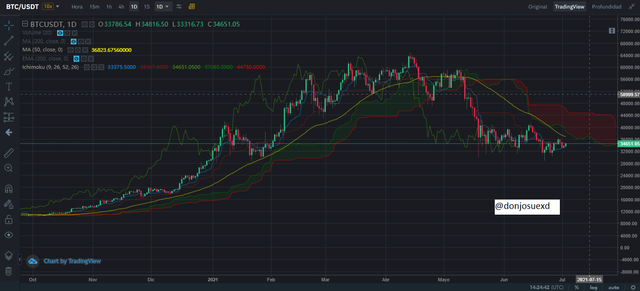
I have no experience using the ichimuko to say which indicator works better but looking a little and analyzing, the 50-period moving average is doing very well, it is an important resistance and acts as a midpoint between the cloud and tenkan-kijun as we can see in the following graph.
Conclusion :
The Ichimoku is a very important indicator for technical analysis, and requires a lot of study to understand all its complexity, but it is worth it, it fully fulfills the function for which it was created, when the price is above the cloud the market is considered to be bullish and when the price is below the cloud the market is considered to be bearish. We can quickly see the direction of the market and it allows us many strategy modes, let us also remember that before using any strategy in real life, we must first test it many times, before taking any risk, ichimoku works better in trend since if the market is too flat, ichimoku will bring us little value.

Hello @donjosuexd,
Thank you for participating in the 1st Week Crypto Course in its third season and for your efforts to complete the suggested tasks, you deserve a 2/10 rating, according to the following scale:
My review :
An article with substandard content in which you were unable to answer the questions correctly. There is also a complete absence of analysis of the ideas presented, which is evidence that you did not understand well what was required of you. I invite you to follow the summary tomorrow, I will put in it a reform of the most important questions raised.
Thanks again for your effort, and we look forward to reading your next work.
Sincerely,@kouba01