Steemit Crypto academy// Season 3 week 8// Homework Post for (@asaj)
QUESTION 1
In your own words define the random index and explain how it is calculated
The Random Index Indicator and how it is calculated
In bid to define the KDJ indicator, it is a technical indicator which is used by traders in analysing and predicting trend change in various assets. The KDJ indicator is known to be derived from the Stochastic indicator; and with this derivative it has a little difference from that of the stochastic by addition of an extra line call the J line.
In simple terms, the random index indicator is a technical tool used to compare a security price movement to random movements. This is to determine if the prices of an asset of an asset is in a significant trend.
Also, we can use the random index to generate trade signals, and this trade signals are based on the strength of the underlying price of the trend.
In using the indicator, we see that the values of the percentage of the k and the d lines tell us if a particular asset is overbought or oversold. A value above 80 indicates an overbought and a value below 20 indicates an oversold. The J line then represents the divergence of thee %D from the %K
Calculations
Calculating the Random Indicator, we need to begin by calculating the RSV value of the periods which will be in n days, weeks or months etc
n-day RSV = (closing price on n’th day – lowest price in n days) / (highway price in n days – lowest price in n days)
calculating the K and D values
K value of the day = 2/3 x K value of the previous day + 1/3 x RSV of the day
D Value of the day = 2/3 x K value of the previous day + 1 / 3 x K value of the day
When we have no k and d values of the previous day, we can use 50.
calculating the J value
J value = 3 x K value of the day – 2 x D value of the day.
In practical example, lets take the KD line as 9 days period
9 – day RSV = (c – l9) x (h9 – l9) x 100
K = 2/3 x day 8K + 1/3 day 9 RSV
D = 2/3 x day 8D + 1/3 x day 9K
J = 3 x day 9K – 2 x day 9D.
As Required.

QUESTION 2
Is the random index reliable? Explain
Reliability of the KDJ indicator
Talking about the reliability of the KDJ indicator I will be illustrating with some examples in some past charts on how effective the KDJ could be when properly analysed.
The KDJ indicator actually shows us overbought and oversold regions as well as shows signals when we have the convergence of its lines.
When the lines are above the 80% level, it indicates an overbought which means this is a sell signal and when the lines crosses the 20% level, it indicates an oversold, and with this oversold indications we are supposed to enter a buy order.
The KDj indicator also shows us the current trend of the prices of a particular asset. This is done by the J line rallying above the K and D lines which is an uptrend and below is a downtrend.
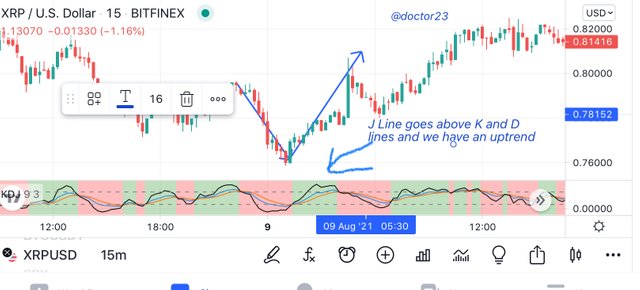
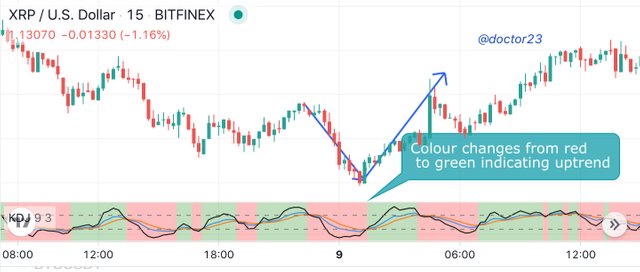
Also we also note that, when we have a green background in the indicator section it indicates an uptrend and when we have a red background itt indicates a downtrend.

QUESTION 3
How is the random index added to a chart and are the recommended parameters
Adding the KDJ Indicator to a chart
I will be illustrating the addition of the KDJ indicator to a chart using the trading platform and we can achive this in thee following steps;
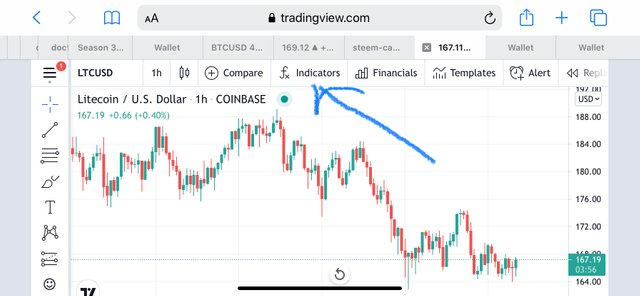
Step 1
We log into the trading view platform and click on the indicator tab
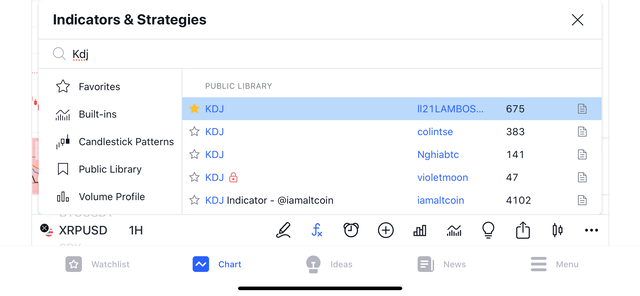
Step 2
We then continue by searching and clicking on the KDJ indicator
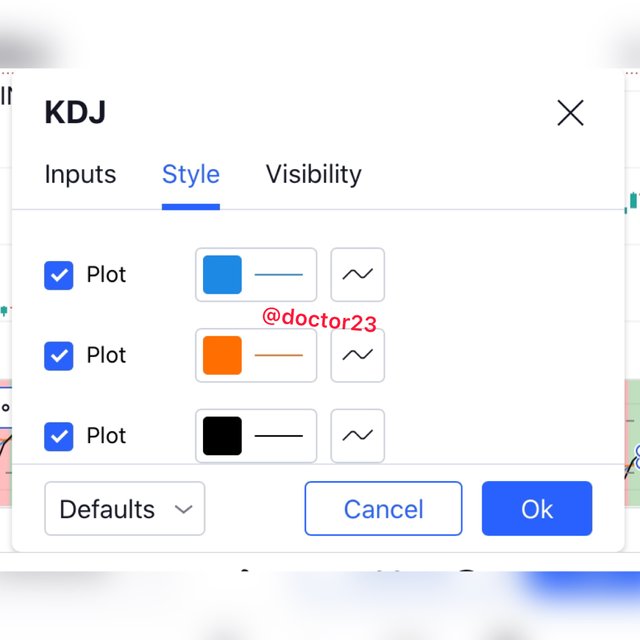
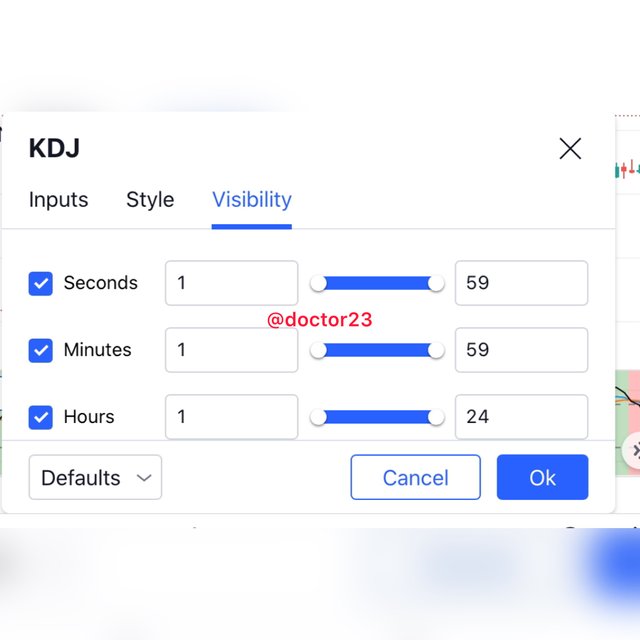
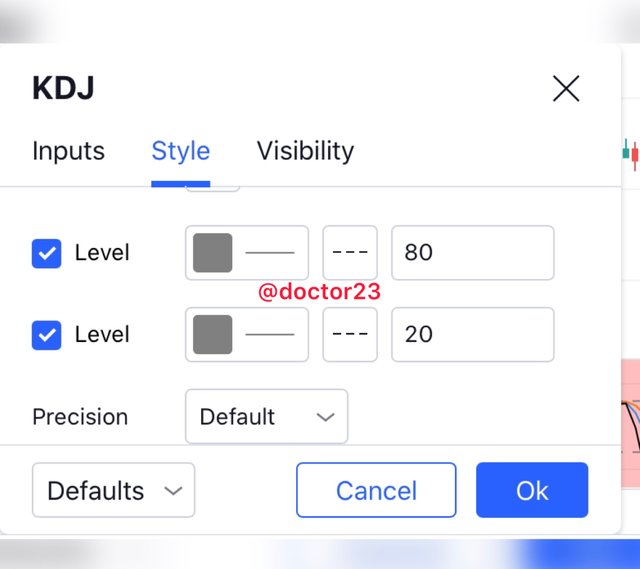
Default Settings of the KDJ Indicator
I think the default settings is the best setup of the KDJ indicator with lower and upper bands at 20 and 80 respectfully.

QUESTION 4
Differentiate between KDJ, ADX, ATR
The difference between the KDJ, ADX and the ATR
Listing out the differences of the 3 indicators, we see them as below;
- The KDJ indicator has 3 lines which are the K, the D and the J lines which is used to determine when an asset is overbought or oversold by determining oversold and overbought positions in the 80 and 20 levels, meanwhile the ADX and the ATR has just a single line each
- The KDJ line determines if an asset is overbought or oversold whereas the ADX uses its values to measure the strength and the ATR measures market volatility.
- The KDJ indicates trend by showing dead and golden fork signals, the ADX uses adx vales to show trend, and the ATR determines the market according to the highest and lowest prices values
- The KDJ indicates price direction, while the ADX and ATR does not indicates the price direction
- We can use the KDJ with indicators such as the ADX and the ATR . Meanwhile for the ADX and ATR we can use it with moving averages.

QUESTION 5
Use the signals of the random index to buy and sell any two cryptocurrencies.
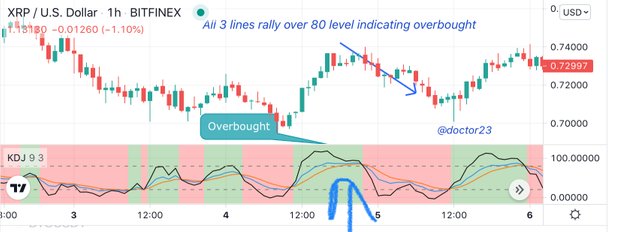
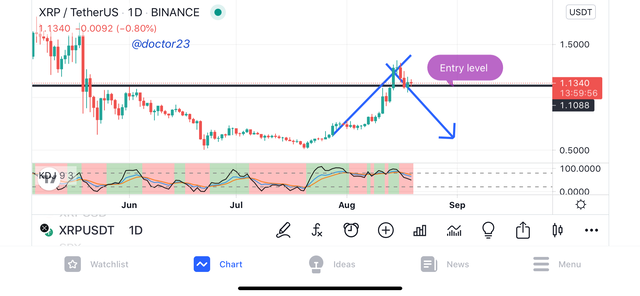
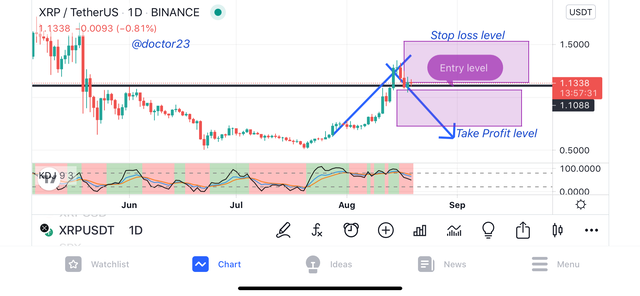
Using the Random Index to Buy the xrp/usd
I need to indentify my trade entry and exit criteria before embarking on the trade.
Trade Entry
There are about 3 ways to get a signal from the KDJ indicator as mentioned above, I will be using the first 2 to spot an entry
- I begin by watching the current trend of the xrp/usd pair. And as soon as the background turns red I noticed there have been a change of trend
- I then confirmed this with the formation in which the J line rallies below the K and the D lines
- I then finalise the confirmation with lines crossing the 80% level.
- With all these confirmations, I can savely enter my SELL ORDER
Trade Exit
Trade exit is about setting suitable stop loss and take profit points
- I will be setting my stop loss some 20 pips from the trade entry
- I will then use the stop loss level to calculate the take profit by using a risk to reward ratio of 1:1
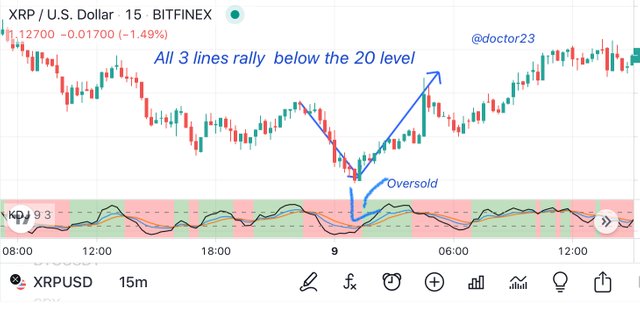
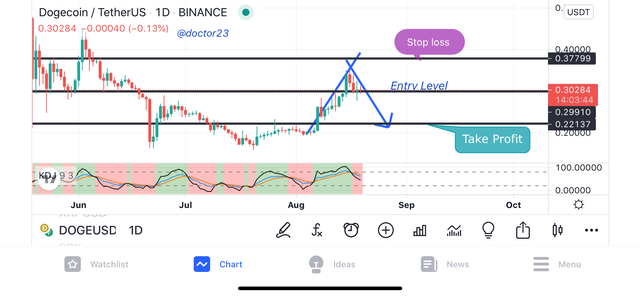
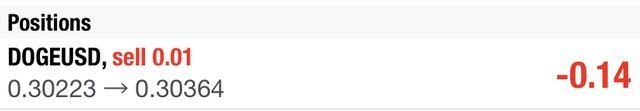
Using the Random Index to SELL the doge/usd
Trade Entry
There are about 3 ways to get a signal from the KDJ indicator as mentioned above, I will be using the first 2 to spot an entry
- I begin by watching the current trend of the doge/usd pair. And as soon as the background turns red I noticed there have been a change of trend
- I then confirmed this with the formation in which the J line rallies below the K and the D lines
- I then finalise the confirmation with lines crossing the 80% level.
- With all these confirmations, I can savely enter my BUY ORDER
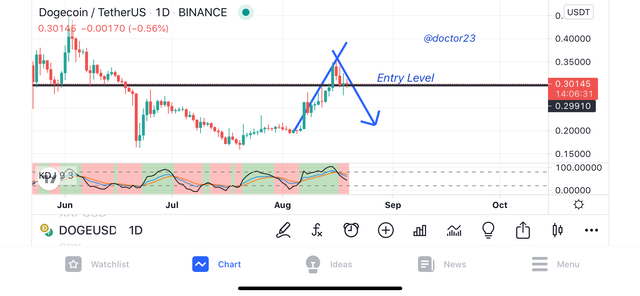
Trade Exit
Trade exit is about setting suitable stop loss and take profit points
- I will be setting my stop loss some 20 pips from the trade entry
- I will then use the stop loss level to calculate the take profit by using a risk to reward ratio of 1:1
Conclusion
It has been seen particular that we can use the KDJ indicator which is also know as the random index indicator in finding suitable overbought and oversold regions for sell and buy entries respectively. Also, we see that the KDJ is a modification of the stochastic indicator with the addition of the J line which can be use in spotting signals when it crosses the K and D lines.
Superb performance @doctor23!
Thanks for performing the above task in the eighth week of Steemit Crypto Academy Season 3. The time and effort put into this work is appreciated. Hence, you have scored 9 out of 10. Here are the details:
Remarks
You have displayed a good understanding of the topic. You have completed the assigned task. Your have performed the tasks in a commendable fashion.