Steemit Crypto Academy // Season 3 week 6 // Homework Post for [@yousafharoonkhan]
QUESTION 1
Define the trading view site, and how to register an account in trading view? What are the different registration plan?
Trading View
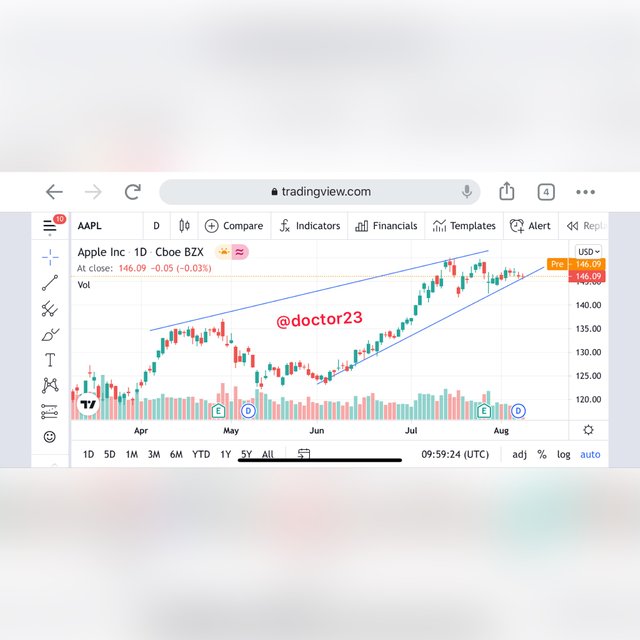
The trading view site is a platform that provides detailed informations on the past and present market. With the trading view platform, we have the opportunity to use its features to analyse future trends of the market.
With the trading view platform, we have the possibility to trade cryptocurrencies, indices, stocks, forex, gold, and others. To properly trade this assets, which means to properly know the future trend of any of the asset, the platform offers us the opportunity to use indicators which are both built in and as well as can be added to the platform. We also have the use of various tools such as trend lines, support and resistance lines, and many others.
Registration of an account in trading view.
To register an account in trading view, we follow the following procedure.
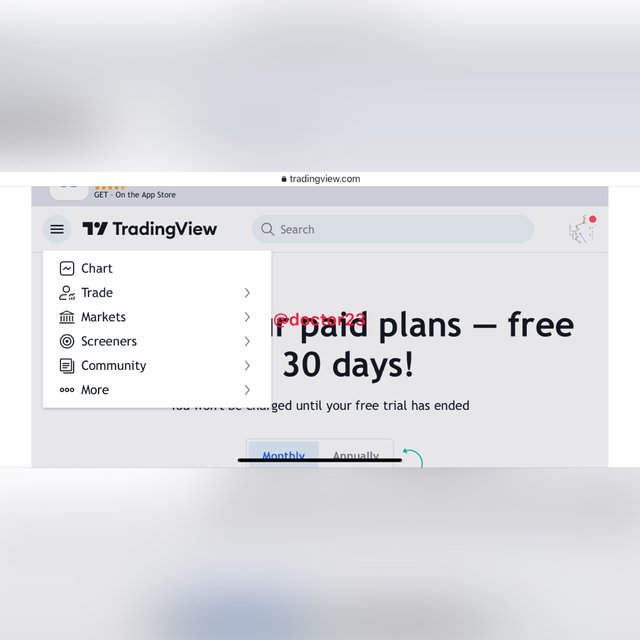
Step 1
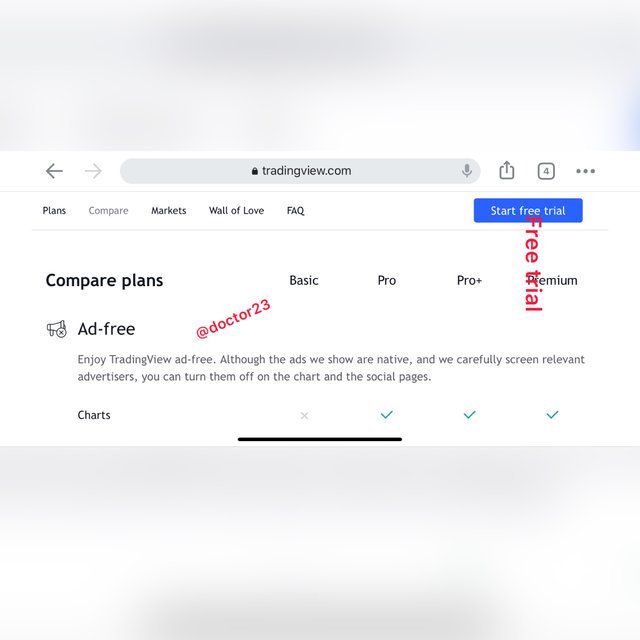
We log in to tradingview.com website; which I have log in click and click on start free trial.
Step 2
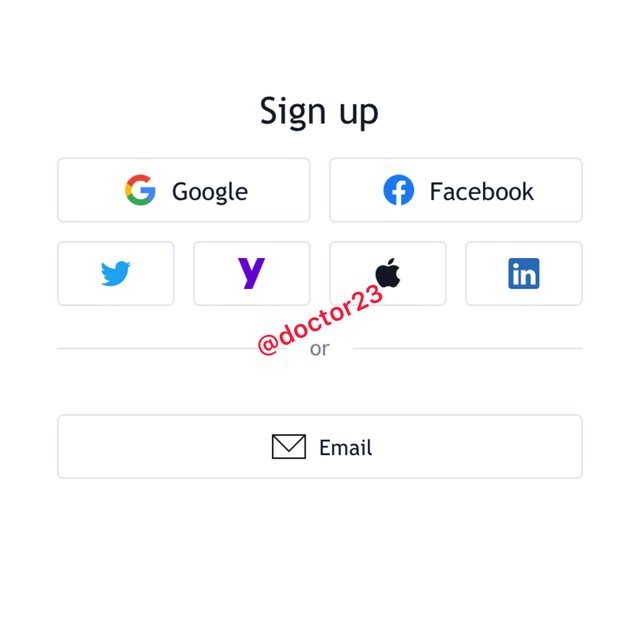
I then click on Google to verify verify my email. Since i am using a face verification on my iPhone, everything is done automatically.
Step 3
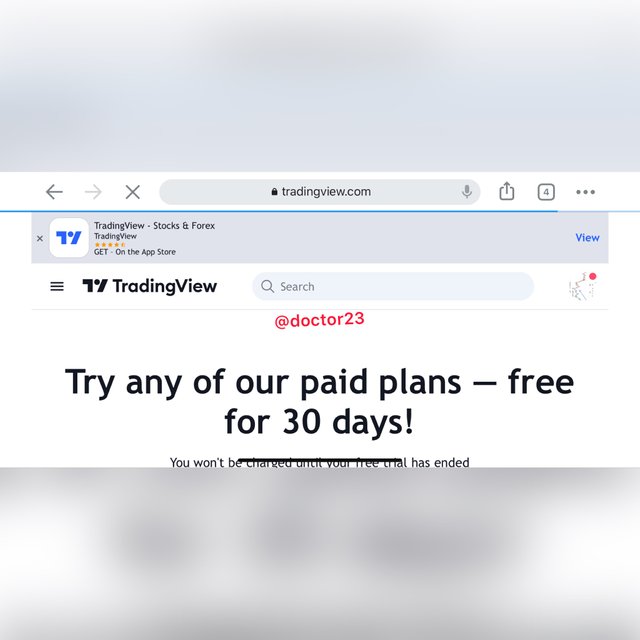
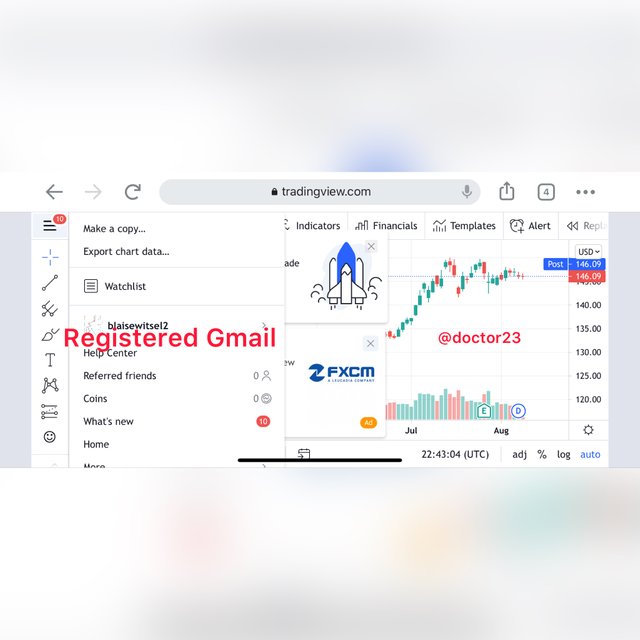
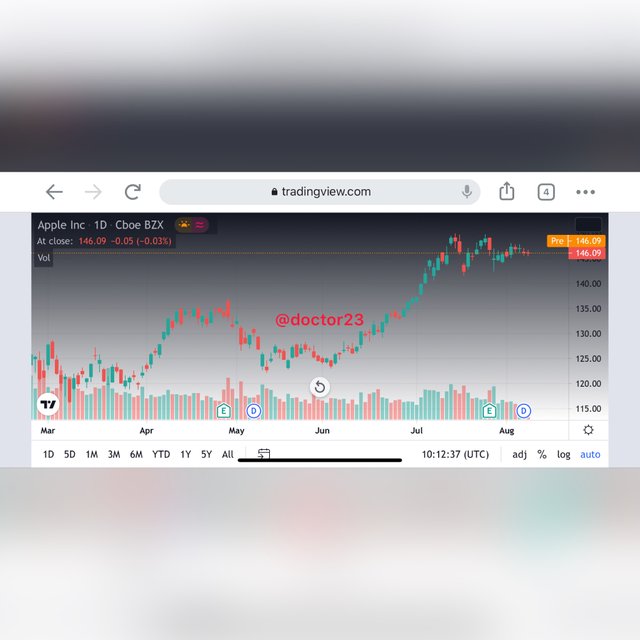
As shown below I am done with the verification and that is the landing page.
The different registration plan.
We have 4 different registration plans in the trading view platform which include
- the free basic plan
- the pro plan
- the pro+ plan
- the premium plan
Now explaining the different registration plan in details,
Free Basic Plan
The free basic plan is particular useful for new users in trading platform so as they can see what the trading view platform is about. Well, when compared with the other plans, it has limited exposures as we will be seeing with the other platform.
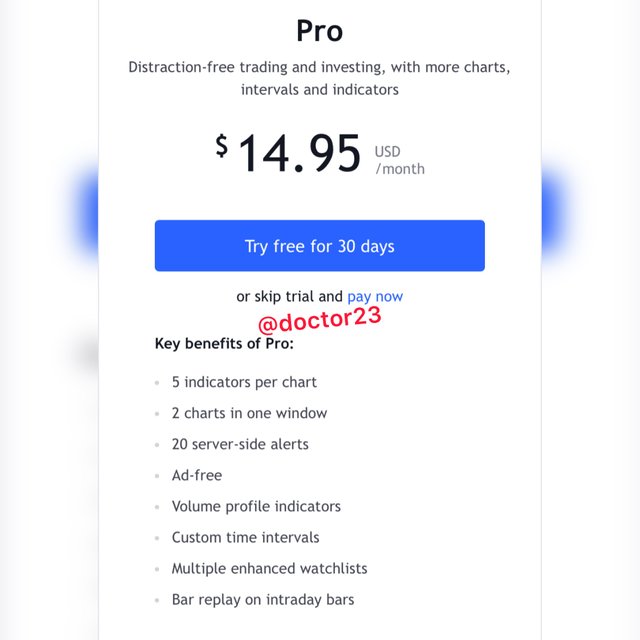
Pro Plan
The pro plan has more benefits than the free basic plan, this involves subscribe to the plan on monthly or annual basis. The pro plan has a monthly fee of $14.95. with this subscription, we can add up to 5 indicators and 2 simultaneous window in a device. And others.
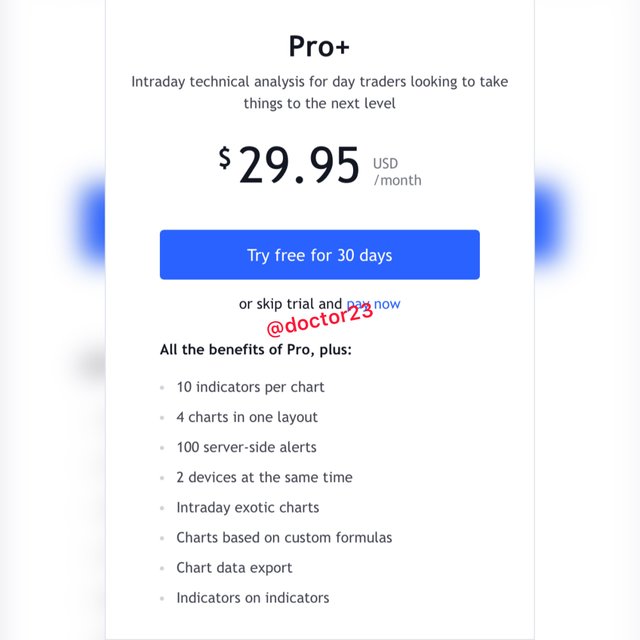
Pro+ Plan
The pro+ plan is the advancement of the pro plan. It has some few additional features when compared to the pro plan, so as it has a higher fee. With the pro+ plan, we have a monthly subscription of $29.95 and with the additional features such as using 10 indicators at a time on a chart and 4 chart window in a layout.
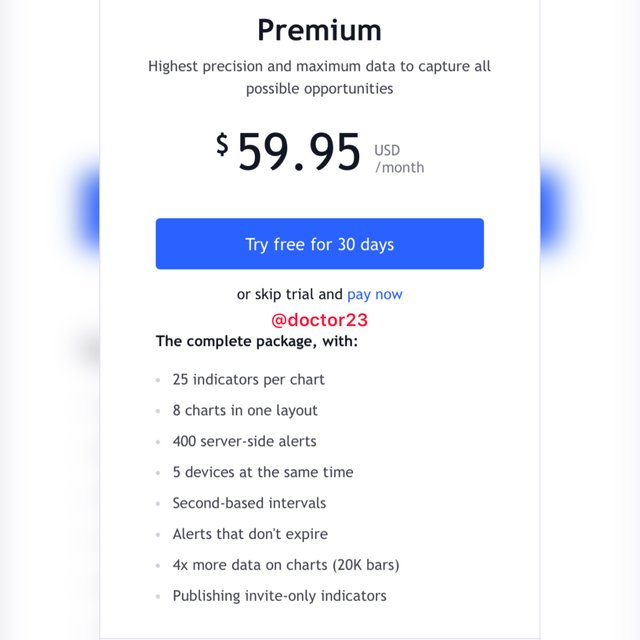
Premium Plan
We have finally the premium plan, with the premium plan we have a monthly subscription og $59.95 with benefits such as adding up to 25 indicators on a chart and 8 window layout on a device.

QUESTION 2
Explain the different features of trading view and what is your favourite feature and why?
Features of Trading View
We have 6 major features in the trading platform which include
- charts
- trade
- Markets
- Screeners
- Community
- More
I will then explain the different features individually so that we get an inside of how the features function.
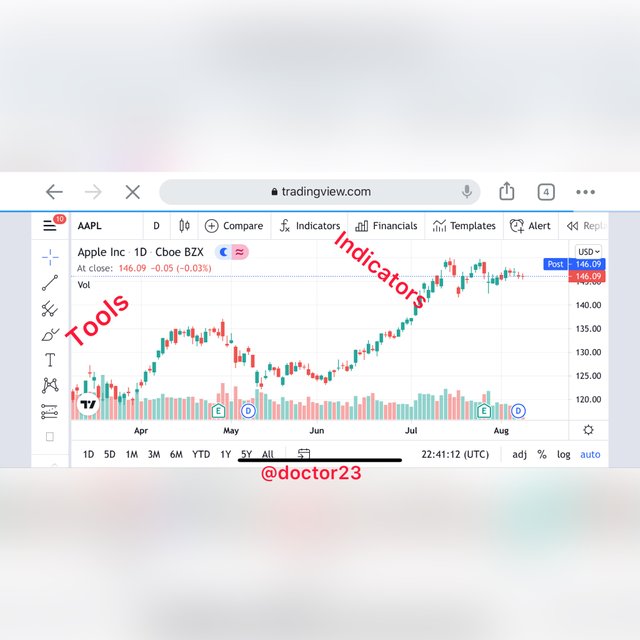
1. Chart
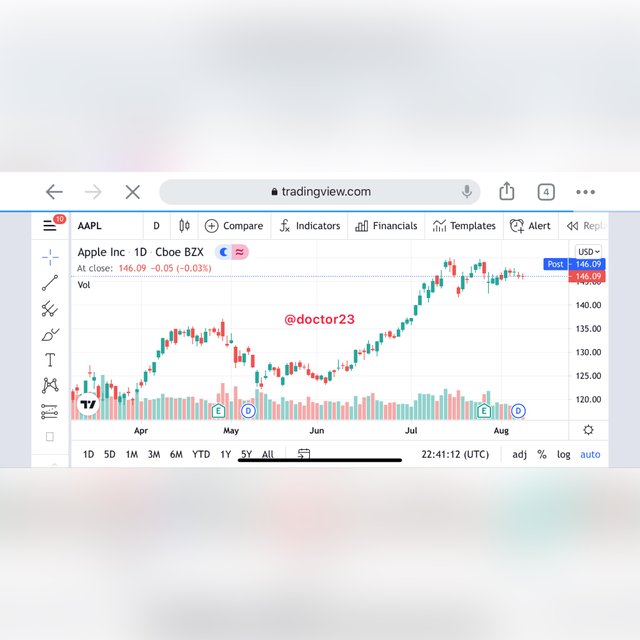
With the chart feature, we have the opportunity to view the price movement of assets. With the addition of indicators and other tools in the trading view, we see all happening in the chart feature. So then we can use the charts to analyse the future price movement of any asset.
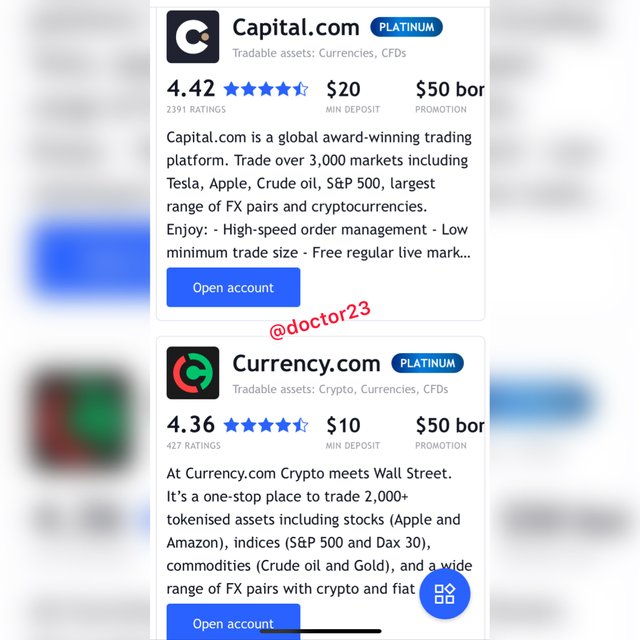
2. Trade
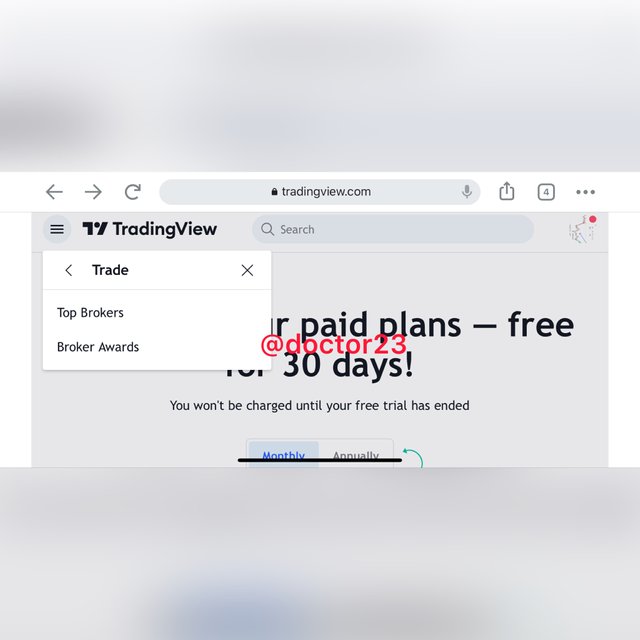
The next feature we have here is the trade feature. The arrangement of this features in the trading view platform is particular important, because now lets see, after using the chart to analyse a particular asset we have to place a trade if it is in favour of trading. With the trading feature we see the top brokers in trades as well as minimum deposit involved with the said broker.
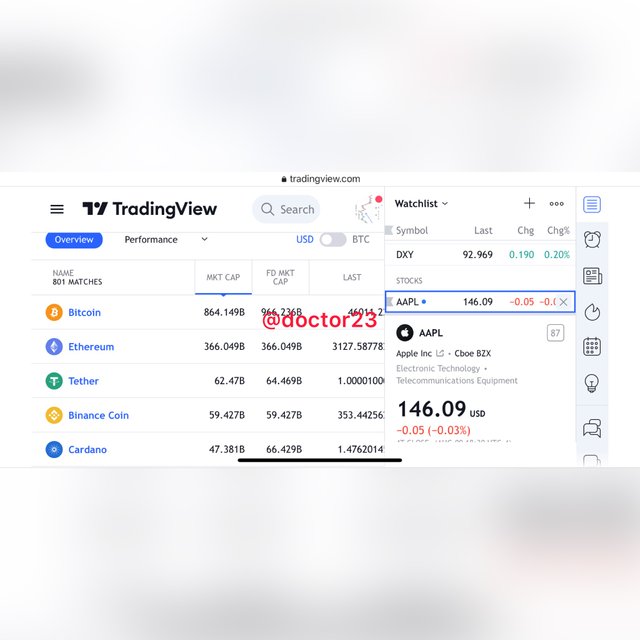
3. Market
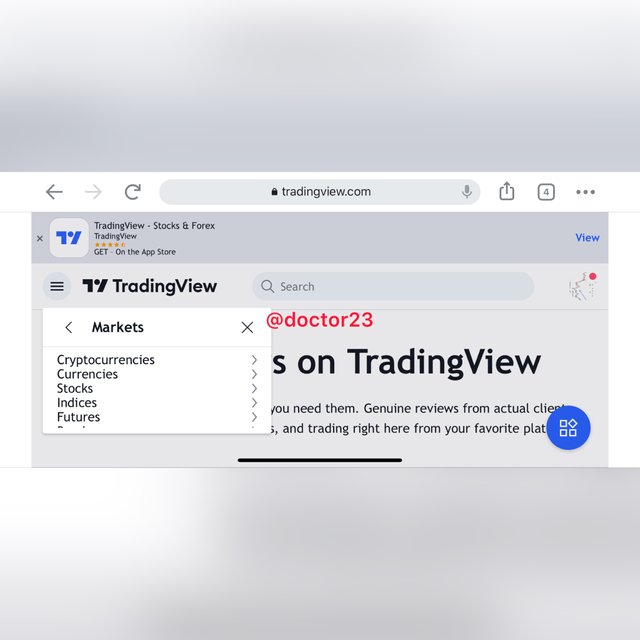
With the market feature, we have the various options and sub-options. This markets include; cryptocurrencies, money, currencies, indices, futures, bonds and sparks.
- with the currency option, we have a different view of all the different options as well as legal tenders. Meaning clicking on Europe, we get all the European usd pairs displayed.
- with cryptocurrencies, we have the opportunity to get different cryptocurrencies, decentralized finance cryptocurrencies, market capitalizations and current prices of cryptocurrencies
- with stocks, we see large capitalisation, top gainers and losers, most active and volatile, overbought and oversold, all-time high and lows, high dividend and sector.
- with indices, we see the different indices such as the US Indices, S&P Sectors with currency indices.
- with bonds, we see the various continental bonds which is futher simplifies ti different countries.
Screeners
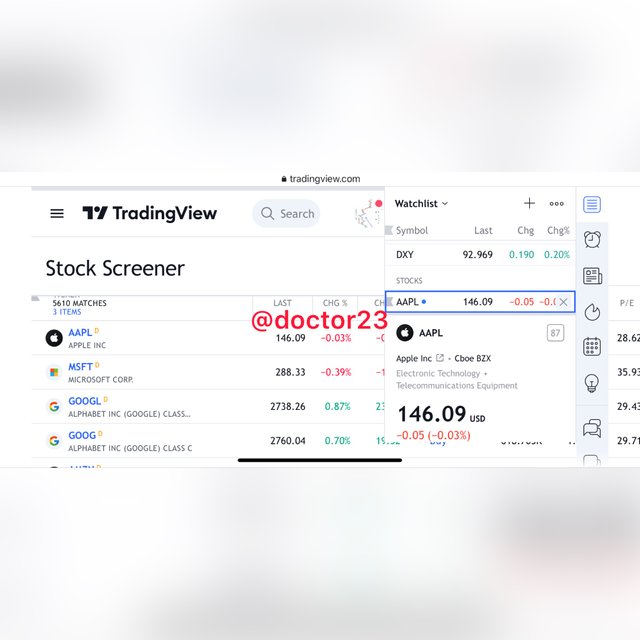
The screener feature gives us the 3 options of the screeners which include the stock screener, forex screener and crypto screener. With this feature, we have the opportunity to screen results of assets which will provide a better guide on which trade to enter in the market.
Community
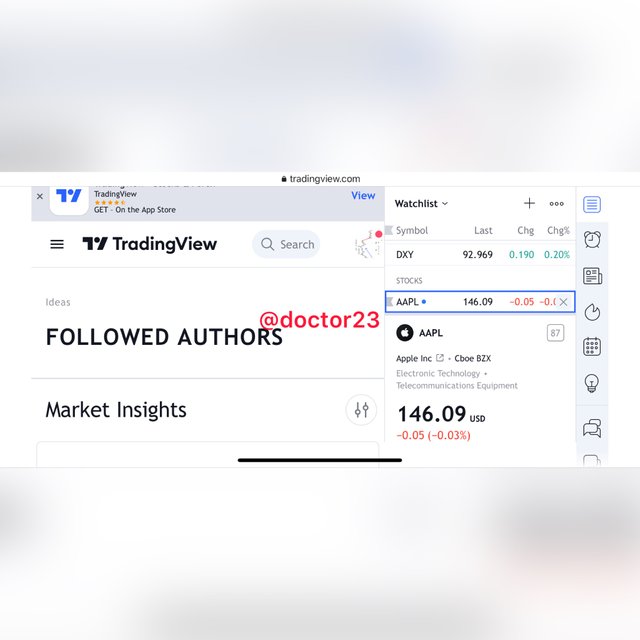
We then have the community feature. This feature is particularly important to new and as well old traders. This provides a platform in which you can get reactions about a particular asset from other traders in the market.
More
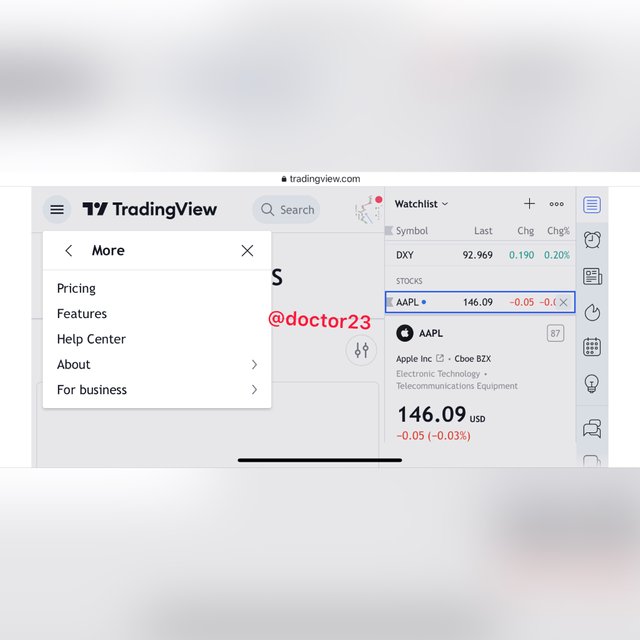
We can use the more feature to get extra help with stuffs we do not in the other features or when we encounter difficulties. We noticed, we can use the help center in the more feature as an example.
My Favourite Features
Particular for me, my favourite feature in the trading view platform is the Charts Feature
I chose the chart feature because, the chart feature provides me with a platform which I can analyse my preferred asset with the usage of various indicators and tools as shown below.

QUESTION 3
How to set up a chart in trading view and use two tools to edit it.
Setting Up The Trading View Platform.
I will use the eth/usdt cryptocurrency pair to set up the trading view chart.
To this we will follow the procedures as follows;
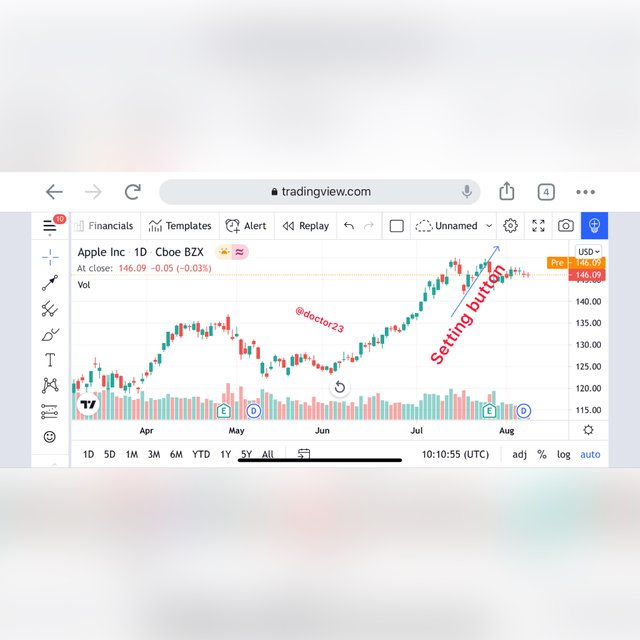
Step 1
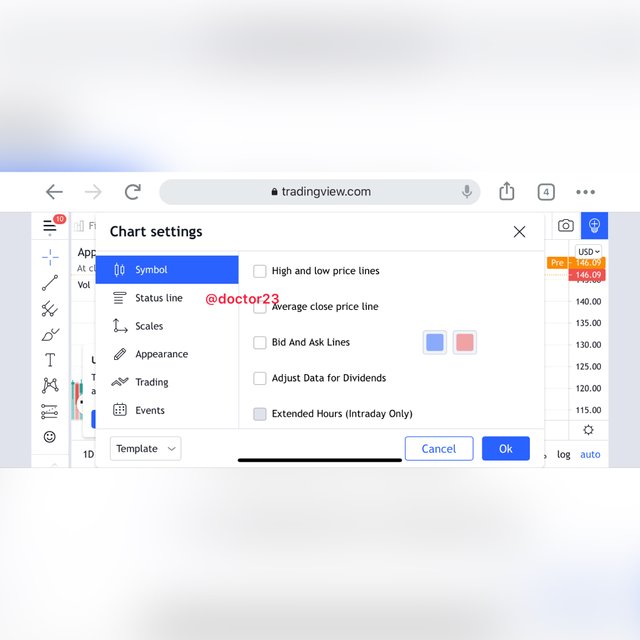
We begin by clicking on the settings button
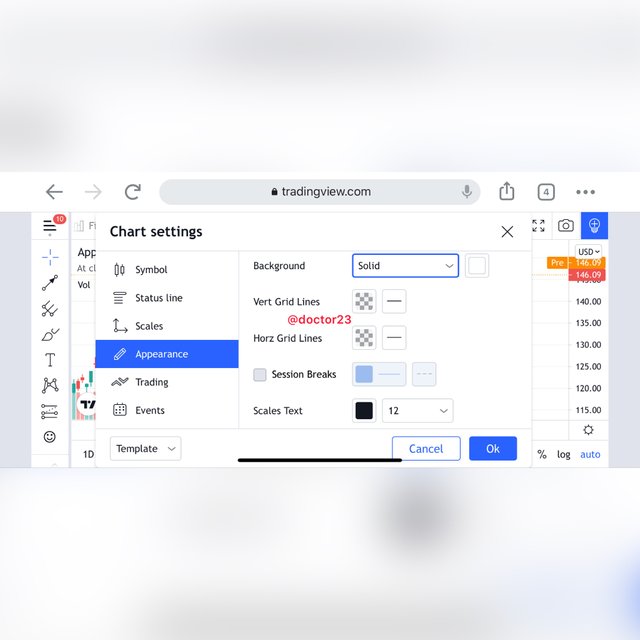
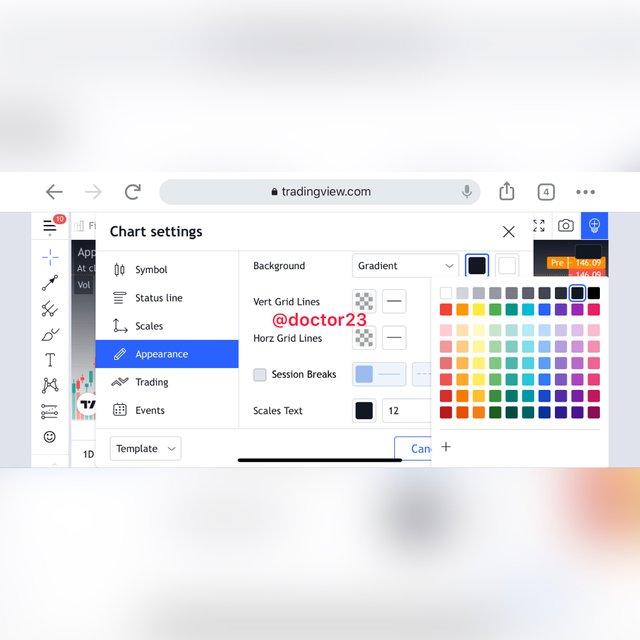
Step 2
We now continue by changing background and appearance of the chart.
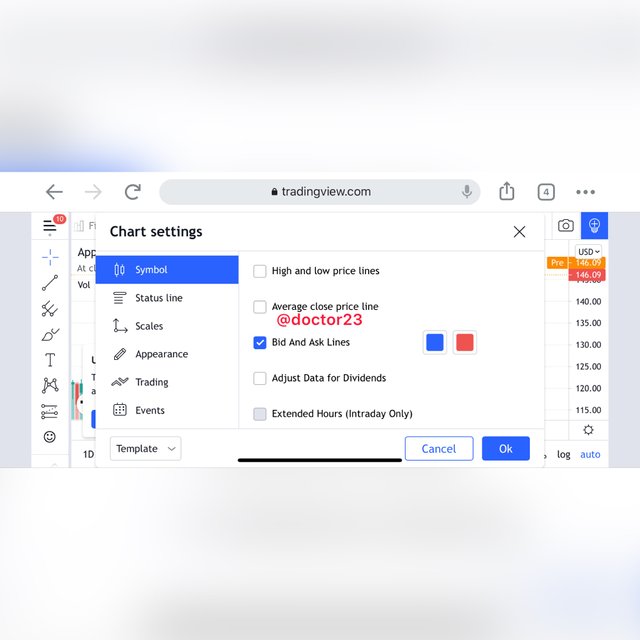
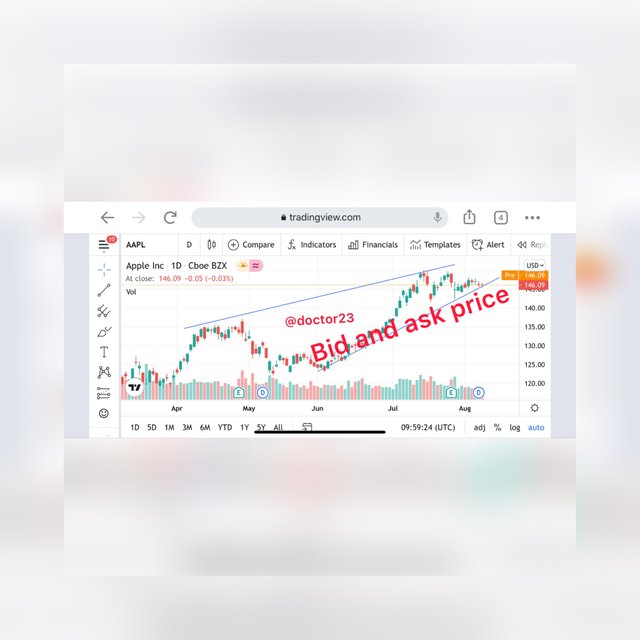
Step 3
The second tool I will be editing is the ask and bid price lines

QUESTION 4
Explain how to add indicator in chart, what is your favourite indicator and why?
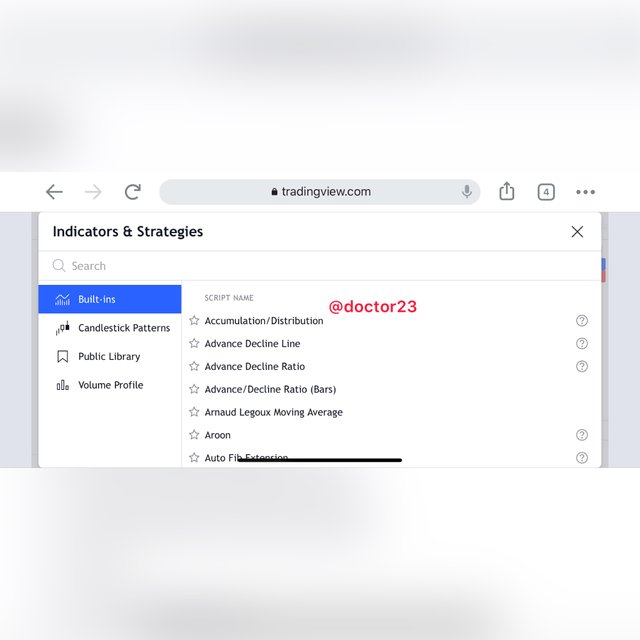
Adding Indicators to a Chart
Adding an indicator to a chart is quite an easy procedure with the trading view platform. This can be achieved by clicking on the f
Button, then searching for the particular indicator we want to add.
My particular indicator I like is the Ichimoko kinko hyo indicator, which is the Japanese indicator. I will use the ichimoku indicator to illustrate the adding of indicators in a chart.
Step 1
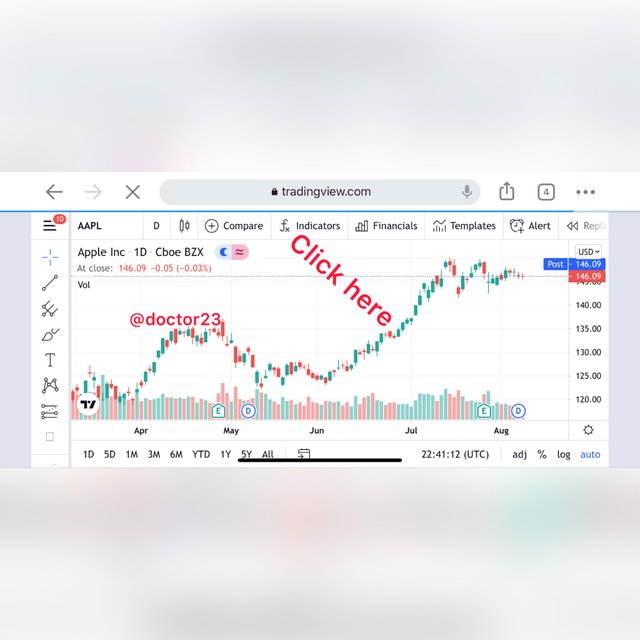
We begin by clicking by clicking on the f button for indicators
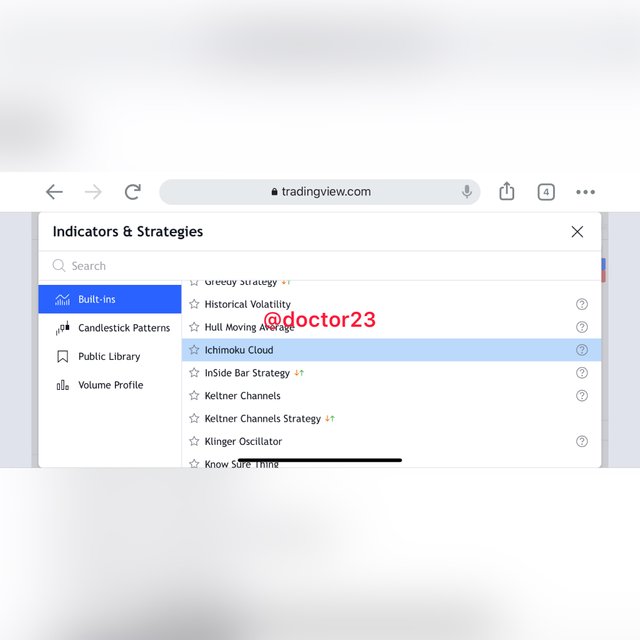
Step 2
We then search the ichomoku indicator and click on it to add to the chart.
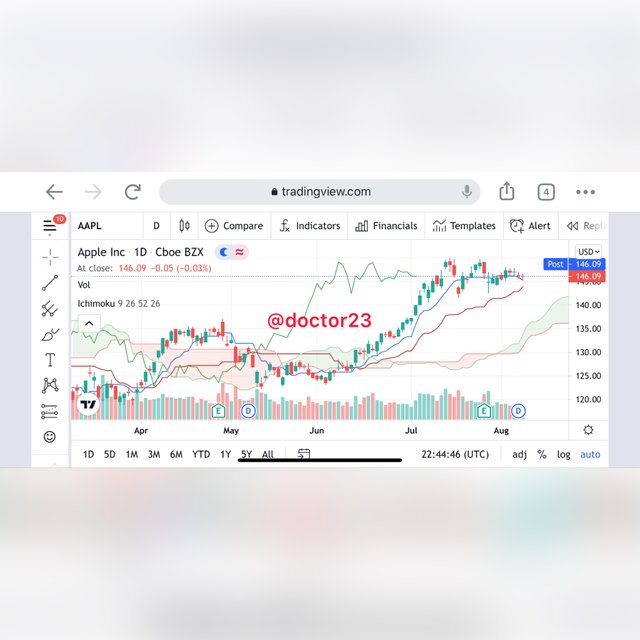
We can see the ichomoku indicator added to our chart. With the ichomoku indicator when we have the red line just cross the blue upward, with prices above the kumo cloud and the green line which is the chikou span just crossed the kumo cloud upward it indicates a buy signal.
And when we have the blue line just cross the red downward with prices below the kumo cloud and the green line which is the chikou span just crossed the kumo cloud downward it indicates a sell signal.

QUESTION 5
Do you think tradingview is useful in predicting the market for cryptocurrency trend/price
Is the Trading View Useful in Price Prediction
The trading view is particular important and I can say it is very good in price and trend predictions.
For my two years in trading, the first one year was with the usage of metatrader 4 platform. But after I found out about the trading view platform, I discovered it has more features which is particular helpful.
So concretising this, we see that the trading view platform actually has more indicators and tools when compared to other platforms and also with the availability of the community I see I particularly useful as we can get information on a particular asset to invest in.

Conclusion
In concluding, we have seen so far that how to register the trading view platform, the major features on the platform and how to add the indicators to out charts. With all this we see that we can increase our performance in trading with use of the trading view with the numerous indicators and tools it holds.
Hi @doctor23
Thanks for participating in the Steemit Crypto Academy
Feedback
This is good content. Thanks for demonstrating your understanding of Tradingview