Steemit Crypto Academy Season 3-Week 1 | Trading Crypto With Ichimoku-kinko-hyo Indicator - Part 1 by @doctor23
Question 1;
What is the ichomoku kinko hyo indicator? What are the differenr lines that make it up?
The Ichimoku Kinko Hyo Indicator
Well, this is an indicator that was programmed in Japan; in its specific purpose at the beginning was for the japanese currencies and all its cross currencies pairs in the market such as the; jpy/cad, jpy/mxn and others.
Until its flexibility and usage was found to be revealing, so others started engaging greatly in the indicator.
The Ichomoku indicator is a technical tool which is used to analyse cryptocurrency assets in the context of this article.
It guages the future prices movements, as it finds and determine the prices movement ahead.
In english, the translation goes thus; ichomoku means a glace; kinko means equilibrium; and hyo means a chart. Meaning that joining all of them together, it means a glance at a chart at equilibrium
The Various lines in the Ichimoko indicators
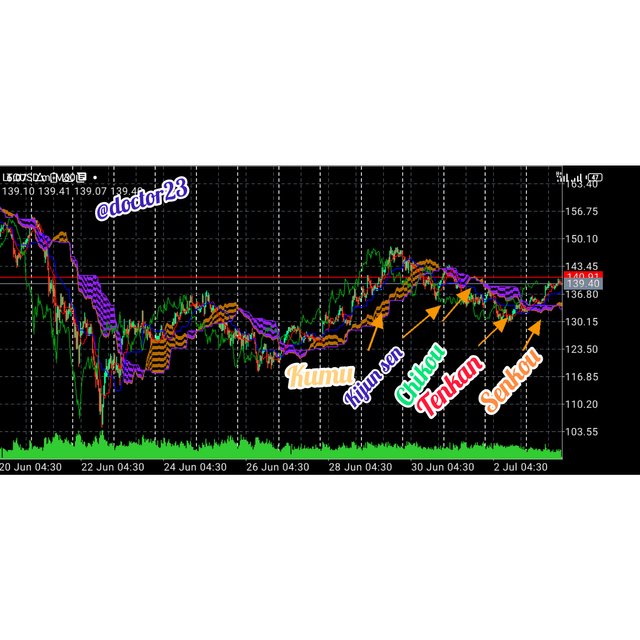
The Ichimoku indicator has 4 different lines and a cloud; the lines are the;
- kijun sen,
- the tenkan sen
- the chikou span
- the senkou span
- the kumu cloud
The Kijun sen:
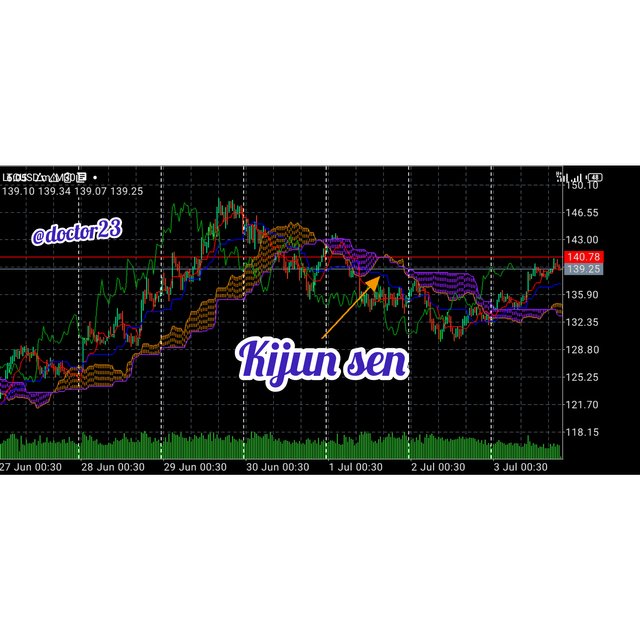
The Kijun sen is represented by a blue line. It is calculated by the average highest high of the last 26 period the lowest low of the last 26 period. It is also called the standard or the base line.
The Tenkan sen:
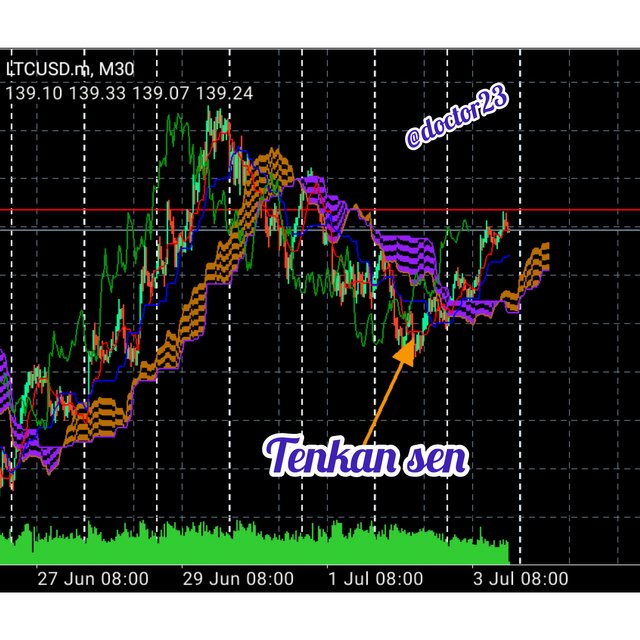
The tenkan sen is represented by a red line. It is calculated by the average highest high and lowest low of the last 9 periods. It also called the turning line.
The senkou span:
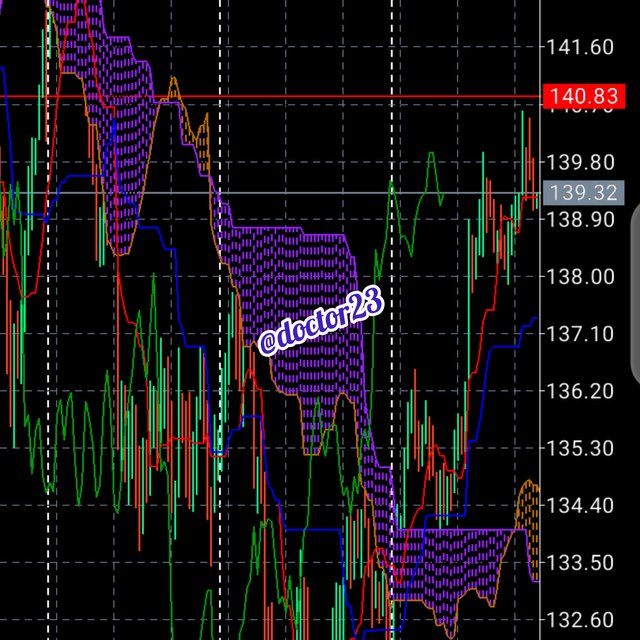
The senkou span is represented by an orange line,the senkou span has two lines; which are the first senkou and the second senkou. The first senkou is calculated by the average of the tenkan sen and kijun sen and plotted 26 periods ahead. The second is calculated by the average of the highest high and lowest low for the last 52 periods and plotted 26 periods in ahead.
The Chikou span:
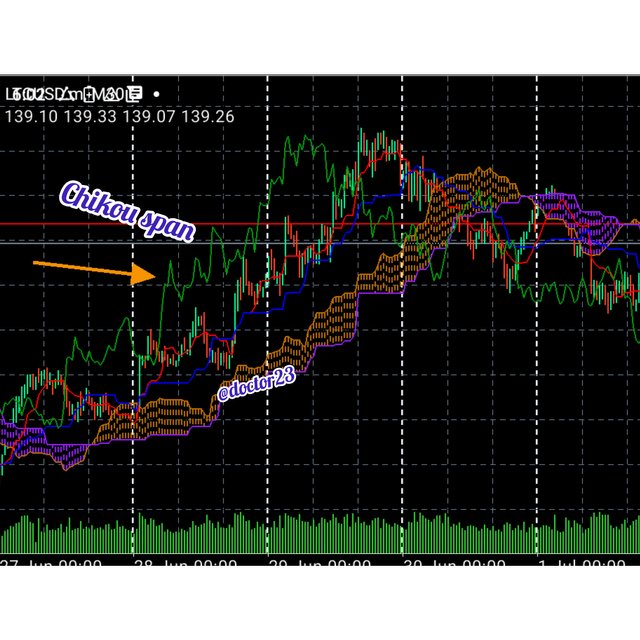
It is represented by a green line. It is calculated by the closing price of today and it is also plotted 26 periods behind. It also called the lagging line.
The ichomokou cloud(kumo)
The kumo cloud now is the area between the first senkou span and the second senkou span.
Question 2;
How to add the ichomoku indicator to a chart? What are its default settings, and should it be changed.
Adding the Ichomoko indicator to a chart
- We log into the trading application, and select the pair we wish to analyse, which I will be using the btc/usd.
- Next step is clicking on the (f) tap used to add indicators.
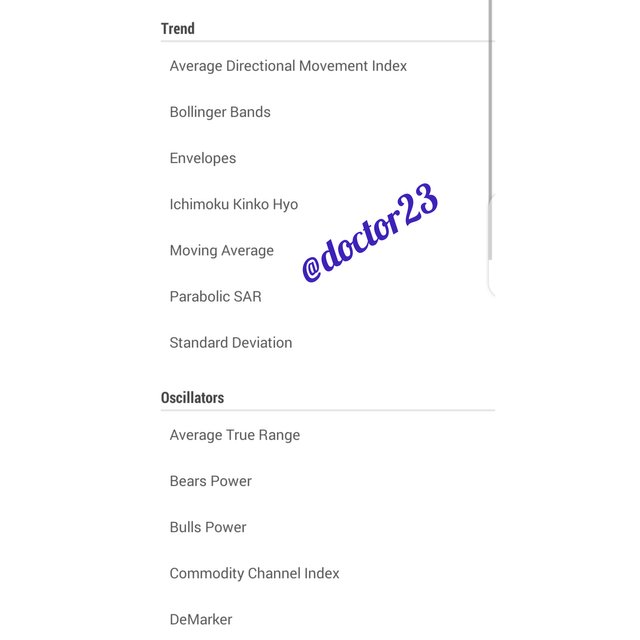
- Then select the ichomoku kinko hyo indicator leaving it to default, and take okay..
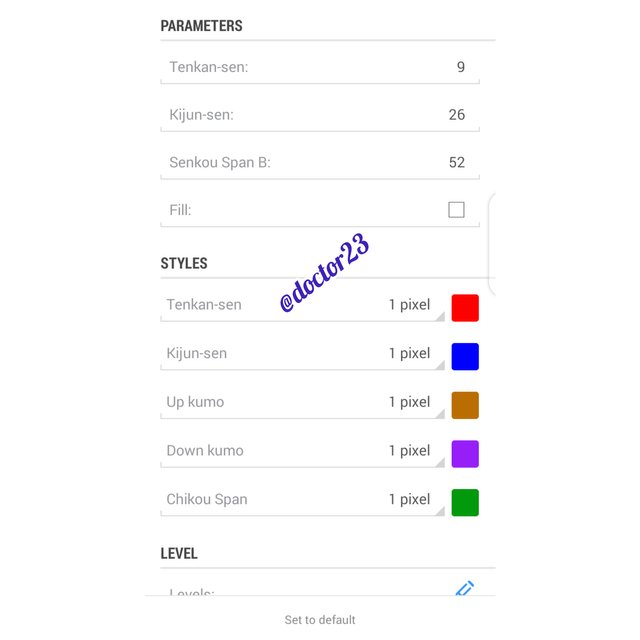
Still using the trading app, mt4: I will show a screenshot of the default setting.
- The senkou span is set to 56 periods
- the kijun span set to 26 periods
- the tenkan sen set to 9 periods
I do not think it should be upseted also, since it has been calculated already vividly by programmers, and most population is using it same, making everyone try to push up the prices at the same time.
Question 3;
How to use the tenken sen line? How to use the kijun sen line, and how to use them simultaneously
Working with the Tenkan sen and Kijun sen lines
The Tenkan Sen Line
As I explained earlier above, the tenkan sen line is calculated by adding the high and low price the last 9 periods and divided by 2.
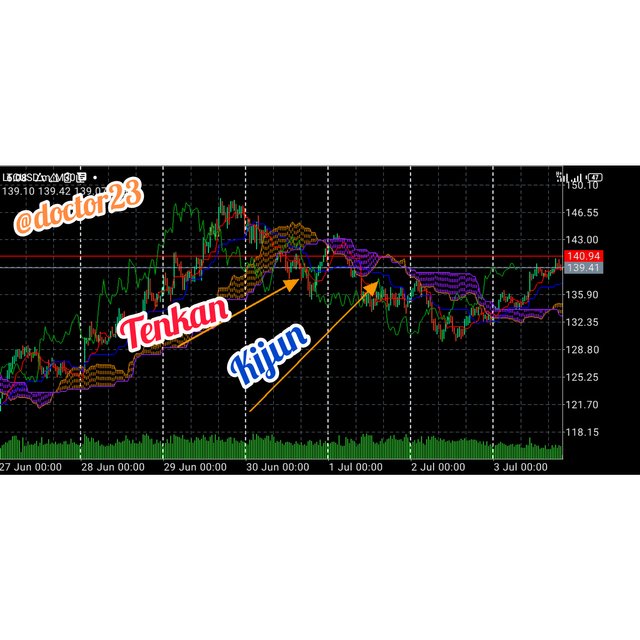
The Tenkan sen line determines the trend of the market. It is shown by the red line on the ichomoku indicator
Now for its interpretation, when the tenkan line is moving continuesly upward it indicates that it is a bullish trend; and when it is moving dowmward, it indicates that it is a bearish trend.
Therefore, when line is moving horizontally, it indicates a quite market or a ranging market. Well, explained.
The kijun sen line
With the Kijun sen which is the blueline, it calculated by the average highest high and lowest low of the last 26 periods.
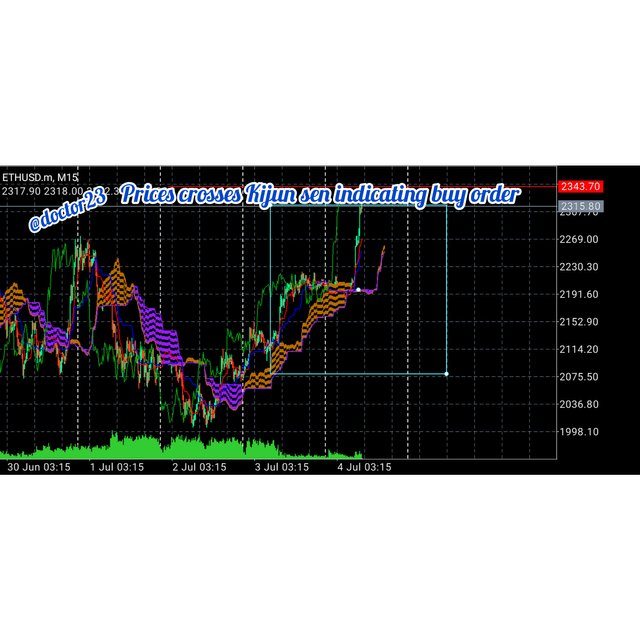
The Kijun sen as most traders will say is the key line in the ickomoku indicator. It determines the future price movement of market which comes into the time of making profit in the market.When prices are higher than the blue line, it indicates a buy signal and when the prices are below the blue line, it indicates a sell signal.
3) Using both simultaneously
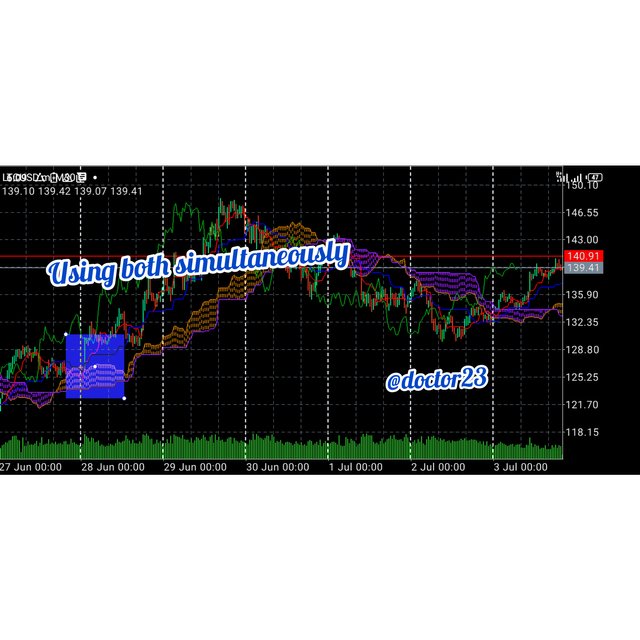
The Tenkan sen and the Kijun sen acts as dynamic supports and resistances in the market. Meaning they can be used as supports and resistance as well. When prices touches the upper band it has a higher probability of making a rebounce to the lower band.
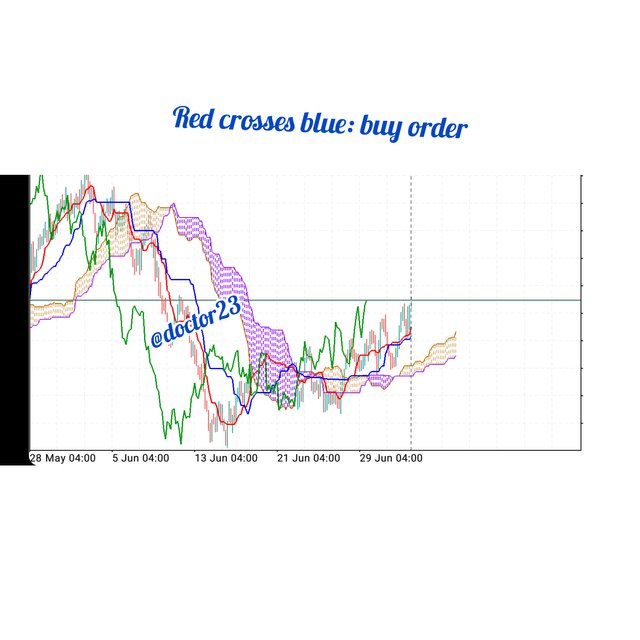
Here is another aspect, when the tenkan sen line crosses the kijun sen line in the upward direction it shows we should place a buy order and when the tenkan sen line crosses the kijun sen line downward, it shows we should place a sell order
Question 4;
What is the chikou span, and how to use it. Why is it often neglected.
The chikou span line.
The Chikou span line is represented by the green line and calculated by the closing price of today plotted 26 periods behind..
It is principally used to determine entry and exit positions.
Chikou Span usage and why it is neglected
The chikou span actually indicates indicates an bullish when it exactly moves above the market action, conversely,a bearish trend when it just moves below the market action.
Traders often deem this chikou span to not be that useful because the get a quicker trend of the market using the tenkan span. Ansd also because they get a quicker signal working with tenkan sen and the kijun sen; but I deem it to be very necessary.
Question 5
What is the best time frame to use with the ichomoku and what is the best indicator to use it with.
Usage of time frame with the ichomoku indicator
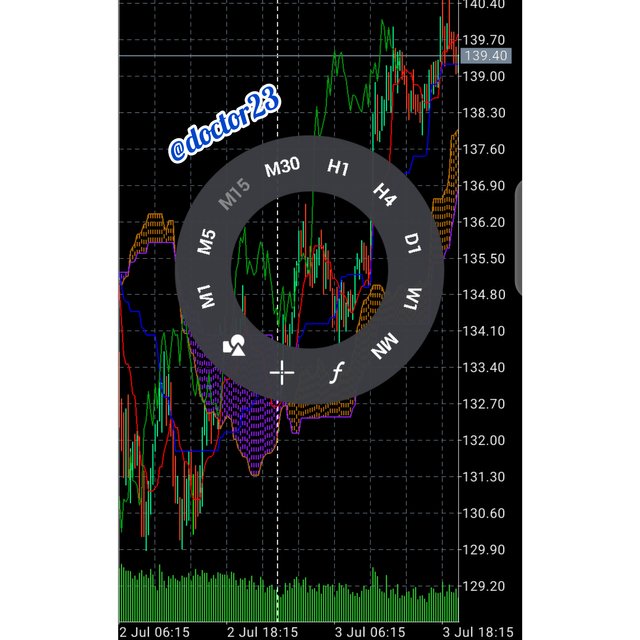
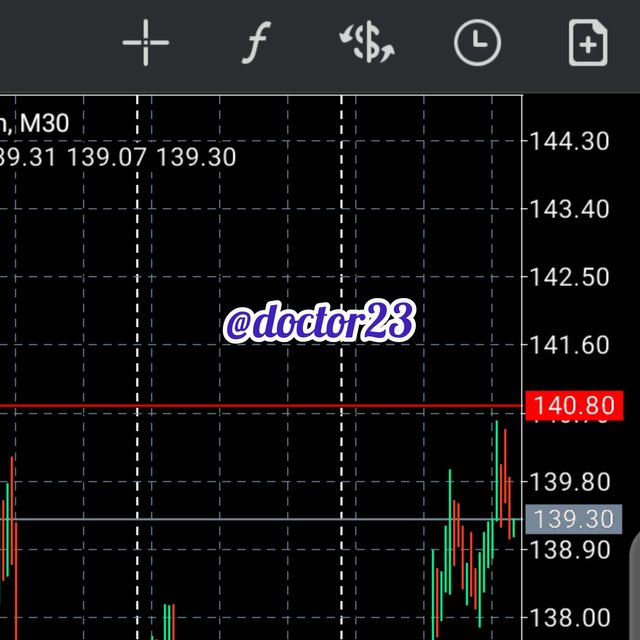
Short term trader or day traders will be the perfect beneficiaries of the ichomoku indicator. For its complete view, the indicator will need a volatile asset to indicate its future price movement, which will be achieved by the 15, 30 and 1 hours time frames.
So I will not advice swing traders to engage in the ichomoku indicator that much.
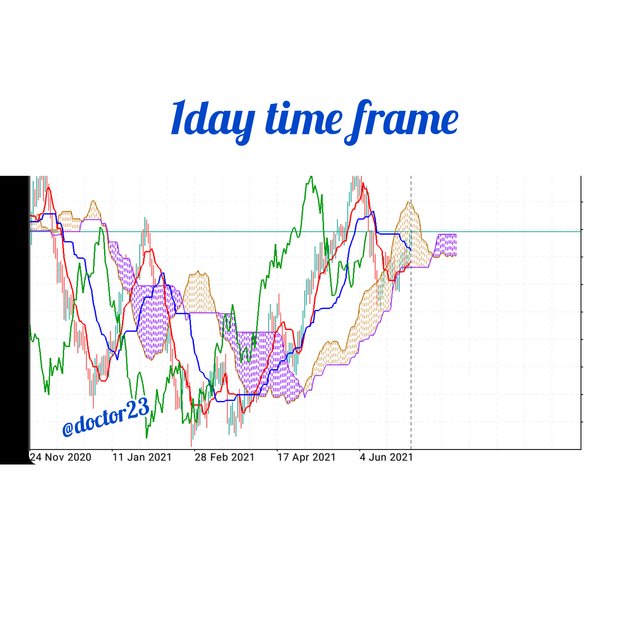
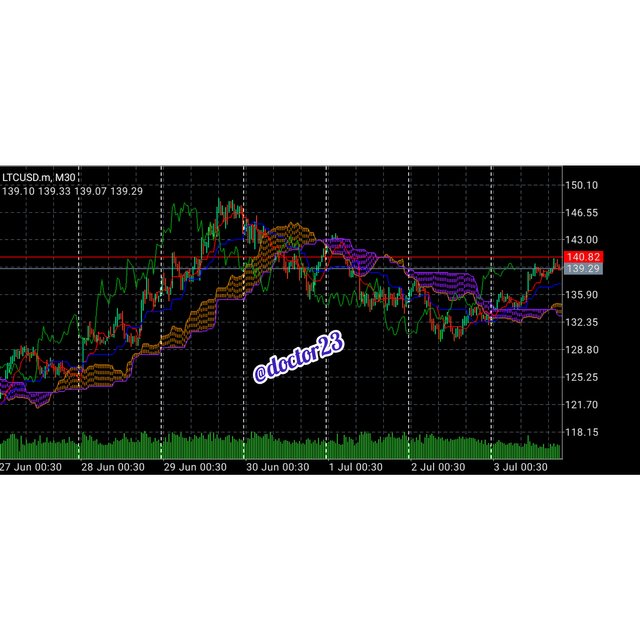
Using it as a long them trader, means you will have to wait for days before you can ever see a signal. In the sreenshot, the red line has been approaching the blue for days but nothing yet, which means it eequires a lot caution as a long term trader.
Using other indicators with the ichomoku
In the imperfect world we live in, it not advisable to rely on a single thing. So is it with trading. When trading we do not rely completely on a single indicator, meaning we should always use at least two indicators when working in the market.
I will be choosing the relative strength index and the stochastic indicators to use alongside the ichomoku indicator. The relative strength index identifies potential overbought and oversold in the market. Meaning in scenario of overbought we place a sell order, and oversold a buy order.
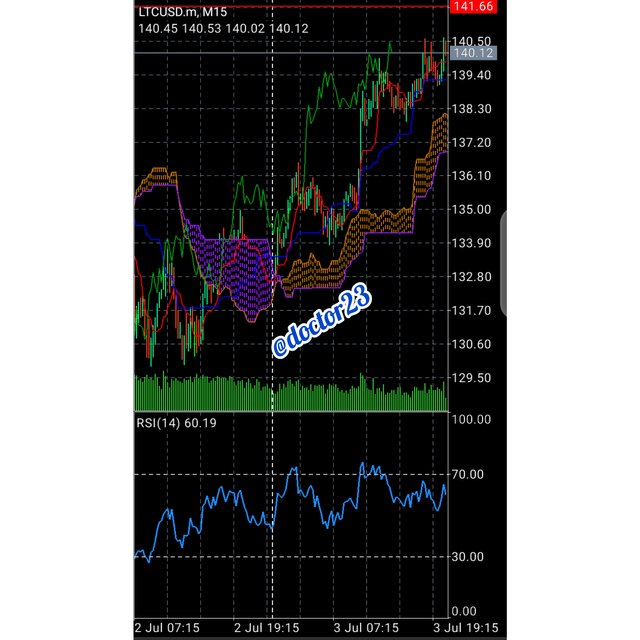
Now joining the two; when the RSI shows a potential overbought and the prices are lower than the kijun sen line, it indicates a sell signal. And when prices are higher then the kijun sen and shows oversold as well; it indicates a buy order.
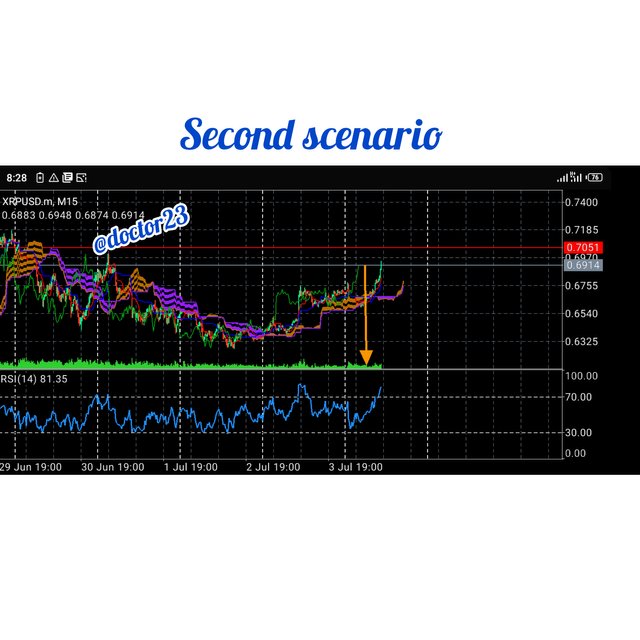
meaning here that we have double assurance
Conclusion
To conclude; so far, I have talked about the Ichimoku Kinko Hyo indicator, that is used to determine future price movements. It has four lines with the kumo cloud. With proper stop loss and take profits, and using good risk and money management, as well as using the indicator with others like the relative strength index and index one is guaranteed of making good analyses which will guarantee increase profitability as well.
Cc; @kouba01
Dear @doctor23
Thank you for participating in Steemit Crypto Academy Season 03 and making efforts to complete the homework task. You got 6/10 Grade Points according to the following Scale;
Key Notes:
We appreciate your efforts in Crypto Academy and look forward to your next homework tasks.
Regards
@cryptokraze