Steemit Crypto Academy//Season 2 week 8: Homework for [@fendit] on Wyckoff Method.
Introduction
It is another great week in this wonderful community #SteemitCryptoAcademy. The lesson on Wyckoff theory by @fendit was quite enriching as it gave me a pushful power to do more research and enquire more knowledge.
Question 1
what is composit man and its fundamental laws.
Composite man and Fundamental Theory.
I will begin by explaining what is Wyckoff Theory, as the composite arises from it.
The Wyckoff method was brought about by Richard Wyckoff, which is evident enough that he named his theory after his name, like that of John Bollinger in the Bollinger Bands and Elliot Waves in the waves theory.
This theory actually consist of a series of strategies and principles.
This theory gives an overview of the:
- Three Fundamental Laws.
- The Composite Man concept.
- A five step approach to analyse the market
- A concept for analysing charts.
I will be briefing vividly on the first two points in this section of the question, and the later two, when analysing a Crypto currency pair.
The composite man idea was created based on the imaginary identity of the market, meaning that, ttaders should look at the market as if it was being controlled by a single entity. Not leaving out investors in the market.
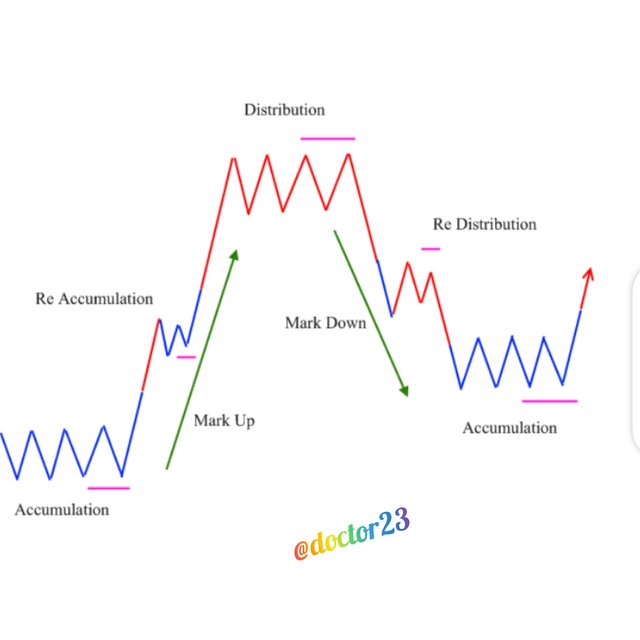
I will be using the composite man to show a simplified market cycle. These include the uptrend, downtrend, accumulation and distribution.
Accumulation:
The phase of side movement is called the accumulation phase. This is the first phase seen in the composite man as the composite man accumulates assets attracting most investors, though it is usually done gradually.Uptrend:
The composite man pushes the market up when it is holding much shares.
Meaning that, the uprising trend will bring more investors into investing in the market. This point is noted to show that demand is higher than supply., also when we have multiple phases of accumulation, it is defined as reaccumulation phases.Distribution:
The third phase is the distribution phase which comes after the accumulation and uptrend phases. In this phase, the composite man distributes its holdings. This distribution phase is often marked by a sideway movement as it takes up demand. In the distribution phase, profitable positions are sold to those entering the market at a late stage.Downtrend:
The phase after the accumulation, uptrend destribution, is the downtrend phase. Meaning that after the uprise, and distribution the market has to fall back. The composite man start pushing the market downward after selling its assets in the distribution phase.meaning here that supply will exceed demand.
The 3 fundamental laws of Wyckoff include:
- The law of Supply and Demand
- The law of Cause and Effect
- The Law of Effort Vs Result
To begin,
1. The Law of Supply and Demand
Using basic and simpler explaination, the law of demand and supply states that, when demand is greater than supply, prices rise and when supply is greater than demand, prices fall.
This law is as basic as taught in secondary schools in Economics. And it is one of the basic laws in the financial market.
This law is often represented in equation form as follows.
Supply = Demand: means no Change in prices or low volatilitu
Supply < Demand: Prices are presume to rise
Supply > Demand: Prices are presume to fall.
2. The Law of Cause and Effect
In bid to explain the second law, it presumes that, difference between damand and supply are considered not to be random. As they come as a result of specified occation. Meaning that after an accumulation, it will be followed closely by an uptrend, same as after a distribution, it will be followed closely by a down trend.
3. The Law of Effort Vs Result
Moving onto the third law of Wyckoff, it explains that, an asset price changes due to the effect an effort, represented by its trading volume.
In otherwords, if prices and volume diverges significantly from each other, the market trend will change direction or stop, and if prices moves along with volume, then the trend will continue.
Question 2
Share a chart of any cryptocurrency of your choice (BTC or ETH won't be taken into account for this work) and analyze it by applying this method. Show clearly the different phases, how the volume changes and give detail of what you're seeing.
I will use the five step approach to analyse the market.
I will determine the position of the price as well as the future trend of the xrp/usd pair. Answering the question of if market is consolidated or trending, it is evident enough that that the xrp/usd pair is a trending one, looking at the volume, or we could use Bollinger bands as well, if need be. From all this assessment, it is a good pair for the analysis.
I will be selecting the perfect pair, the key factor includes selecting pairs that are stronger than the market, and shows large percentage increase than market during rallies. Also, if a downtrend, i will be choosing a pair that is weaker than the market.
In bid to increase the chances of a good pair, i will be choosing a pair that exceeds my minimum objective. Meaning i will be pinning out price targets with the usage of the point and figure projectiona for short and long trades.
In determination of a pair readiness to mobe, i will be looking for a pair to apply the Nine tests dor selling or buying
In a nutshell, timing of my commitment with the turn of the crypto market index will be a principal factor. Meaning i will using proper stop loss and trials as well. This will help in locating specific market turns and and avoiding fakeouts. This all goes to conclude on risk management.
With all these, the best pair situable for this analysis will be the Ripple crypto currency.
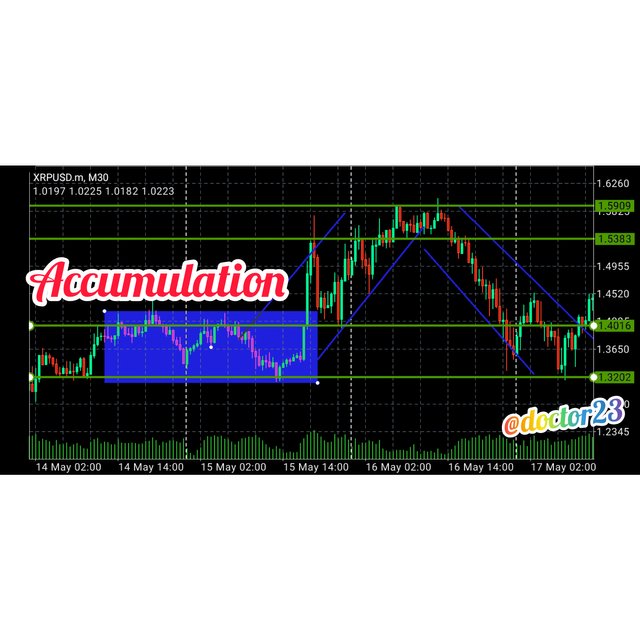
In the 30 minute timeframe, we notice an accumulation from 14 march to 15 march, which was closwly followed by a breakout as demand exceeded supply according to the first law of the Wyckoff theory talking about demand and supply. The main factor is shown as composite man attracts investors.
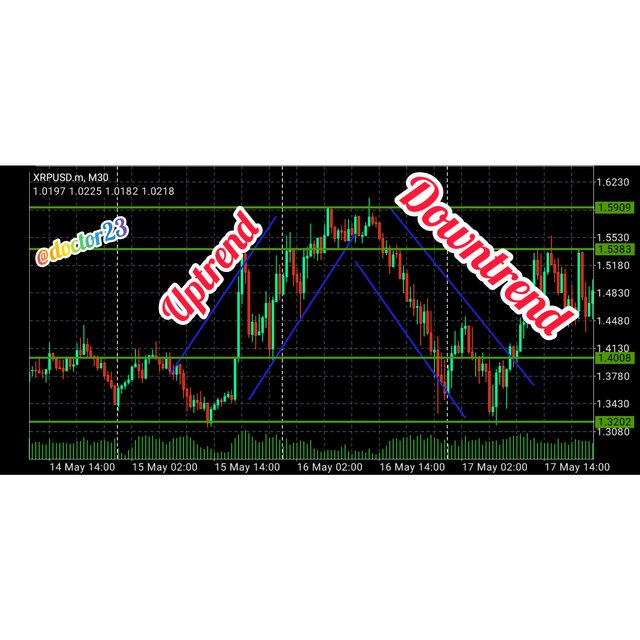
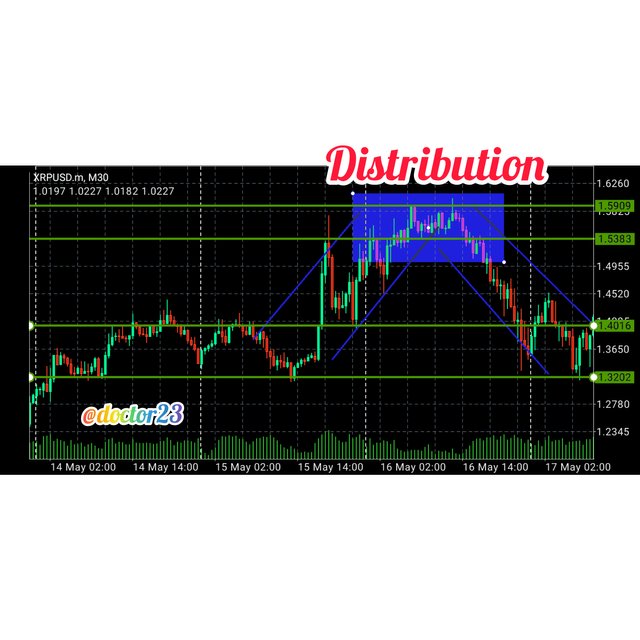
We can spot an uptrend in the xrp/usd chart from the 15th of march. This is actually shown as the composite man pushes the prices up, which invites investors.
Closely followed by that is the distribution phase, as seen in the screenshot, as the composite man distributes its holdings on ripple.
The next phase is the downtrend.the composit man start pushing the prices of xrp down, by selling its holding.
Conclusion
- The five step approach can be used to analysia the trend and sentiment of the market.
- The laws of wyckoff theory espiecially the law of demand and supply, is a key point in determining demand and supply zones, depending on which one exceeds the other.
- Using proper risk management, the Wyckoff theory when properly used can generate good amounts of Pips in the market.
Thank you for being part of my lecture and completing the task!
My comments:
Nice work! Everything was really good and explanations were crystal clear :)
Overall score:
7/10