Trading with Accumulation / Distribution (A/D) Indicator - Crypto Academy / S4W5 - Homework Post for @allbert
QUESTION 1
Explain in your own words what the A/D indicator is and why it relates to volume.
The A/D Indicator
The A/D stands for the name accumulation/distribution which is a technical indicator that takes into consideration the volume and price of an asset to access if an asset is being accumulated or distributed.
Before going in detailed, let me first of all explain what the accumulation and distribution is all about
The Accumulation is the phase seen in the market structure before an uptrend. The accumulation indicates the investors preparing to purchase that particular asset.
The Distribution is the phase in the market structure seen after an uptrend. This is portrayed by investors stating to sell off their holdings which is closely followed by a downtrend.
The a/d indicator therefore identifies divergence between the price and the volume flow. This is achieved by seeing how the prices rise while the indicator falls or the prices falls while the prices rises indicating a strong trend as it gauges demand and supply of the asset.
The A/D Indicator is actually related to volume principally because the indicator predict the direction of volume flow just as mentioned above. So in all, the A/D indicator is a volume based indicator.

QUESTION 2
Through some platforms, show the process of how to place the a/d indicator
How to add the A/D Indicator
I will be illustrating the adding of the A/D Indicator using the tradingview.com
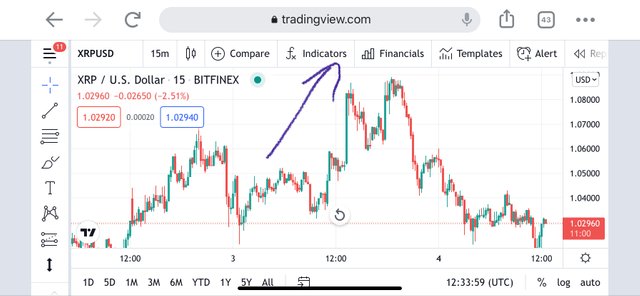
Step 1
We begin by logging into the trading view platform and clicking on the indicator tab as shown below.
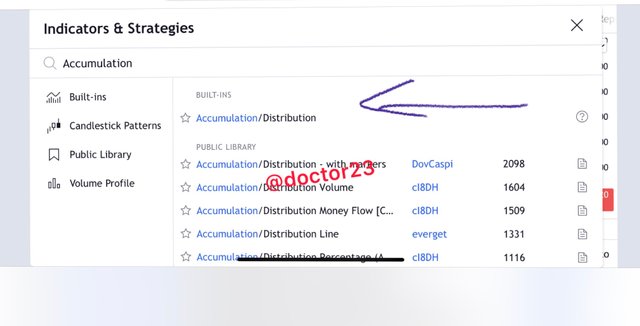
Step 2
We then continue by searching the A/D in the search tab, and we click on it.
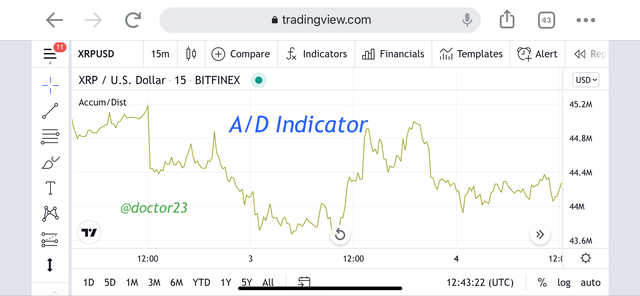
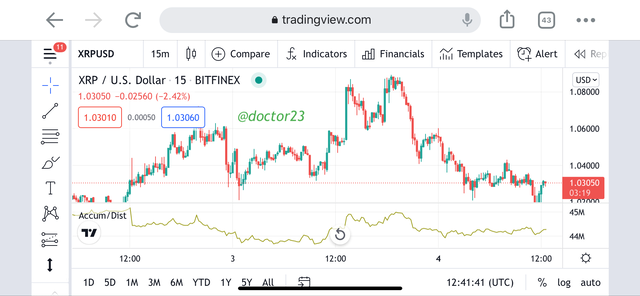
Going back to my chart, we can see from the screenshot the A/D indicator which has been added.

QUESTION 3
Explain though an example the formula of the a/d indicator
Calculations of the A/D Indicator
I will begin by stating the formula of the a/d indicator before going to a practical example.
Step 1
We begin by calculating the money flow multiplier with the formula as stated below.
MFM = (close - low) – (high - close) / high - low
Where;
MFM is the money flow multiplier
Close is the closing price
Low is the low price for the period
High is the high price for the period.
Step 2
We then continue by calculating the Money Flow Volume
Money Flow volume = MFM * Period Volume
Step 3
Finally we calculate the A/D
A/D = Previous A/D + CMFV
Where
CMFV = current period money volume.
Example
Close price = $6
Low price = $4
High price = $9
CMFV = 200
Previous Period AD = 350
Following the steps above, I begin by calculating the MFM MFM = (close - low) – (high - close) / high - low (6 – 4) – (9 – 6) / 7 – 5 = -0.5
I then calculate MFV
Money Flow volume = MFM * Period Volume
-0.5 * 350 = - 175
Finally i calculate the A/D
A/D = Previous A/D + CMFV
200 + (-175)
= 25
We can then use the first value of the MFV for the first value and repeat the process.

QUESTION 4
How is it possible to detect and confirm a trend through the a/d indicator?
Detecting and Confirming Trends with the A/D Indicator
I will be explaining how to detect and confirm the trends using the a/d indicator for both the bullish and bearish markets.
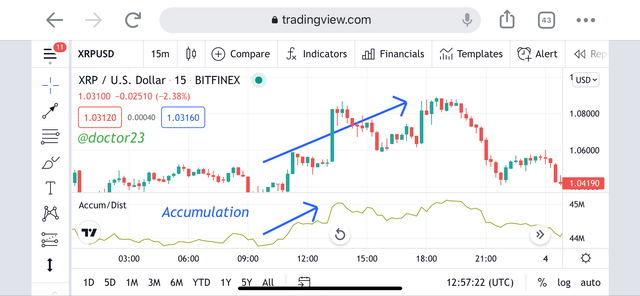
Bullish Trend
The bullish trend is detected when the indicator and the prices of the asset both make an uptrend through the formation of high peaks and high troughs.
When we then have the A/D indicator rising over this given period, we can say that the buying pressure is increasing which shows a potential upward breakout. This is shown in the analysis below.
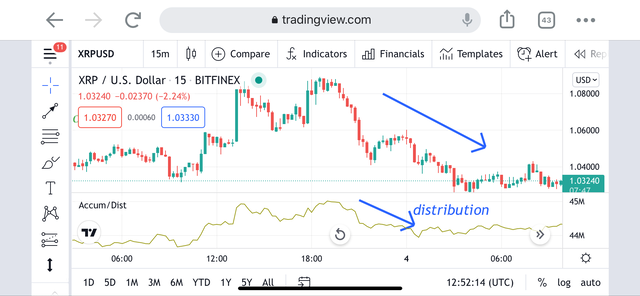
Bearish Trend
The bearish trend is detected when the indicator and the prices of the asset both make a downtrend through the formation of low peaks and low troughs.
When we then have the A/D indicator falling over this given period, we can say that the selling pressure is increasing which shows a potential downward breakout. This is shown in the analysis below.

QUESTION 5
Through demo account, perform one trading operation using the a/d indicator only.
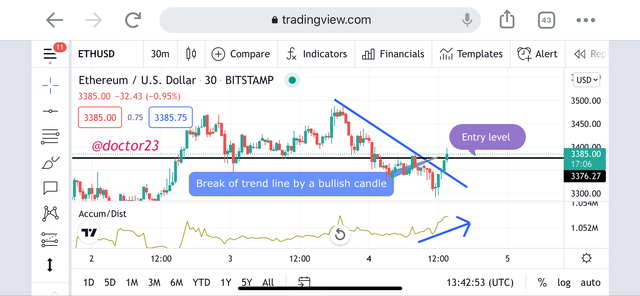
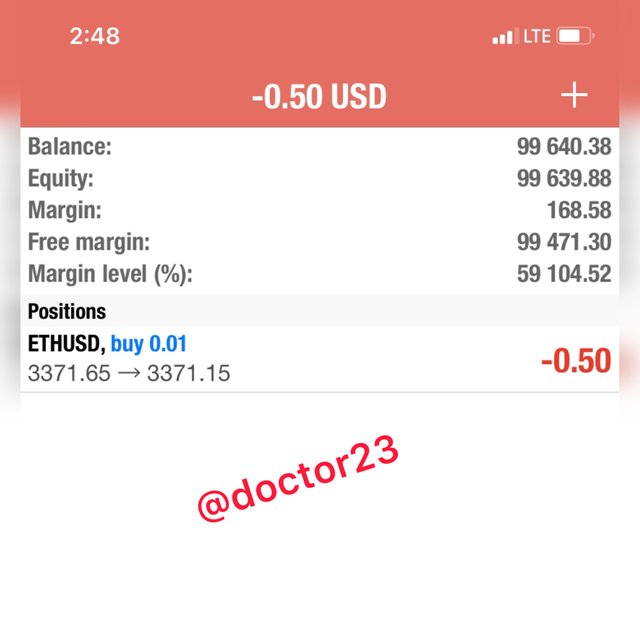
Buying the ETH Cryptocurrency
Trade Entry
I will be using the divergence trading strategy with the A/D indicator for my trade entry. For a buy entry, the divergence occurs when the price is falling with the formation lower highs and the indicator is rising with the formation of higher lows.
I begin by connecting the previous lower highs in the price with a trend line and waiting for a break of the trend line, I enter my buy order after the prices have moved away from the candle and I enter at the close of the last candle.
This is as shown as shown in screenshot in below.
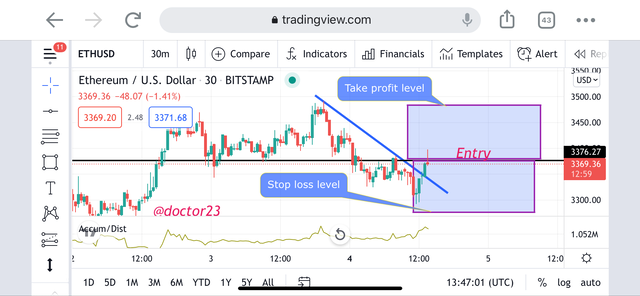
Trade Exit
Exiting the trade will be about setting proper stop loss and take profit levels. The stop loss will be set below the recent swing point and the take profit will be done with a risk to reward ratio of 1:1

QUESTION 6
What other indicator can be used in conjunction with the a/d indicator. Justify, explain and test.
Using the A/D Indicator with the RSI Indicator
The Relative Strength Index indicator is a great indicator to use in conjunction with the A/D indicator. This is because a good analysis should be done with the usage of both leading and lagging indicators.
With the RSI being a leading indicator which locates overbought and oversold regions in the prices, the trends and trend reversals using the divergence strategy will be confirmed using the relative strength index indicator.
We can see the analysis in the chart below for bullish and bearish trends.
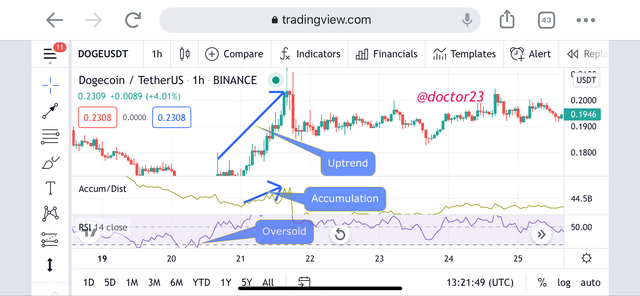
Bullish formation
We see the formation of oversold with the relative strength index indicator. And at the same time the a/d indicator signaling a bullish move.
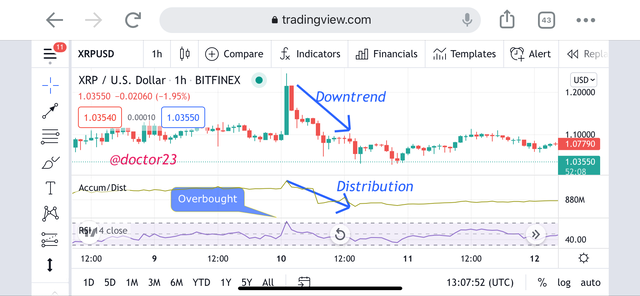
Bearish Trend
We see the formation of overbought with the relative strength index indicator. And at the same time the a/d indicator signaling a bearish move.
Conclusion
I have explained the A/D indicator in detailed which is used principally in determining trends. I have also discussed the adding of the indicator to a chart and how to calculate the indicator using examples.
Demonstrating practically I have performed a buy order using the divergence strategy with the indicator.
I have also explained the using of the A/D indicator with other indicators such as the RSI which I have explained for both bullish and bearish trends.
CC: @allbert
Hello, @doctor23 Thank you for participating in Steemit Crypto Academy season 4 week 5.
Thank you Sir