[Crypto Trading With Chaikin Money Flow Indicator]- Crypto Academy S4W6 - Homework Post for professor @kouba01
QUESTION 1
In your own words, give a simplified explanation of the CMF indicator with an example of how to calculate its value
The Chaikan Money Flow Indicator
In bid to define the chaikin money flow indicator the chaikin money flow indicator is a technical indicator which is used in the financial market and trading to measure the flow of volume in a defined period of time.
The chaikin money flow indicator was developed by Marc Chaikin which he used his name in the naming of the indicator. The indicator was designed for the sole purpose of;
- Measuring buying pressure in a bullish trend
- Measuring selling pressure in a bearish trend
The default look back period for the chaikin indicator is 21 days which corresponds to one trading month.
Describing now how the indicator works and looks like, we see that the indicator is made up of a line just like that of the stochastic and relative strength indicator, but it does not locates overbought and oversold regions as they do, but rather the indicator locates potential buying and selling pressures in the trend by the cross of the 0 level which is the mid-point value.
The indicators value fluctuates between +1 and -1 in quantifying the fluctuations.
Calculation the Chaikin Money Flow Indicator
I am going to use 3 steps to explain the calculations of the chaikin money flow indicator. We will be calculating the following;
- Money Flow Multiplier
- Money Flow Volume
- And finally using the money flow volume to calculate the chaikin money flow.
I will now state the formulas before diving into the example calculations
A) The money flow multiplier is given by
= [ (close – low) – (high - close) ] / (high - low)
B) The money flow volume is given by
= (MFM X Volume for the period)
C) And finally the chaikin money flow is given by;
sum of money flow for 21 period / sum of volume for 21 period
An Example Calculation
Let’s assume the following values for the high, the close, the period volume and the close, and total period volume.
The Close = $2100
The high = $2150
The Low = $2040
The Period volume = $14000
The Total period volume = $9000
Step one
Money flow multiplier (MFM)
= [ (close – low) – (high - close) ] / (high - low)
[ (2100 – 2040) – (2150 - 2100) ] / (2150 - 2040)
60 – 50 / 110
= 1/11
Step two
Calculating the money flow volume
MFM X Volume for the period
1/11 X 14000
= 1272.727
Step three
We then conclude by calculating the chaikin money flow
sum of money flow for 21 period / sum of volume for 21 period
1272.27 / 9000
= 0.14
The chaikin money flow is 0.14

QUESTION 2
Demonstrate how to add the indicator to a chart other than the trading view platform. And highlight how to modify the settings of the best period
How to add the Chaikin Indicator to a chart
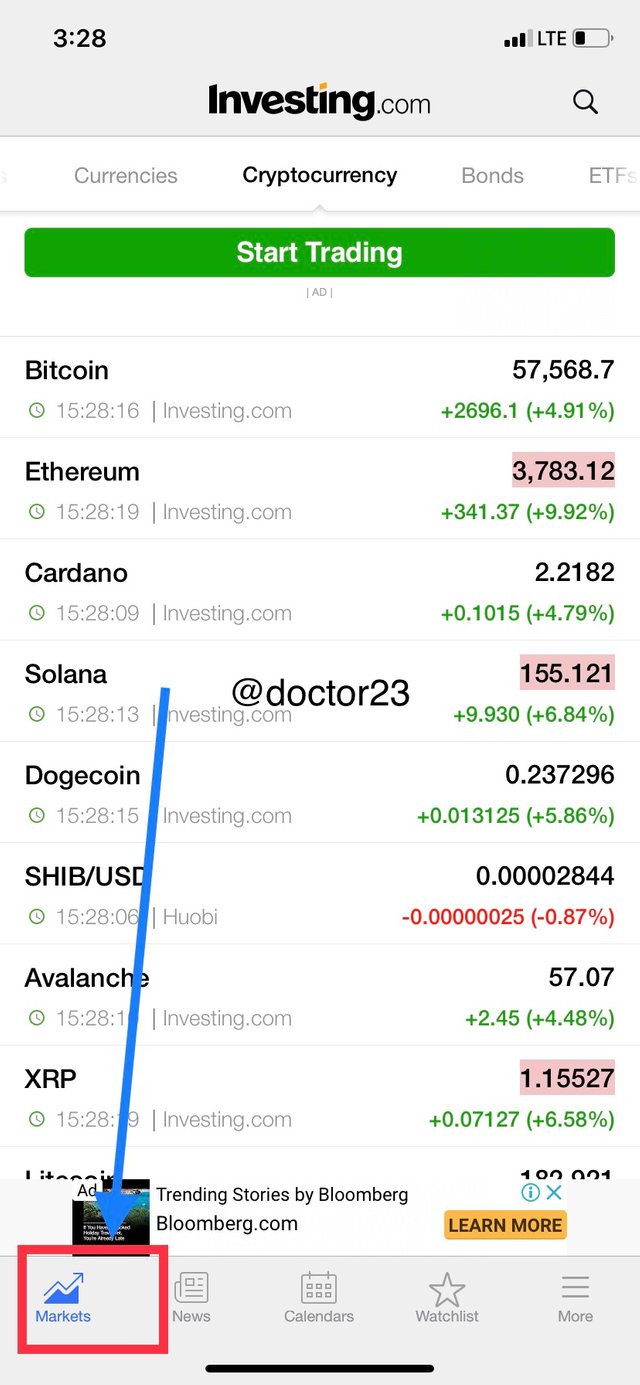
Using the Investing.com platform
I will demonstrate how to add the chaikin indicator to a chart using Investing.com. We can see that in the following steps below.
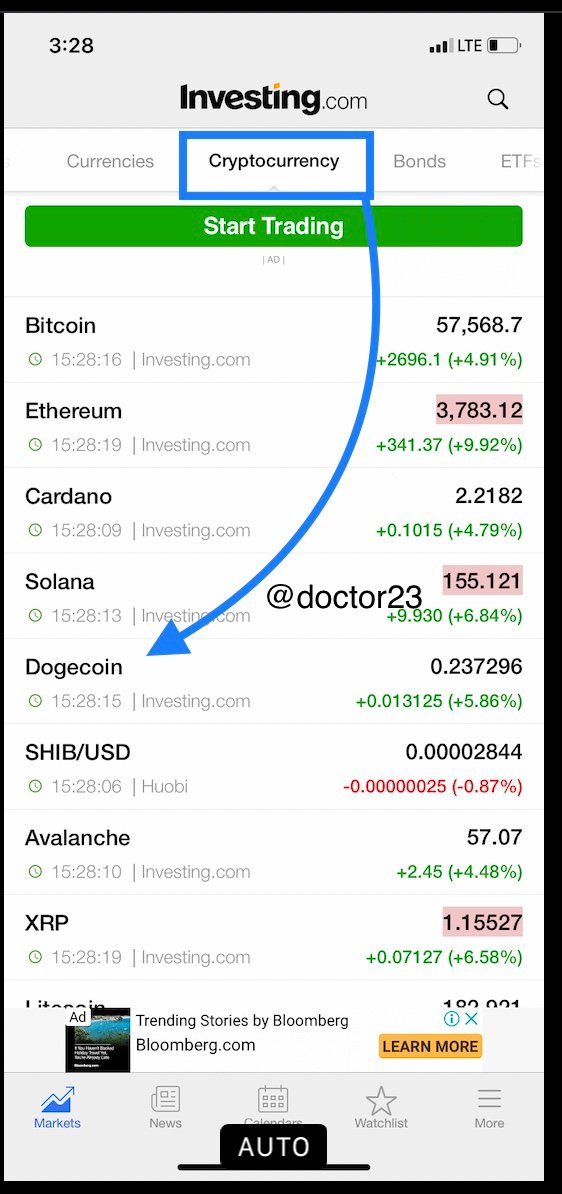
Step 1
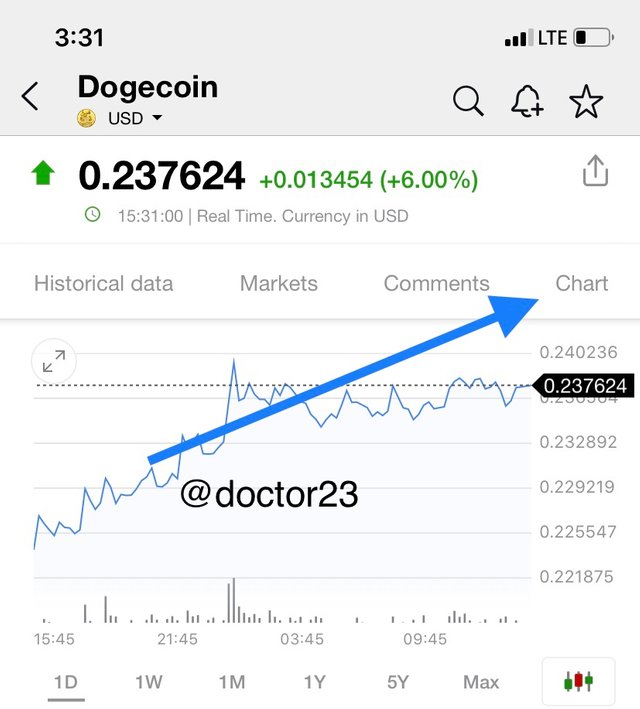
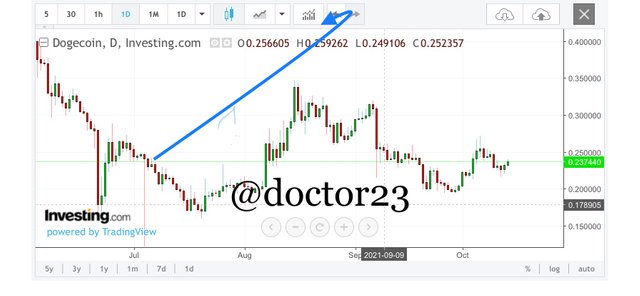
We begin by logging into the investing.com platform, and selecting the desired cryptocurrency which I will be adding the indicator on. In this case it will be the ethereum cryptocurrency which I finalized by clicking on charts.
Step 2
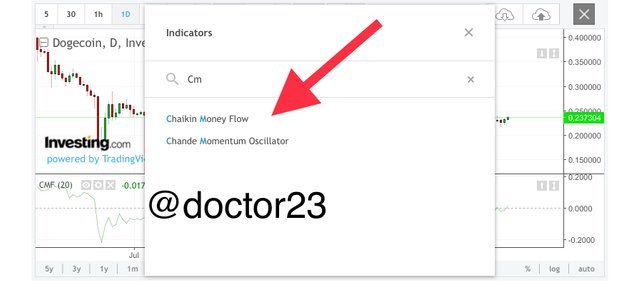
On the chart now, I click on the indicator tab which I search chaikin money flow and select it as shown in the screenshots below.
The Chaikin Configuration
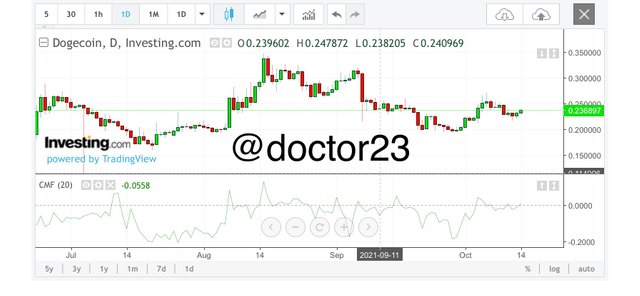
For the configuration, we can configure it by clicking on the indicator tab and taking the setting button. We can see the various settings below as seen below.
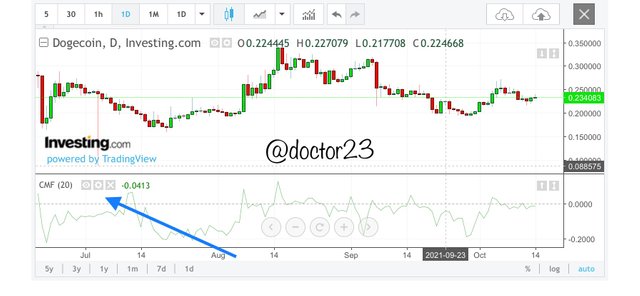
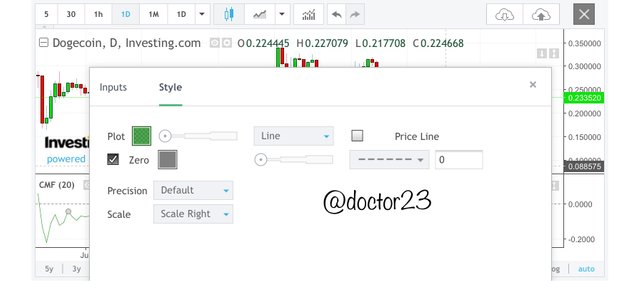
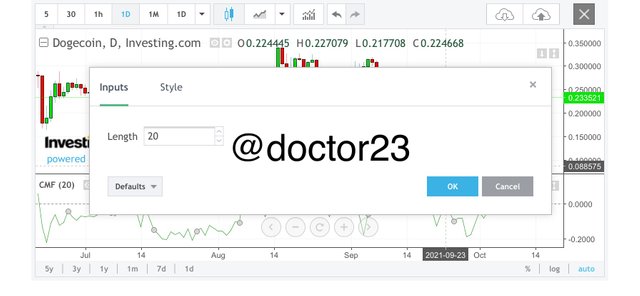
The default settings for the chaikin money flow is the 21 or the 20 which corresponds to one trading month as earlier mentioned above.
It is preferable to leave the settings of the indicator to the default settings as setting the period to greater period will indicate less volatility and lateral movements.
So to conclude, it is much preferable to leave the trading period of the chaikin money flow to the 21 or the 20 period.

QUESTION 3
What is the indicators role in the confirmation of the direction of the trend and determining entry and exit points for buy and sell
The confirmation of the direction of trend using the CMF indicator
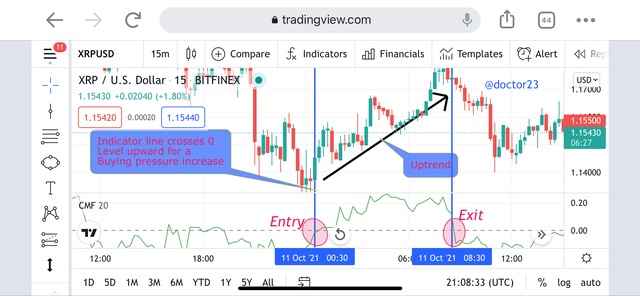
Up-Trend
The chaikin money flow indicator can be used to locate buying pressure on an uptrend. The uptrend is confirmed when we have the chaikin indicator line making a cross above the 0 level which is the midpoint. A cross of the 0 level which moves toward the positive values indicates a high demand for that particular asset.
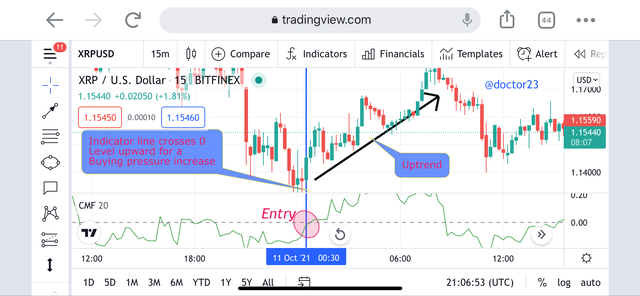
We can then see the entry and the exit regions in the charts below. As mentioned above, the indicator line shows a buy with the cross of the 0 level upward. The entry will be just slightly above the cross of the line while the exit will be at some point showing a reverse pattern.
Downtrend-Trend
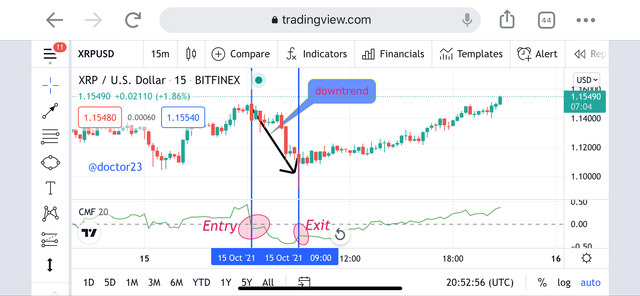
The chaikin money flow indicator can be used to locate selling pressures on a downtrend. The downtrend is confirmed when we have the chaikin indicator line making a cross below the 0 level which is the midpoint. A cross of the 0 level which moves toward the negative values indicates a high supply for that particular asset.
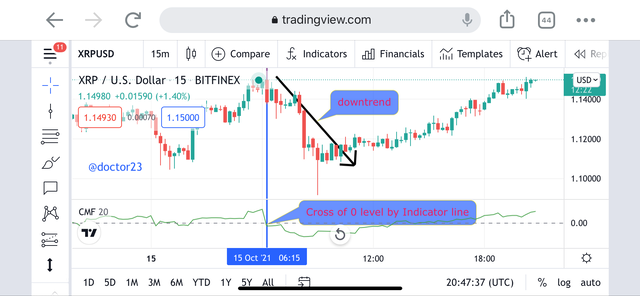
We can then see the entry and the exit regions in the charts below. As mentioned above, the indicator line shows a sell with the cross of the 0 level downward. The entry will be just slightly below the cross of the line while the exit will be at some point showing a reverse pattern.

QUESTION 4
Trade with a crossover signal between the cmf and wider lines such as +/- 0.1 or 0.15 or 0.2, identify the most important signals that can be extracted using several examples as well.
Trading with Crossover signals between CMF
Using +/- 0.1 level
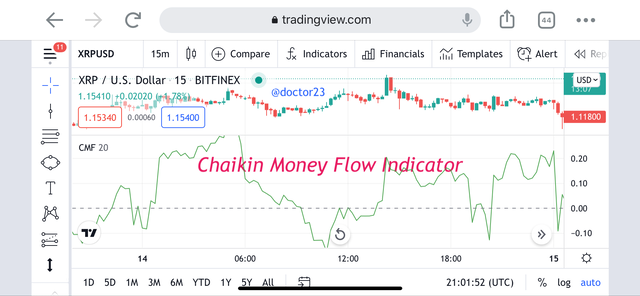
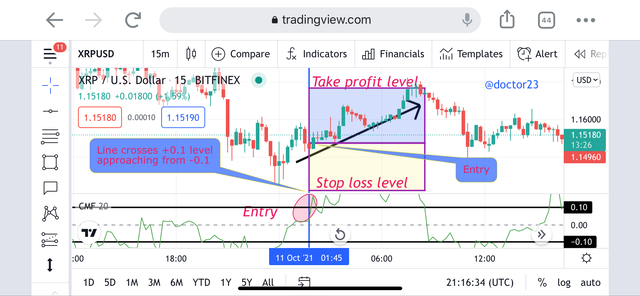
Buy Opportunities with xrp/usd
Using the chaikin money flow indicator, we can use the +0.1 and the -0.1 levels to create buying opportunities.
The buying opportunity is created when we have the cross of the indicator line at the +0.1 level. Here we see the indicator line crossing the +0.1 level with a movement of the indicator from the -0.1 level. With the cross, we can safely place a buy order just after the cross. And the stop loss and the take profit level will be set using a risk to reward ratio of 1:1. The stop loss level will be place below the recent swing low point and take profit level will be calculated using the take profit level.
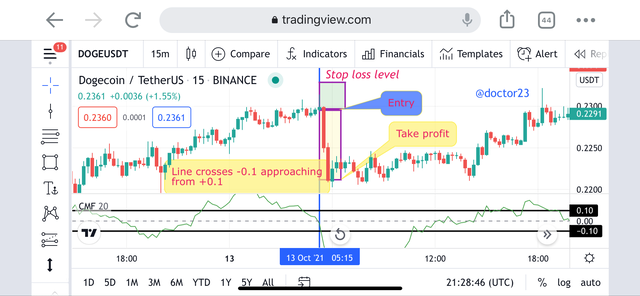
Sell Opportunities with doge/usdt
Using the chaikin money flow indicator, we can use the +0.1 and the -0.1 levels to create selling opportunities.
The selling opportunity is created when we have the cross of the indicator line at the -0.1 level. Here we see the indicator line crossing the -0.1 level with a movement of the indicator from the +0.1 level. With this cross, we can safely place a sell order just after the cross. And the stop loss and the take profit level will be set using a risk to reward ratio of 1:1. The stop loss level will be place below the recent swing high point and take profit level will be calculated using the take profit level.
Using +/- 0.15 level
Buy Opportunities xrp/usd
The buying opportunity is created when we have the cross of the indicator line at the +0.15 level. Here we see the indicator line crossing the +0.15 level with a movement of the indicator from the -0.15 level. With the cross, we can safely place a buy order just after the cross. And the stop loss and the take profit level will be set using a risk to reward ratio of 1:1. The stop loss level will be place below the recent swing low point and take profit level will be calculated using the take profit level.

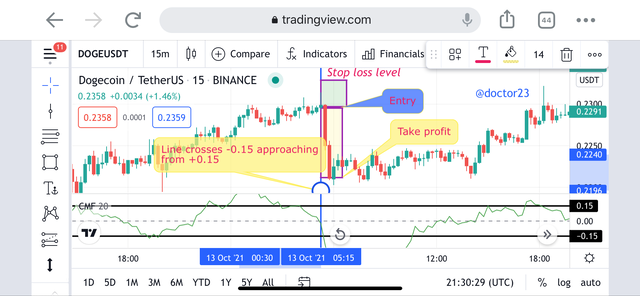
Sell Opportunities doge/usdt
The selling opportunity is created when we have the cross of the indicator line at the -0.15 level. Here we see the indicator line crossing the -0.15 level with a movement of the indicator from the +0.15 level. With this cross, we can safely place a sell order just after the cross. And the stop loss and the take profit level will be set using a risk to reward ratio of 1:1. The stop loss level will be place below the recent swing high point and take profit level will be calculated using the take profit level.

QUESTION 5
How to trade with divergence between the cmf and price line. Does this trading strategy produce false signals?
How to trade divergence with CMF
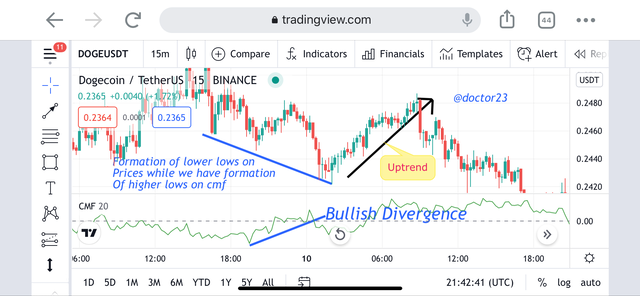
Bullish Divergence with CMF
Explaining the Bullish Divergence with chaikin money flow indicator, we see that it a situation seen in the movement of the prices with the formation lower highs in a downtrend while the chaikin indicator line will show uptrend movement of the chaikin money flow indicator with the formation of higher lows.
This mechanism often comes with trend reversals and we can see the proper entry and exit regions as shown in the charts below.
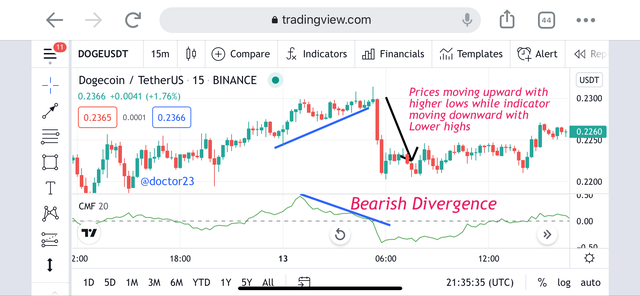
Bearish Divergence with CMF
Explaining the Bearish Divergence with chaikin money flow indicator, we see that it a situation seen in the movement of the prices with the formation higher lows in an uptrend while the chaikin indicator line will show a downtrend movement of the chaikin money flow indicator with the formation of lower highs.
This mechanism often comes with trend reversals and we can see the proper entry and exit regions as shown in the charts below.
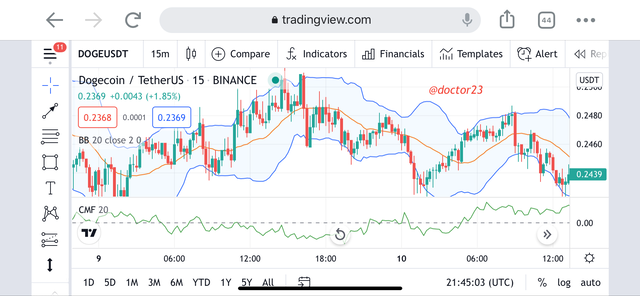
False signal generation with the trading strategy
The chaikin money flow index is no difference in the production of false signals as other indicators. The divergence strategy can sometimes show early trend reversals which turns out to be misleading. The best way to avoid this type of scenario is the usage of confluence, which is the usage multiple indicators to confirm a signal. I will be using the Bollinger band indicator and the chaikin to demonstrate as shown below.

Conclusion
The chaikin money flow technical indicator as described earlier is a technical indicator which measures the money flow volume in a defined period.
The indicator has its midpoint as the 0 level which is used to find buying and selling pressures. A cross of the indicator line above the 0 level shows a buying pressure while a cross below shows a selling pressure.
We can also increase the probability of the signal using the crosses of the +/-0.1, +/-0.15, +/-0.2 …
When we have the cross of one of the levels with an approach from the opposite level it increases the buying and selling pressures.
all screenshots are taken from investing.com and tradingview.com
Unfortunately, after our checks and investigations, we found that your account is an alternate account for @blaisebass1. There are similarities in content between users - @blaisebass1 & @doctor23; In addition to several transfers between them.
Total|0 /10
Operating an alternate account to earn a disproportionate reward is a flagrant violation of Steemit Cryto Academy. Hence, you are now blacklisted.
Thank you.
Cc: @sapwood @steemcurator01
No sir
I do sell my crypto to him in exchange for the local currency CFA
He is the only one available who buys from me with good rates
And more over, some months ago I lost 101 STEEM when I tried to use POLONIEX to withdraw, so I usually sell them to him, he buys at BINANCE rates from me
The screenshots above shows our transactions via WhatsApp and proof of mobile money payment received for the coins transferred to him
These are just a few of the multiple transactions done with him
Hello Sir @kouba01, @sapwood
I do buy sbd and Steem in exchange for fcfa for most Cameroonians who are not willing to withdraw at the moment.
Which is the reason for the numerous transactions.
I didn’t know I couldn’t do those transactions. My sincere apologies, I won’t be buying again 🙏🏾🙏🏾🙏🏾
Below are some attached screenshots.
One last chance will be appropriate 🙏🏾
The screenshots provided by WhatsApp do not show anything, only the conversations for sale steem between people unknown to us. The investigations also included other elements that you did not want to talk about, such as writing style, formatting, and content, where we noticed several similarities between the two accounts.
Cc: @sapwood @steemcurator01
I do accept the fault Sir @kouba01
And pleading to take that as the first Warning
🙏🏾🙏🏾🙏🏾🙏🏾🙏🏾🙏🏾🙏🏾🙏🏾🙏🏾🙏🏾
My sincere apologies.
Pleading for a second chance. Promising it won’t happen again 😭😭😭