Crypto Academy Season 2 Week 8 , Homework post for [ @kouba01 ] on Bollinger bands by @doctor23
Question 1
Define the Bollinger Bands indicator by explaining its calculation method, how does it work? and what is the best Bollinger Band setup?
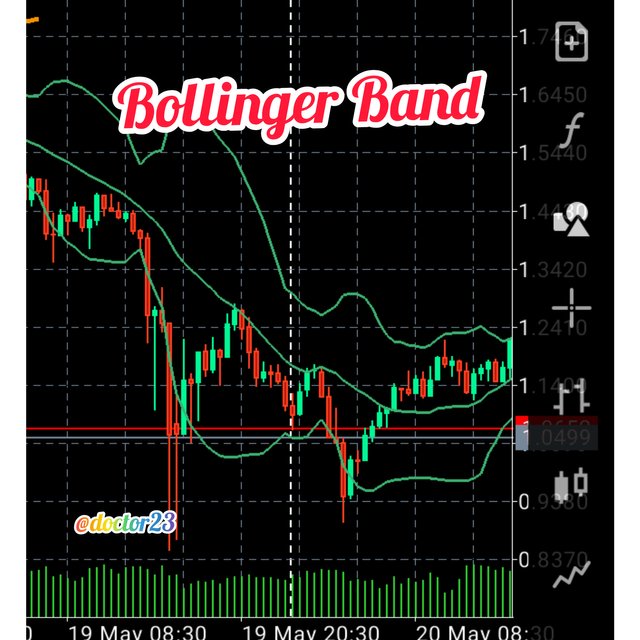
Defining Bollinger bands in Simple terms, i will say it is a technical trading tool.
It is advantageous because it applied in all financial markets with crypto currencies inclusive.
In more descriptive definition, Bollinger band is an indicator used to measure a markets volatility. Bollinger bands indicates when the market is Loud or Quite. When the market is Quite, Bollinger bands contracts, and when its loud, it Expands.
Bollinger band was discovered by John Bollinger in 1980, pretty well, he named his indicator after his name.
Well, for this lesson, i will be explaining how Bollinger Bands is calculated, although on trading platforms it is already set automatic, meaning you will not necessarily be performing this calculations before using the bollinger band indicator.
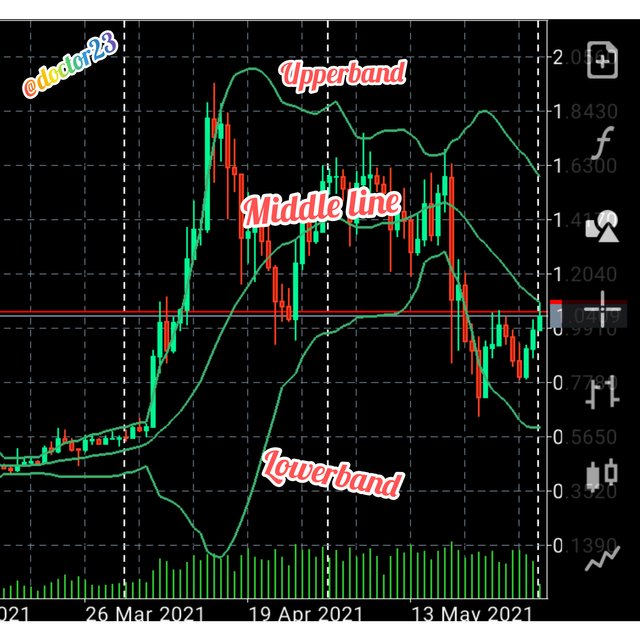
The Bollinger Band consist of 3 lines, the Upper band, the lower Band, and the middle moving average line.
The middle line which is the moving average line is calculated by the summation of a defined number of candle sticks divided by the defined number. For example, to calculate the 20 period moving average, i add up the closing prices of the last 20 candlestick, depending on which timeframe, and divide by 20
Moving Average = Sum of the prices over "x" days/number of daysThe upper band which is located above the moving average, it is calculated by the close of the moving average, and adding standard deviations to it. Meaning,
It will be calculated thus;
MovingAverage20 + (2*20Standard Deviation of Close)The lower band which is located below the moving average, it is calculated by the close of the moving average, and subtracting standard deviations from it. Meaning,
It will be calculated thus;
MovingAverage20 - (2*20Standard Deviation of Close)
As i explained above, Bollinger bands is an indicator used solely for identification of Volatile pairs.
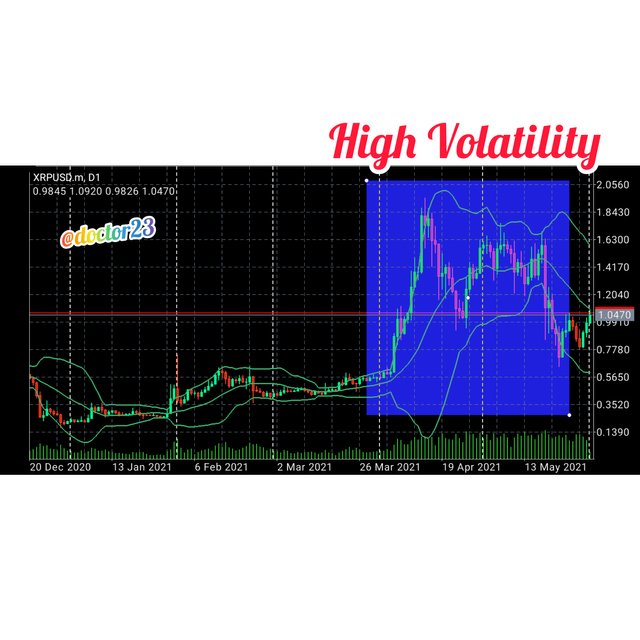

Bollinger Band identifies potential overbought and oversold and observation of market volatilities.
If the price is near the upper band, prices are considered expensive, meaning a sell signal will be placed, as the upper band acts as a resistance,
And if prices are near the lower band, prices are considered to be cheap, and a buy signal will be placed, as it will be acting as a support.
Bollinger bands also work in the identification of overbought and oversold areas
Note: you should not just placed orders after identifications of overbought or oversold, as i will be explaining further below.

I will say the most preferable setup for Bollinger band should be the
- 20 moving average
- 2 Standard deviation Up
- 2 Standard deviation down
But, to identify more points of overbought and sold, you can use the offset of 3 standard deviation for the upper and lowerband.
Question 2
What is a breakout and how do you determine it? (Screenshot required)

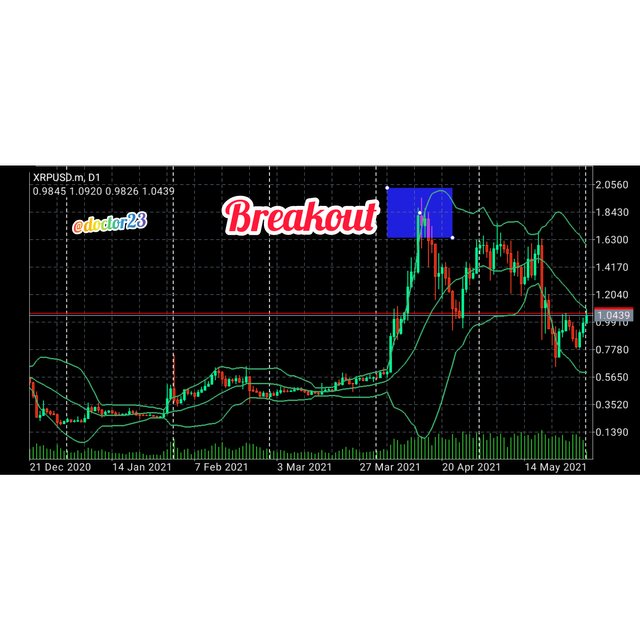
A Breakout is a scenario in which prices of an asset, moves below a support level or above a resistance level.
This is often a key level when properly identified, especially with the trend of the market. In Bollinger bands, when prices moves out of the upper or lower band, it is considered as breakouts. This breakout are often used vividly to determine trend reversals, as when a full candlestick forms outside, the next forming inside indicates the trend which will be formed.
Question 3
How to use Bollinger bands with a trending market? (screenshot required)
Bollinger band is a key indicator which can be used to determine the trend of a market, plus for quiet markets, Bollinger turns to be of less usage.
In trading with Bollinger Band in a trending market, we need to identify potential buy and sell zones.
I will be using two Bollinger bands.
One with a Standard deviation of 1, and the other with a standard deviation of 2, on the same chart.
I will be identifying the sell zone and the buy zone.

In trading with Bollinger Band in a trending market, we need to identify potential buy and sell zones.
I will be using two Bollinger bands.
One with a Standard deviation of 1, and the other with a standard deviation of 2, on the same chart.
I will be identifying the sell zone and the buy zone.
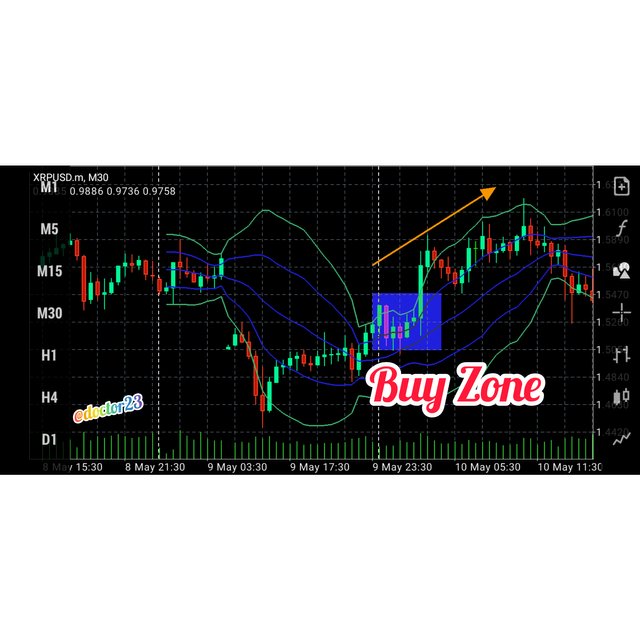
We can locate our Buy zone, which is the portion between the Upper Band of the Standard deviation 1 and 2 of the Bollinger Band. It indicates, we place a Buy Order. Meaning that an Uptrend is seen when prices is in the Buy Zone.
Question 4
What is the best indicator to use with Bollinger Bands to make your trade more meaningful? (Screenshot required) (Screenshot required)
Stochastic
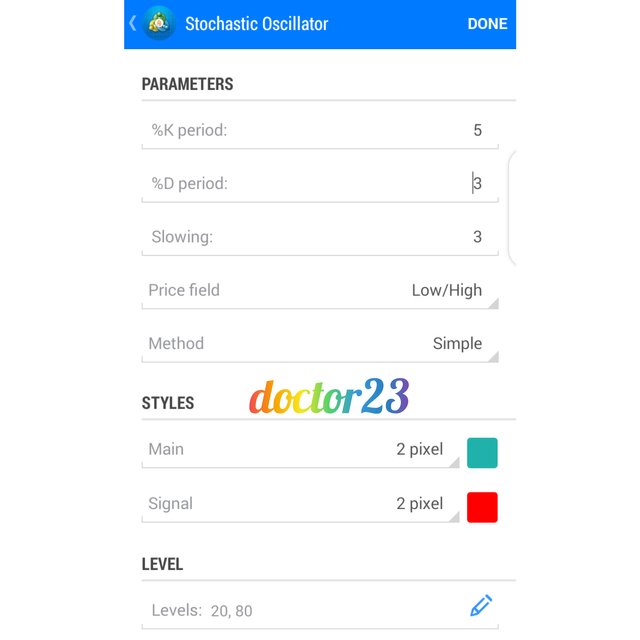
I am choosing Stochastic to be the best indicator to use alongside the Bollinger Band, as it identifies Relative overbought and oversold zones in a market. Beside Stochastics, i would have been choosing Relative Strength Index as well.
The above screenshot shows the default setting of the Stochastic Indicator which i assume to be just fine.

We identify the prices touching the upper band of the Bollinger indicator, showing a sell signal, and simultanously, the Stochastic Indicator Shows a region of overbought, meaning buyers are preparing to sell their assets
We identify the prices touching the lower band of the Bollinger indicator, showing a buy signal, and simultanously, the Stochastic Indicator Shows a region of oversold, meaning sellers are preparing to buy assets

Beside the Stochastic Indicator, we can also use trend lines as well as chart pattern. In the screenshot above, we identify prices bouncing of the support and resistance line, and also the upper and lower bands acting as dynamic supports and resistance.
Question 5
What timeframe does the Bollinger Bands work best on?And why? (Screenshots required)
Based on my view, i will say there is no particular timeframe in which the Bollinger band is perfect with. For instance, a day trader or scalping trader will use Bollinger band across the 15 and 30 minutes time frame, meanwhile a swing trader will use the different time frames such as the 4 hours, 1 day, week and monthly timeframe.
In conclusion to this, there is no perfect time frame, all you need to do is do your analysis on multiple time frame. I personally being a day trader, i will use the 15 and 30 minutes timeframe because it shows more volatility than higher time frames.
Question 6
Review the chart of any pair and present the various signals giving by the indicator Bollinger Bands. (Screenshot required)

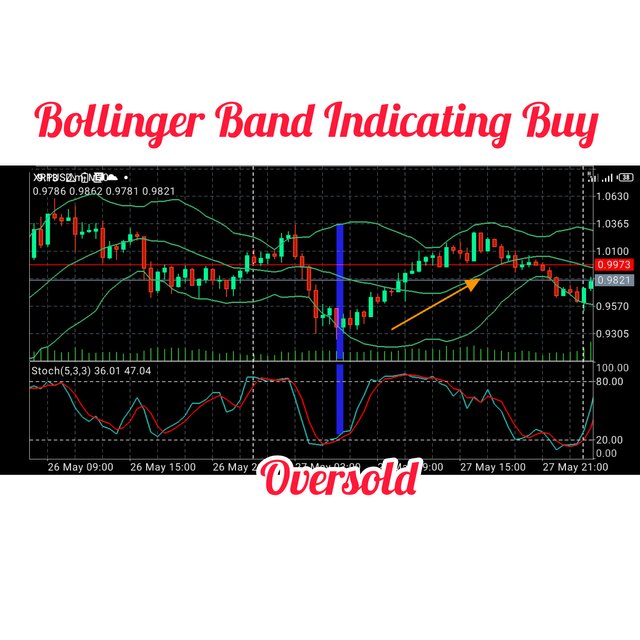
Using the 1 hour time frame of the xrp/usd pair, it is evident enough that we have a buy order, as prices just bounced off the lower band of the indicator. To indicate or add more value, i will use the stochastic indicator again.

The stochastic indicator showd potential oversold, meaning buyers are preparing to buy more Ripple.
Conclusion.
To conclude:
- Bollinger band is a very good indicator which can be used to locate over bought and over sold in a market, and also checking the volatility of the market.
- Bollinger band can be used to determine trends.
- In addition to Relative Strenght Index and Stochastics, Bollinger Bands can produce very good results with good Risk Management applied.
Hi @doctor23
Thanks for participating in the Steemit Crypto Academy
Feedback
This is good content. Thanks for demonstrating your understanding of the Bollinger bands trading tool. Question 6 lacked enough information.
Homework task
8