SOL/USDT Buy | S6T4 - Team Trading Post for Fredquantum-Kouba01 Traders Team


About Solana
Anatoly Yakovenko the founder of the Solana blockchain started the project in early 2017 but was later launched in March 2020.
Solana uses two different consensus algorithms. The proof of history and the proof of stake. However, the primary protocol is the proof of history which is structured to enhance the scalability by providing proof of history.
The primary aim of Solana is to emphasize creating a new decentralized financial system. Solana completes about 60000 transactions per second with just 200 nodes. Solana is arguable the fastest blockchain network. As part of the Solana project, Solana is expected to perform better than the previous blockchain technologies (BTC & ETH).
The Solana utilizes the cryptographic hash function which is made up of lengthy alphanumeric characters to secure the transactions make on the Solana blocks.
Solana is anticipated to be the best blockchain platform in the world. Its performance doesn’t stop amazing people. Others are certain that, Solana would certainly surpass the Ethereum blockchain.
Solana owns its native token also called Solana just like the blockchain name. The Sol token was built on the platform to be used for transaction fees. But due to how good the blockchain is performing, the Sol token is currently one of the best crypto assets to invest in. The project is attracting many investors. Solana is currently ranked among the 10 Altcoins with a very significant price compared to the others.
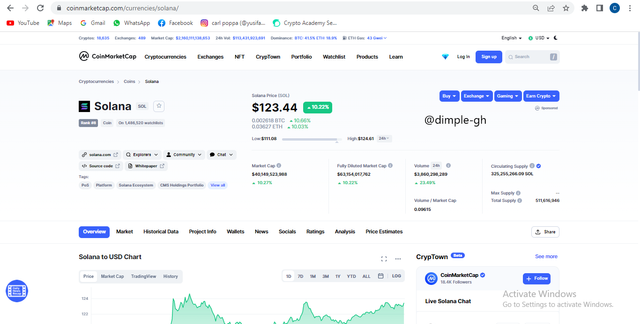
Price data of Solana
Technical analysis about Solana
I would make technical analyses on both longer and shorter timeframes. It is always advisable to make a complete analysis before you enter into trade.
Analysis on 1-day timeframe
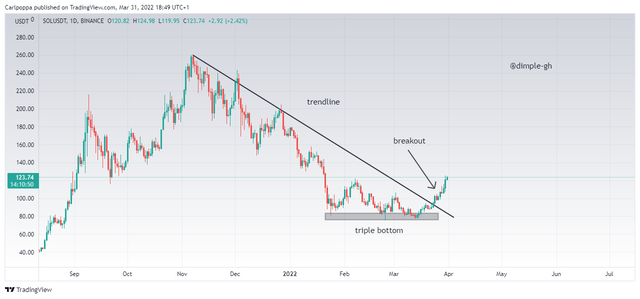
According to the 1-day timeframe chart, the whole momentum was bearish. The price was producing lower lows and lower highs.
But a triple bottom was formed at the strong support level to end the downtrend movement. Initially, when the price was in the downtrend, the trendline above serves as the resistance line. Now the trendline has been broken which suggests that the price is currently in a bullish trend reversal.
The breakout is very strong which suggests that the bullish trend reversal holds.
Analysis with 4-hour timeframe
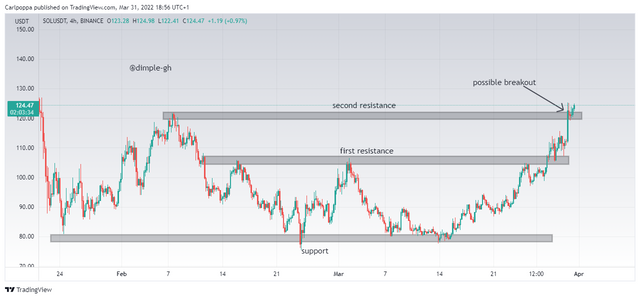
The timeframe above shows support and resistance levels.
After the price bounced off the support level, the price was again expected to be rejected by the resistance level but there was a breakout of the first resistance which suggests that there’s a possible bullish trend in the market just like the 1-day timeframe communicated to us.
After the first resistance breakout, the price was again expected to be rejected by the second resistance. But the price has currently broken slightly above the resistance level which means that this is a new beginning of a breakout.
I would take trades for the breakout on the smaller timeframe chart.
Analysis with 1-hour timeframe
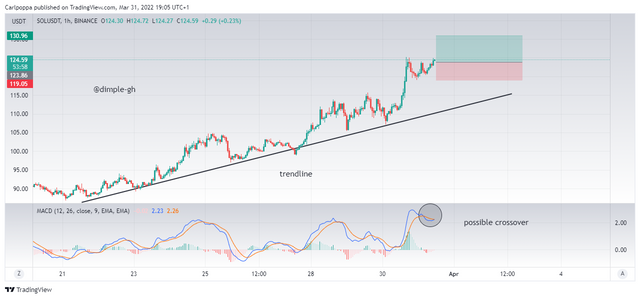
Here, I would take a very simple trade with the help of The MACD Indicator.
Looking at the chart above, many traders would like to enter into a sell trade. This is because we expect the price to retrace back to hit the trendline.
But looking at the chart again, the price is in a very strong bullish momentum which could be very risky if we take sell trades.
The MACD indicator is also about to crossover for bullish confirmation. But from our knowledge and experience, technical indicators are very slow when identifying early signals. Hence, we anticipate a possible crossover and take the trades.
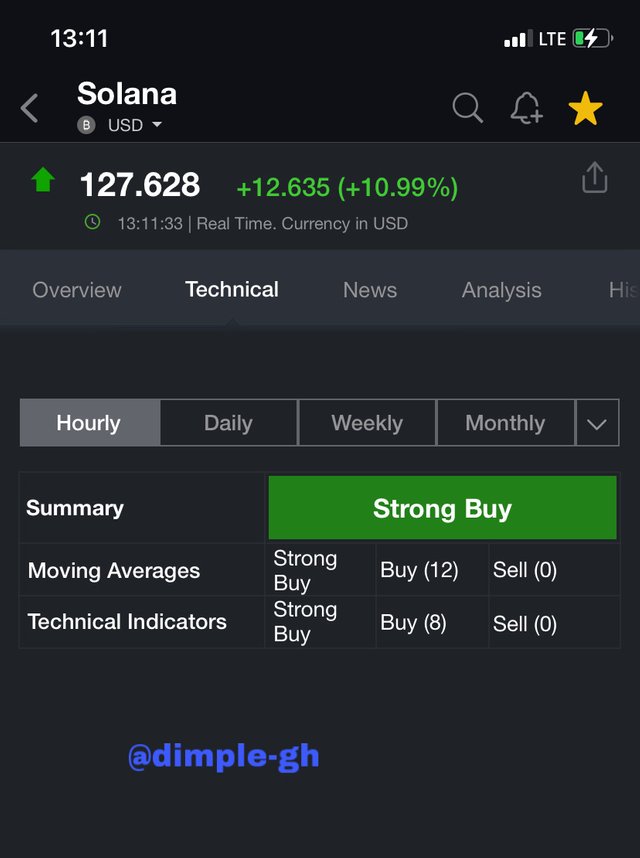
The above is a platform called Investing.com, they give fundamental analysis and technical analysis as well.
To our amazement, all the 20 different technical indicators are communicating a strong buy signal.
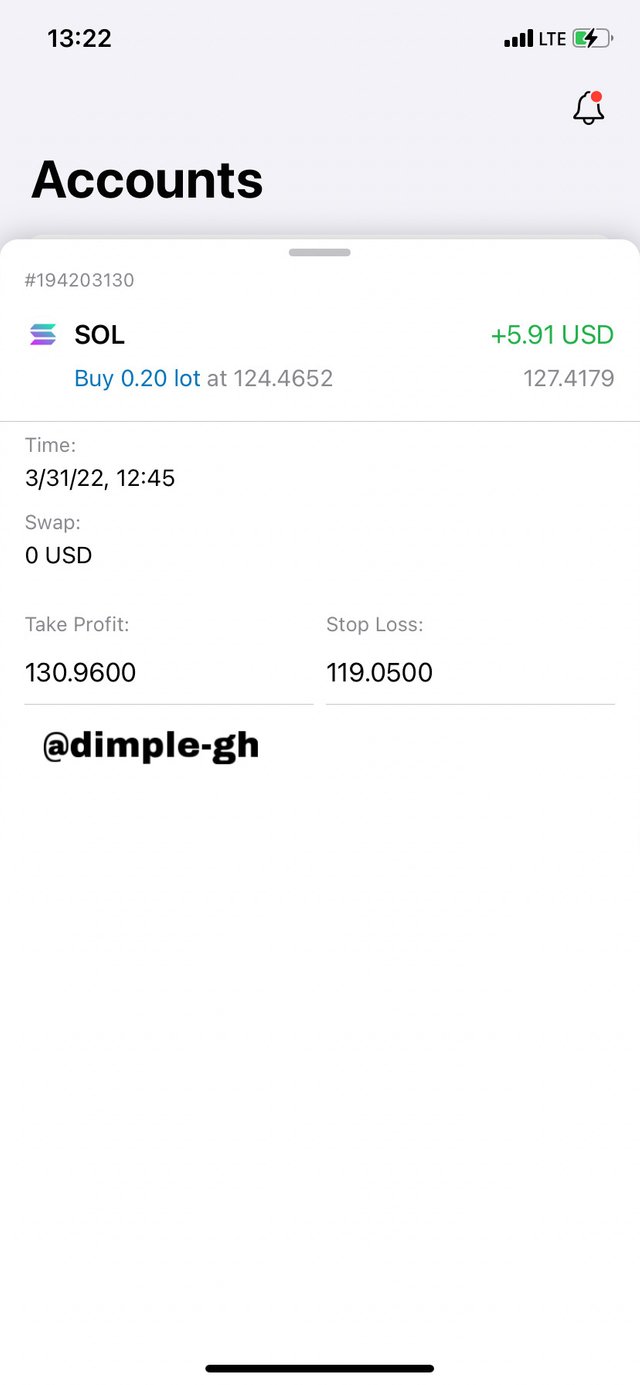
Trade placed in my Exness broker account
Conclusion
Today, I made some good profits. I closed the trade at 30 pips profits this is because I used good risk management. Talking from price movements, I could have made more profits if I had waited for take-profit.
However, the price could have retraced back to probably stop loss. That’s why is very good to take partial profits when necessary.